
I'm Marcus Crypto Expert & Strategist • Verified Kol CMC & #Binance Square • $BTC Since 2015• DM t.me/CryptoBull009
Joined November 2023
- Tweets 8,461
- Following 527
- Followers 18,624
- Likes 7,265
898 Photos and videos


Pinned Tweet

29 Jun 2025
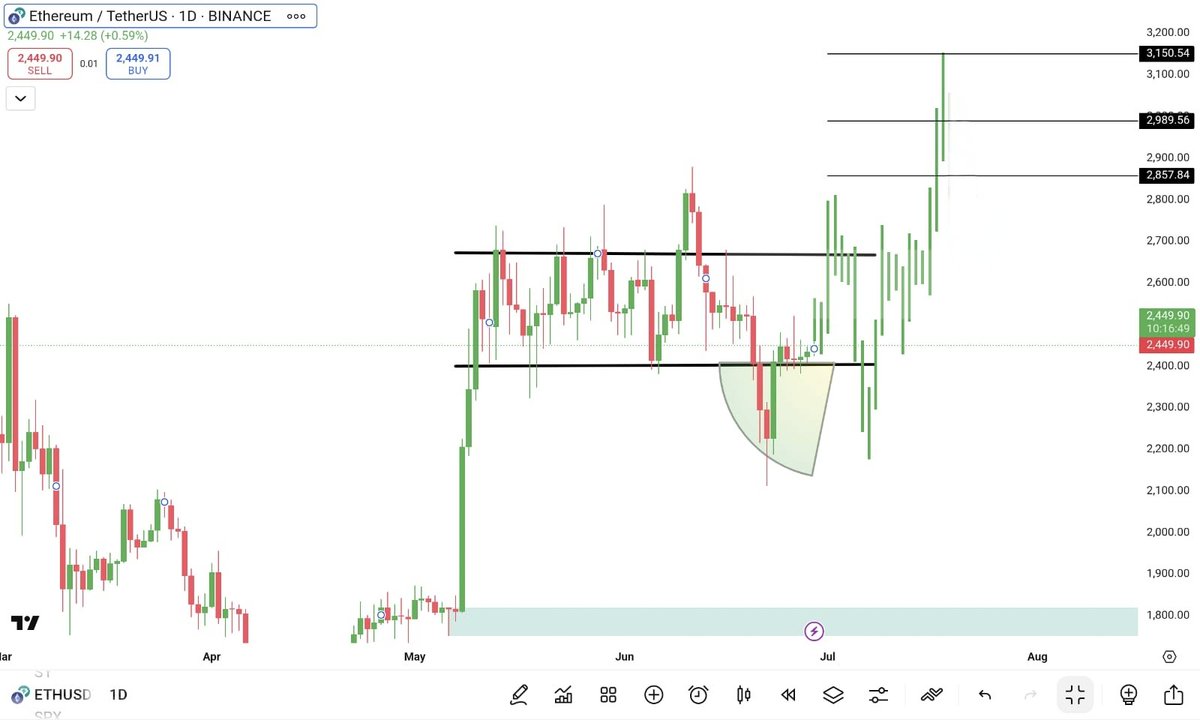
$ETH just trapped both bulls and bears. Classic shakeout.
1. Liquidity swept on both sides , fuel is loaded.
2. Sentiment confused = perfect launch conditions.
3. If $3,500 flips clean… ignition.
This was the reset. Now we send it higher.
161
29
402
79,914
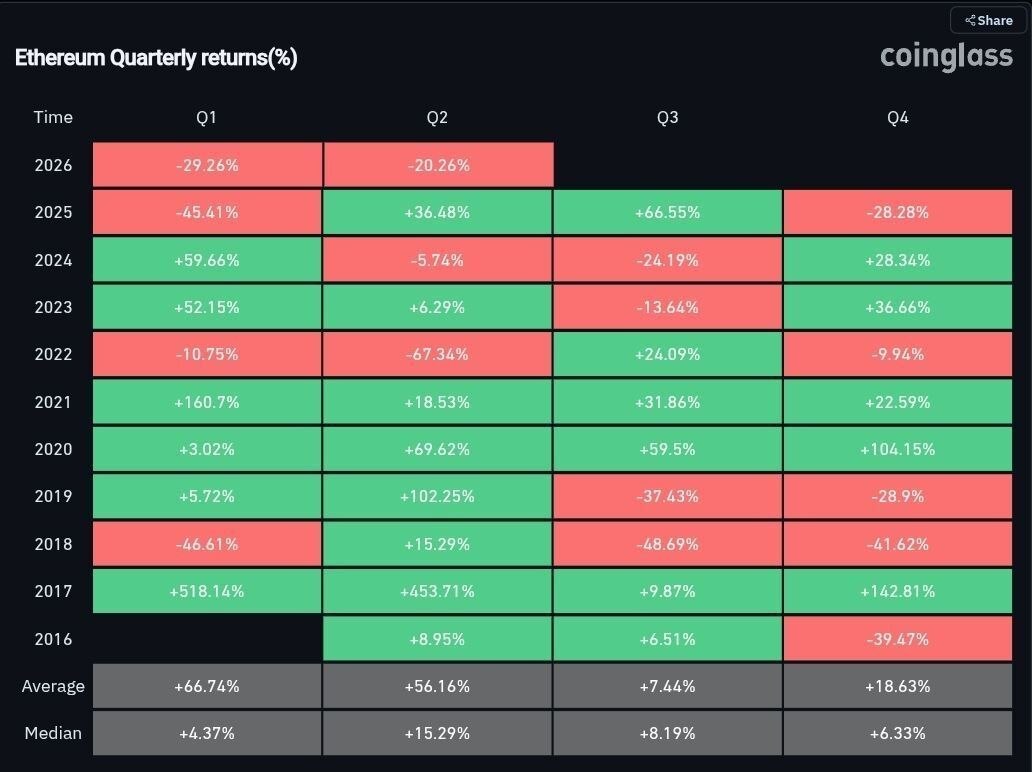
$ETH Just Did Something It Has NEVER Done Before…
For the first time in Ethereum’s history, $ETH is on track to print 3 consecutive red quarters:
🔴 Q4 2025: -28.28%
🔴 Q1 2026: -29.26%
🔴 Q2 2026 (so far): -20.26%
Since 2016, Ethereum has survived bear markets, black swan events, exchange collapses, and brutal corrections — yet it has never recorded three straight losing quarters.
What's even more interesting?
📊 Historically: • Q3 has averaged 7.44% returns
• Median Q3 return sits at 8.19%
• Some of ETH's strongest recoveries came after periods of extreme pessimism
Markets reward patience when fear is at its peak.
The question isn't whether sentiment is bearish right now.
The question is:
Will Q3 2026 become Ethereum's biggest relief rally… or the quarter that confirms a deeper structural shift?
Smart money is watching closely. 👀
61
11
107
7,141
Jun 14
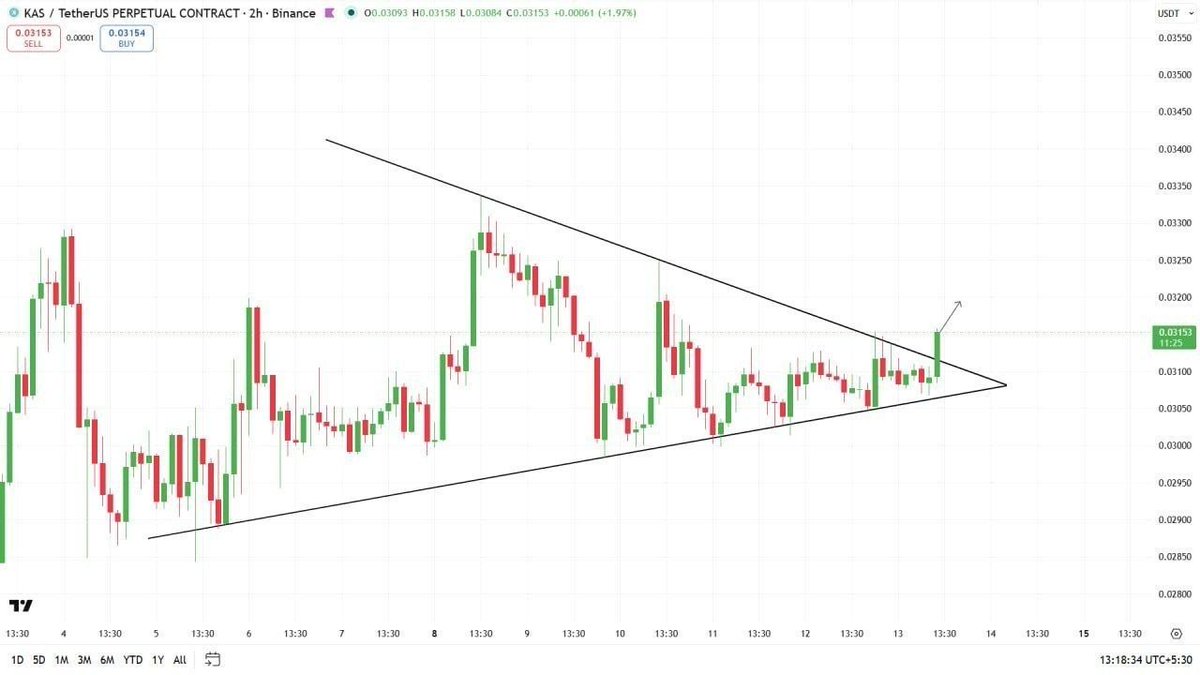
$KAS is breaking out of its symmetrical triangle pattern.
After an extended period of consolidation, price is attempting to move beyond a key resistance zone. The longer the compression, the stronger the potential expansion, and KAS has been building pressure for weeks.
Volume is beginning to increase, momentum is improving, and the next few candles will be critical. A confirmed breakout and hold above resistance could trigger a significant upside move.
Keep this one on your watchlist. The setup is becoming very interesting.
63
24
111
7,629


Crypto → Stocks, ETFs, and Tokenized Securities.
Learn more about our next chapter 👉 binance.com/en/blog/markets/…

146
117
550
68,123
Jun 13
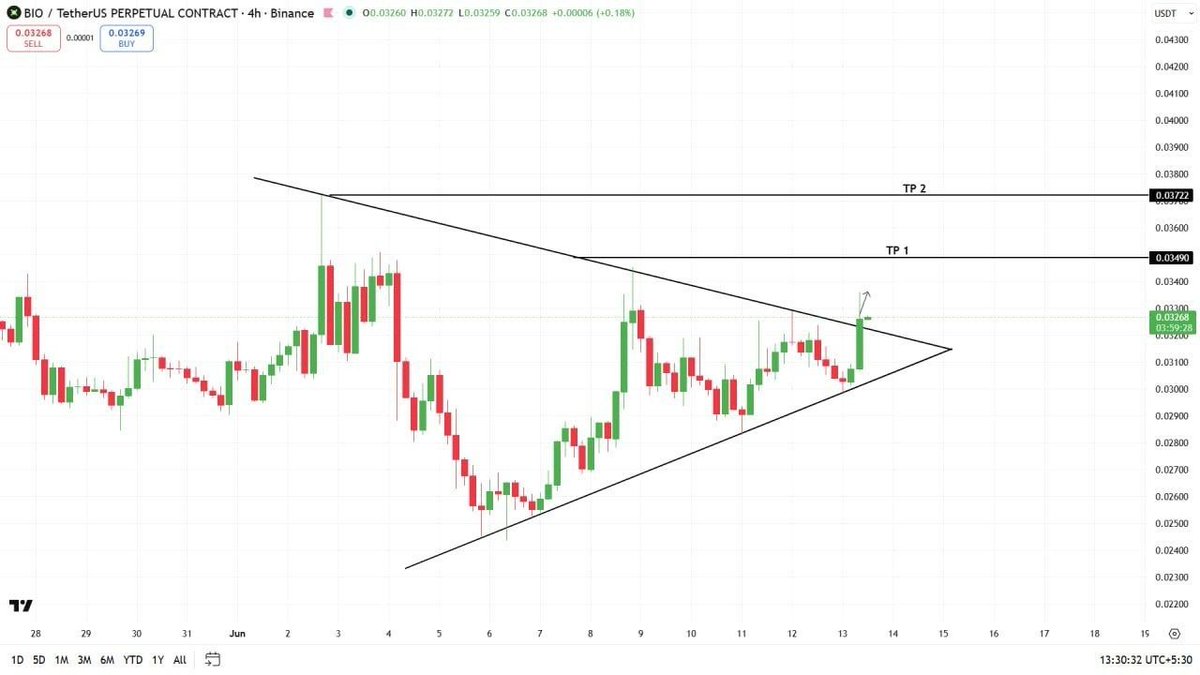
$BIO has officially broken out of a Symmetrical Triangle pattern, signaling that bullish momentum may be starting to build.
After a prolonged period of consolidation and tightening price action, the breakout has finally arrived.
This type of structure often precedes a strong directional move, and the current price behavior suggests buyers are beginning to take control.
The breakout has shifted attention toward the upside, with the market now watching for continuation and acceleration.
If momentum continues to strengthen, price could start moving rapidly toward the higher target zones.
The structure has already been broken, and the next phase is all about follow-through.
Keep a close eye on $BIO, as this move could develop into a significant pump in the sessions ahead.
70
16
105
7,361
Jun 12
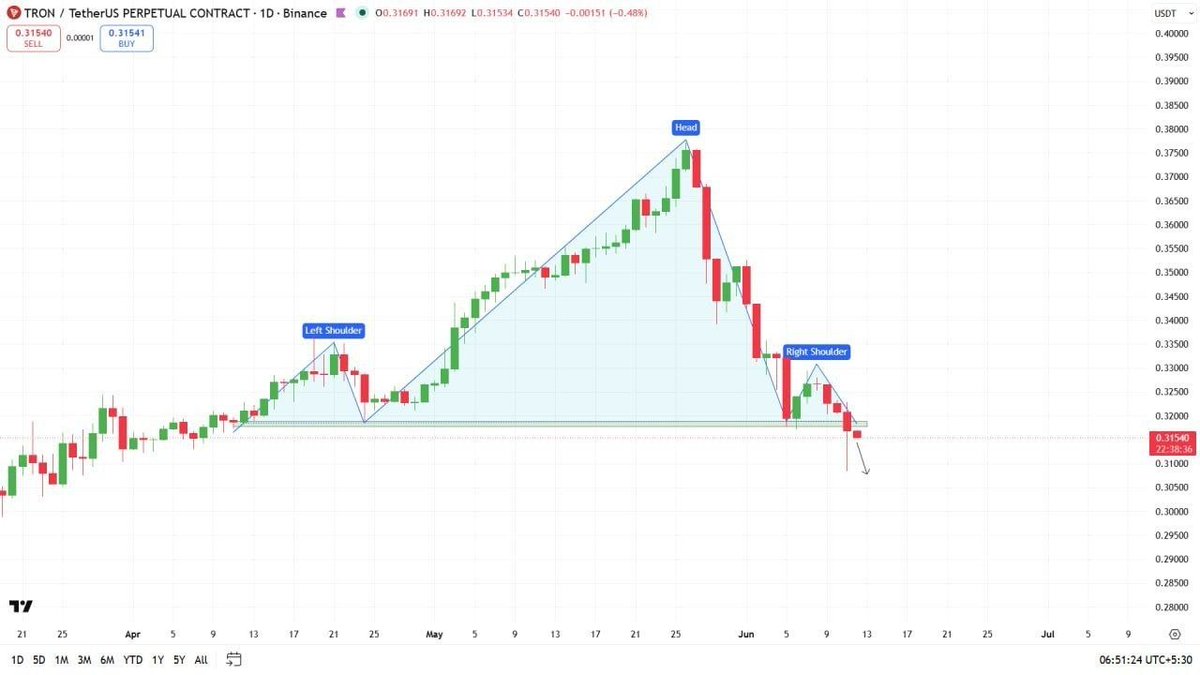
$TRX looks bearish after breaking down from a Head and Shoulders pattern, a structure that often signals a potential trend reversal and further downside momentum.
The breakdown has increased bearish pressure, and a continuation to the downside remains likely as long as price stays below the neckline.
Keep this one on your watchlist and track price action closely for confirmation of further weakness in the coming sessions.
57
18
78
3,966
Jun 11
$SPX has already broken out of the descending channel on the hourly timeframe, which is a strong bullish signal.
The breakout suggests that bearish momentum is weakening, and the market may be preparing for a trend reversal.
A successful retest of the breakout zone would strengthen the bullish case and could trigger a significant upward move.
The structure is looking constructive, but confirmation remains key. If buyers hold the retest area, SPX could be setting up for its next leg higher.
Currently tracking this setup closely...
76
15
89
7,525
Jun 10
$NFP has already broken down from the symmetrical triangle pattern, confirming bearish momentum.
The move played out as expected, with price reaching the lower targets after the breakdown.
This serves as another example of how technical patterns can provide valuable insight when combined with disciplined execution.
Keep tracking the price action closely, as further volatility may follow.
Manage risk and stay prepared for the next setup.
55
20
73
9,741
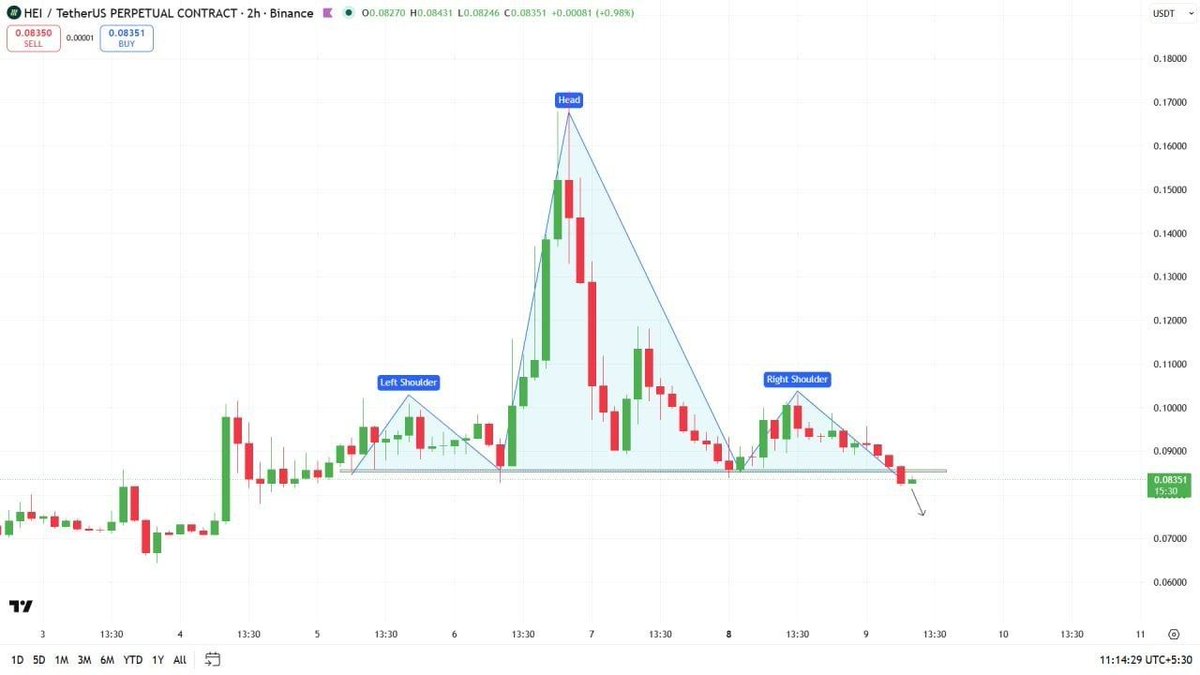
$HEI has broken down from a Head and Shoulders pattern, signaling growing bearish momentum.
The structure suggests sellers are taking control, with price now trading below a key support zone.
As long as the breakdown remains intact, downside pressure is likely to continue building.
A move toward lower levels looks increasingly likely, and a sharper dump could follow if bears maintain control.
This bearish setup is developing cleanly and remains one to watch closely.
76
7
68
6,923
$VVV is tightening inside a symmetrical triangle and a major move looks close.
Price is compressing as buyers and sellers battle for control.
A clean breakout from this structure could unlock strong momentum and trigger a sharp upside move.
Patience is key here. Waiting for confirmation is better than chasing the range.
A successful breakout could be the spark that sends this much higher.
75
13
73
8,004
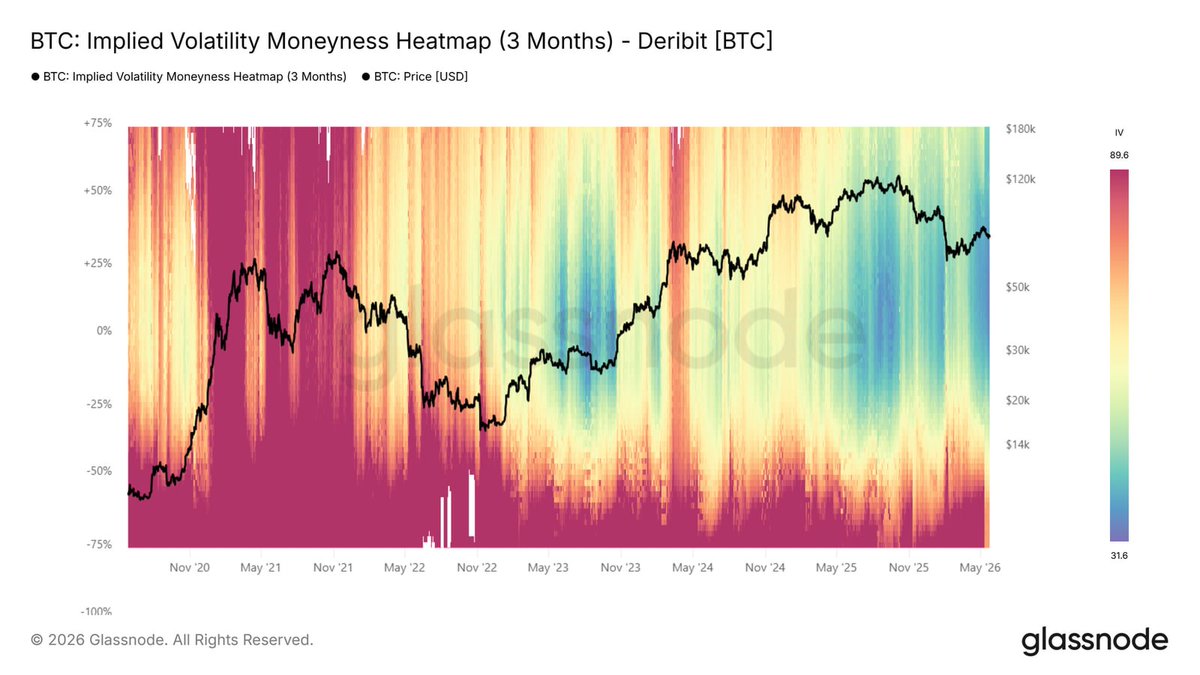
$BTC volatility is asleep. And that's usually when things get interesting.
Implied volatility across the entire options curve has dropped to multi-year lows, even below 2023 summer levels.
Calm conditions are spreading across all expiries. Traders aren't pricing in major moves, and hedging demand remains unusually weak across the board.
When volatility gets compressed this deeply, it rarely stays there forever.
The market is becoming comfortable with silence. I've seen this setup before. The longer the compression lasts, the more explosive the eventual expansion tends to be.
Bitcoin is approaching a major volatility inflection point. The next move could be far bigger than most expect.
70
15
72
7,453
$CELR is showing clear signs of weakness after losing its range support.
The recent breakdown has shifted market structure to the downside, and every bounce is getting sold into. Volume is fading on recoveries while sellers continue to apply pressure.
If this level isn't reclaimed soon, the next move could be a fast leg down as trapped longs start exiting positions.
For now, the path of least resistance looks lower. CELR remains one to watch for a potential downside extension.
73
14
77
7,404
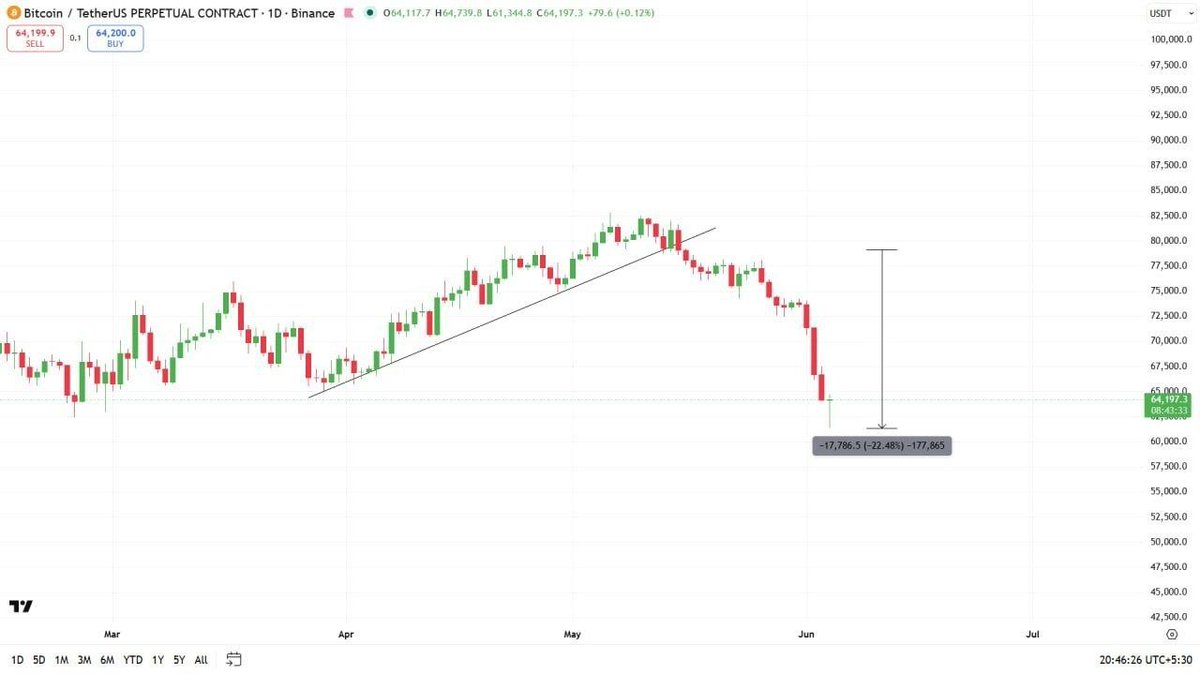
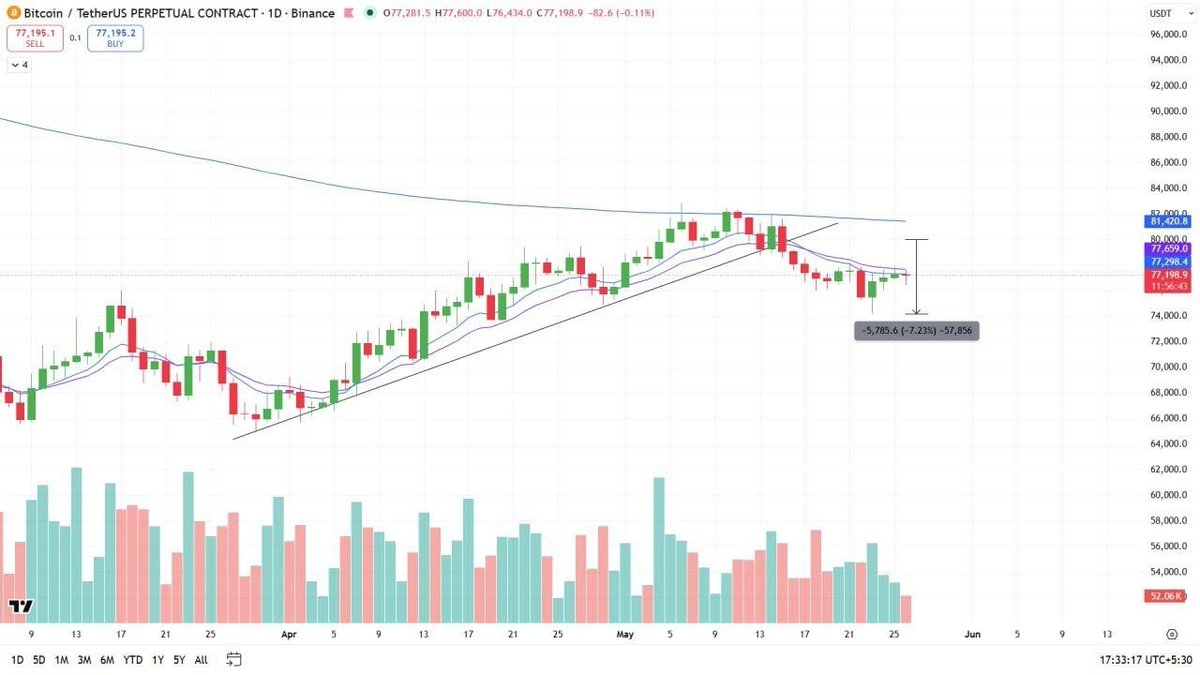
$BTC is dumping exactly after breaking below the support trendline, just as anticipated.
The breakdown triggered the move, and the bearish momentum followed through perfectly.
Already sitting on a 22% profit from the short position.
The setup was there, the signals were clear, and the market respected the structure.
Patience and discipline paid off. Enjoy the gains while the move continues to develop. Keeping a close eye on the next high-probability setup.
82
13
77
7,709
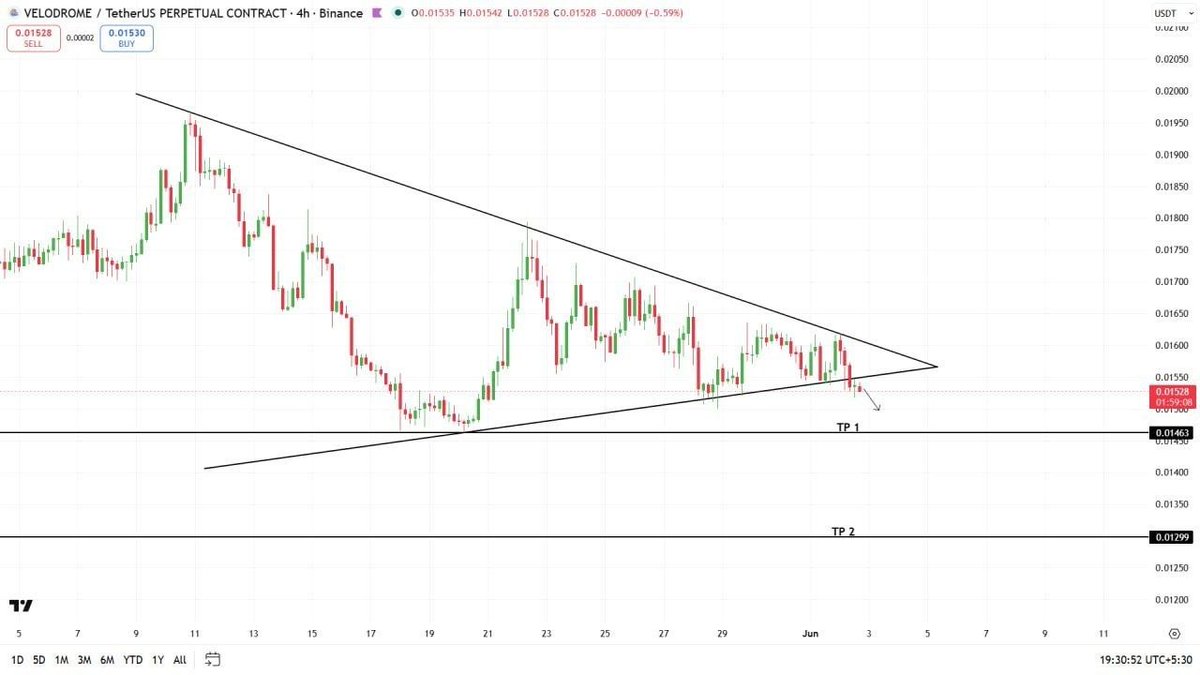
$VELODROME looks weak here.
The structure is fading, momentum is slowing, and buyers aren't showing much strength.
If this level fails to hold, lower targets could come into play quickly.
Bears are pressing. I'm watching for a breakdown that could send it significantly lower.
67
5
47
6,066
$PENGU just confirmed the breakdown.
The Inverse Cup & Handle played out exactly as bears wanted.
Key support has been lost, sellers are gaining control, and momentum is shifting to the downside. Lower targets are now firmly in focus.
The structure looks weak and every bounce could be an opportunity for bears to add more pressure.
If this breakdown holds, the next move could be fast and aggressive.
$PENGU looks ready for another leg down.
76
15
87
8,811
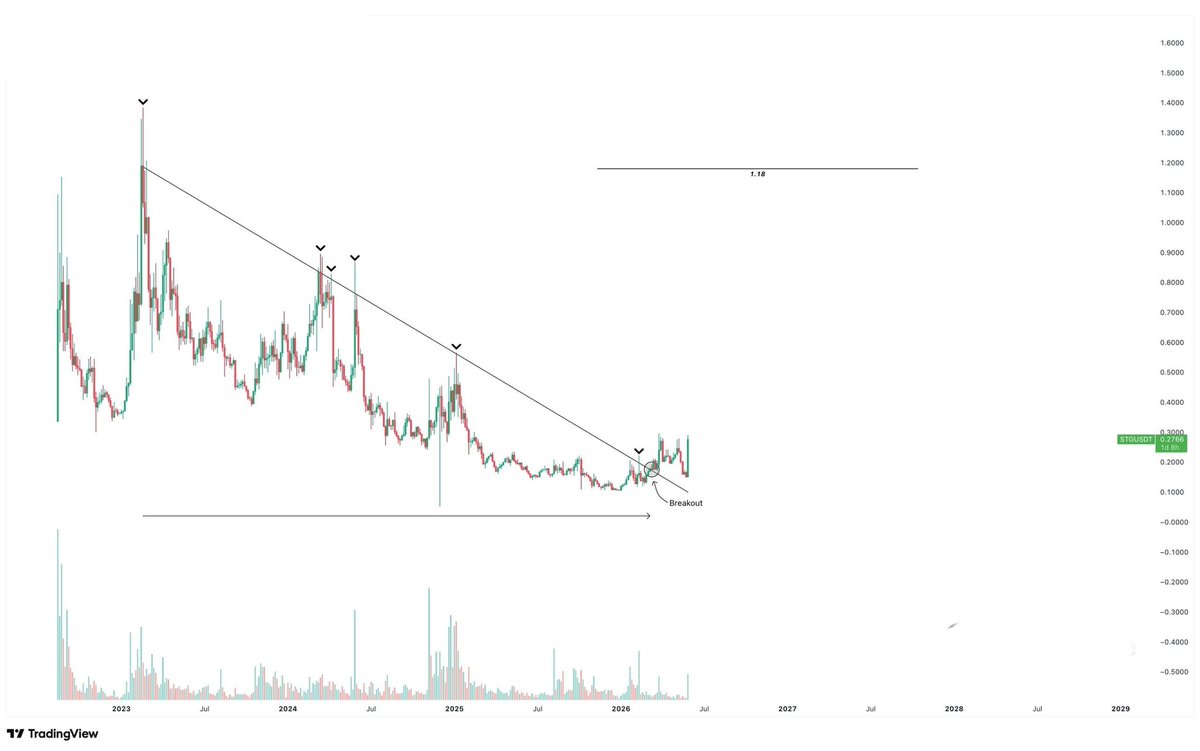
$STG is starting to look dangerous.
The long-term downtrend has finally been broken, and the breakout is holding strong. This is the kind of setup that can catch most people off guard before the real move begins.
Momentum is building.
Volume is waking up.
The chart is opening up toward much higher levels.
Most won't pay attention until it's already flying.
Big move loading...
77
16
59
7,451
May 31
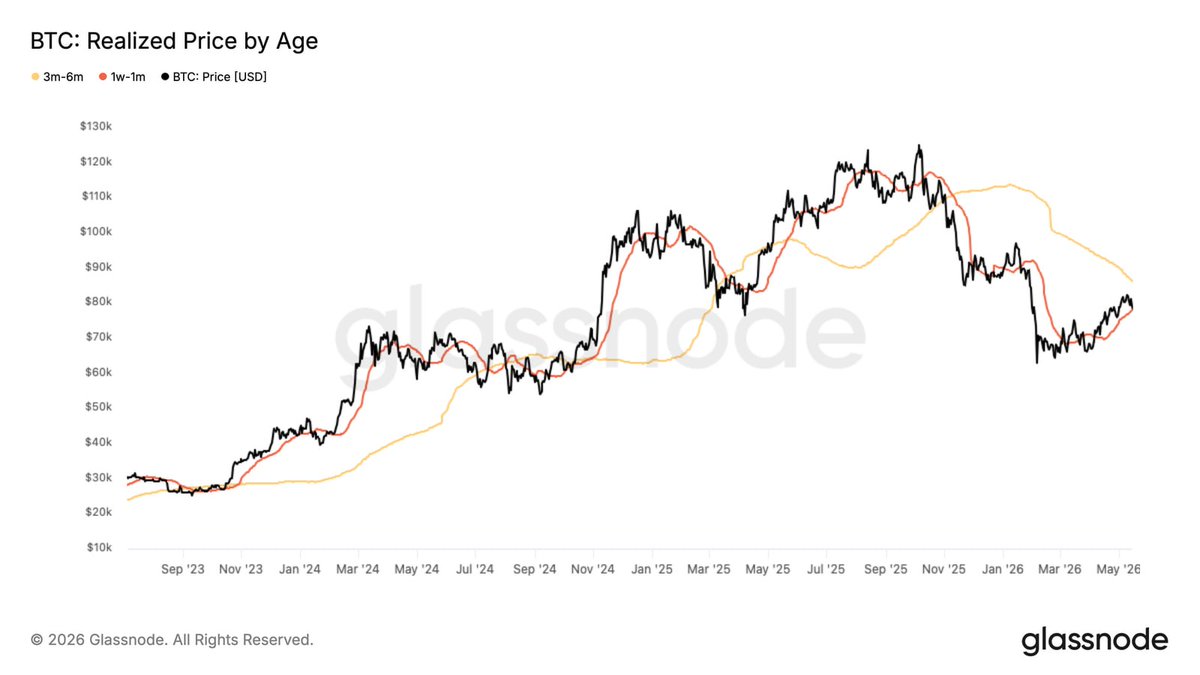
$BTC is approaching a decisive moment.
The 30D accumulation cohort has now moved underwater, with the $78.2K cost basis flipping from support into resistance. Any move back into this zone could face increased selling pressure from holders looking to exit at breakeven.
On the downside, the 1M–3M holder cost basis at $71.4K remains the strongest near-term support. This cohort is still holding profits, creating a strong incentive to defend the level.
As long as $71.4K holds, bulls still have a foundation to build from. A reclaim of $78.2K would be the first sign of strength returning.
All eyes remain on these levels as the next major move is likely to be decided here.
83
9
51
6,269
May 30
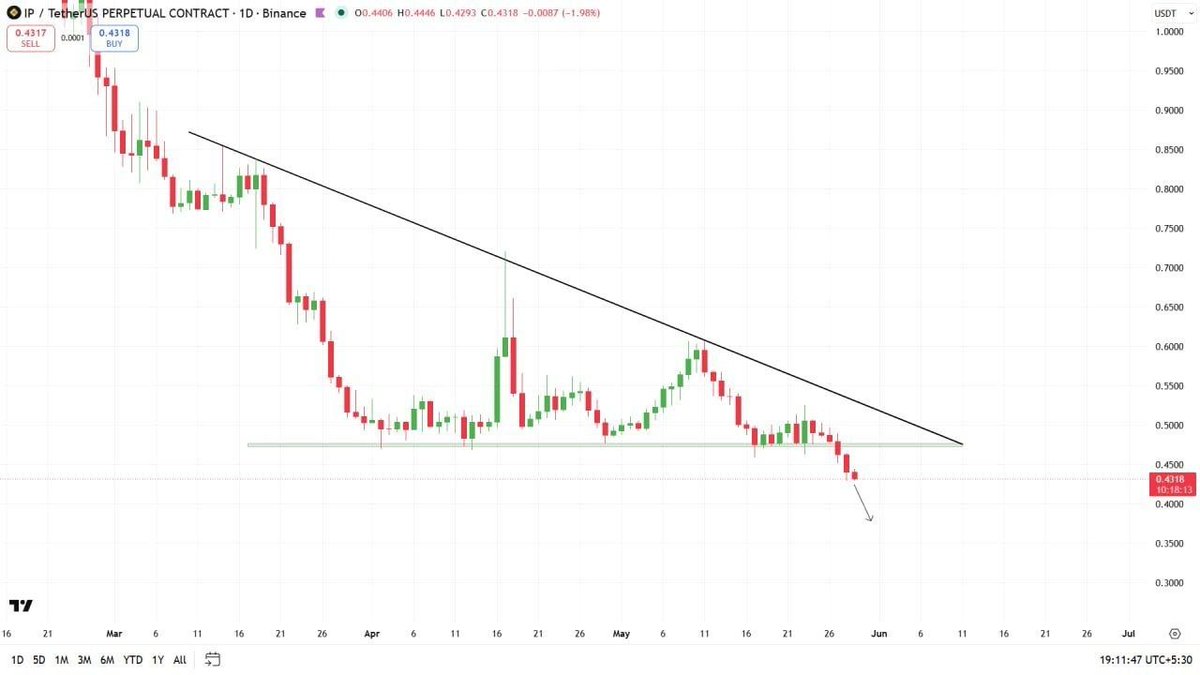
$IP is showing signs of weakness after the breakdown.
The key support level failed to hold, shifting momentum toward the bears. Price action continues to look heavy, with buyers struggling to reclaim control and every bounce facing selling pressure.
If this weakness persists, a deeper correction could follow as downside momentum starts to accelerate.
The structure has turned bearish, and further downside remains a strong possibility from here.
69
13
51
7,878
May 29
$BTC played out exactly as expected after breaking below the support trendline.
The breakdown triggered a sharp move lower, and the short setup delivered a solid 9% gain.
Price is now approaching an area where sellers could start taking profits, which may open the door for a relief bounce.
Momentum is still bearish, but markets rarely move in one direction forever.
A reversal pump from this zone wouldn't be a surprise. Keeping a close eye on how BTC reacts here.

May 28

$BTC is dumping exactly after breaking down the support trendline, just like expected.
Breakdown confirmed and bears took full control.
The move delivered a clean reaction straight from the support loss.
Short position already secured around 7% profit.
Now price is approaching an area where buyers could start stepping in.
Momentum is still weak, but this is where volatility usually increases fast.
A relief bounce or short-term pump from here wouldn’t be surprising, so keep a close eye on the reaction.
49
10
36
6,436
May 28
$BTC is dumping exactly after breaking down the support trendline, just like expected.
Breakdown confirmed and bears took full control.
The move delivered a clean reaction straight from the support loss.
Short position already secured around 7% profit.
Now price is approaching an area where buyers could start stepping in.
Momentum is still weak, but this is where volatility usually increases fast.
A relief bounce or short-term pump from here wouldn’t be surprising, so keep a close eye on the reaction.
92
10
67
12,254