Joined May 2019
- Tweets 30,055
- Following 114
- Followers 181,097
- Likes 28,268
5,849 Photos and videos


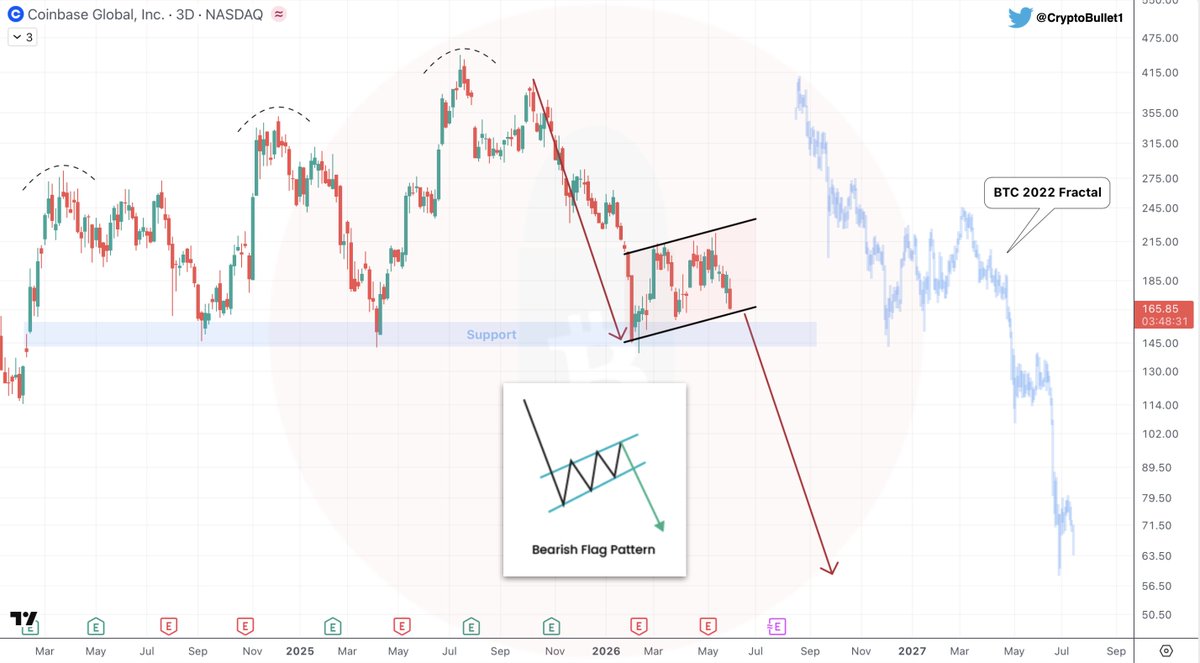
$BTC will go much lower
Enjoy this small Dead Cat Bounce while it lasts and prepare for more downside 📉
76
49
563
32,587

Apr 28
5
6
58
10,081
Jun 13
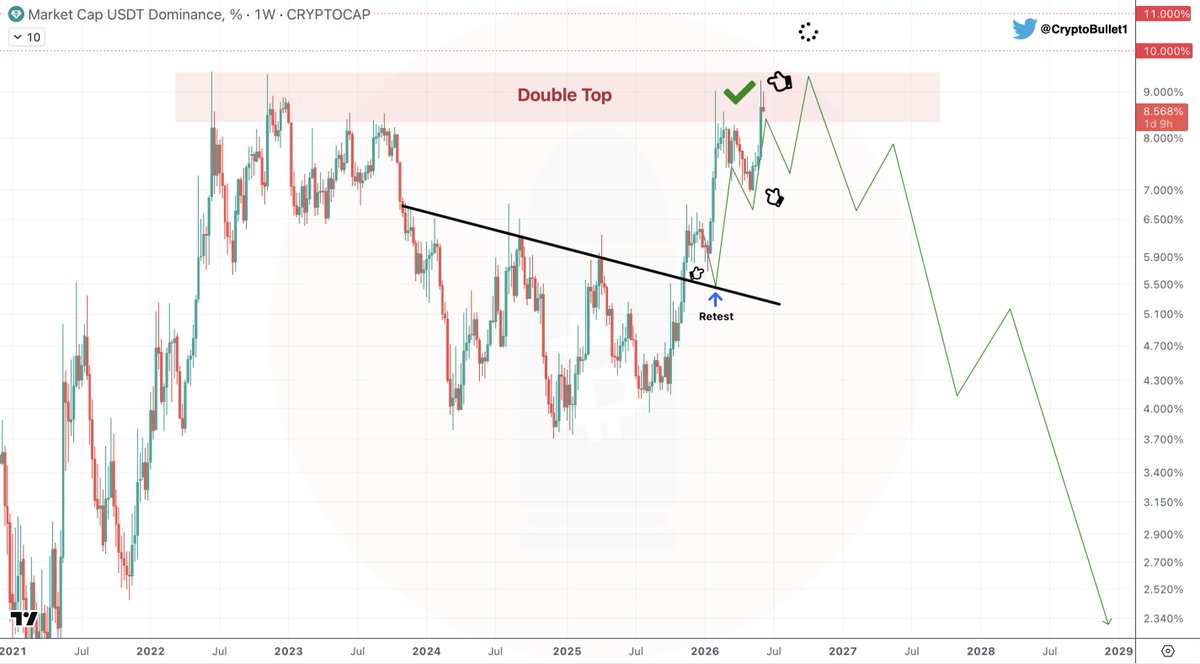
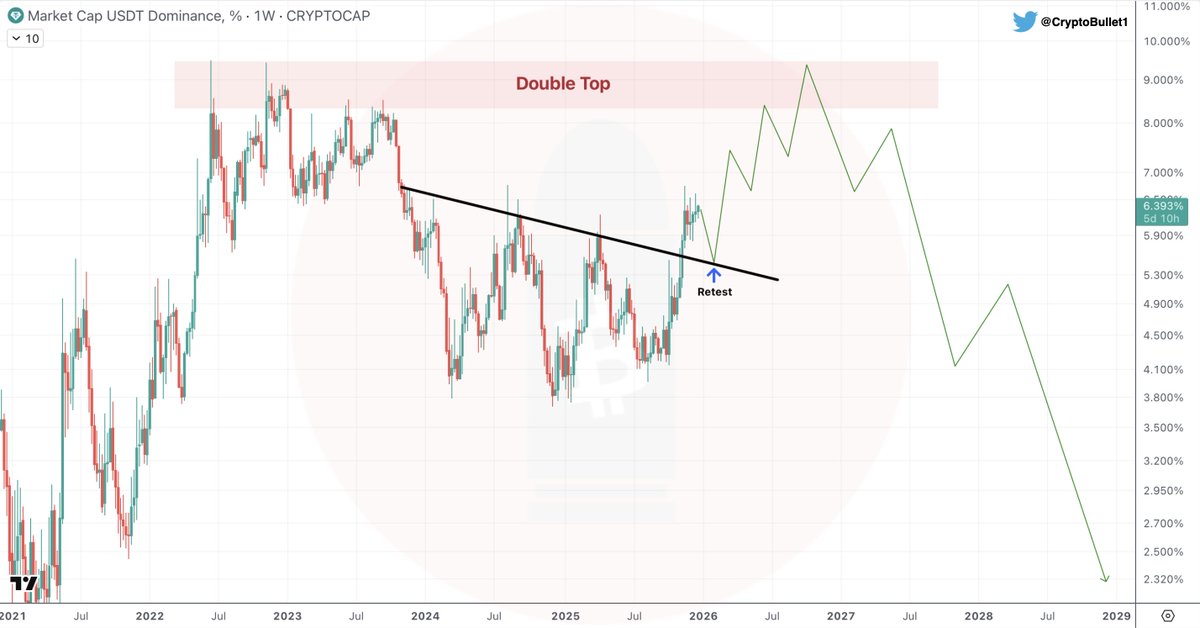
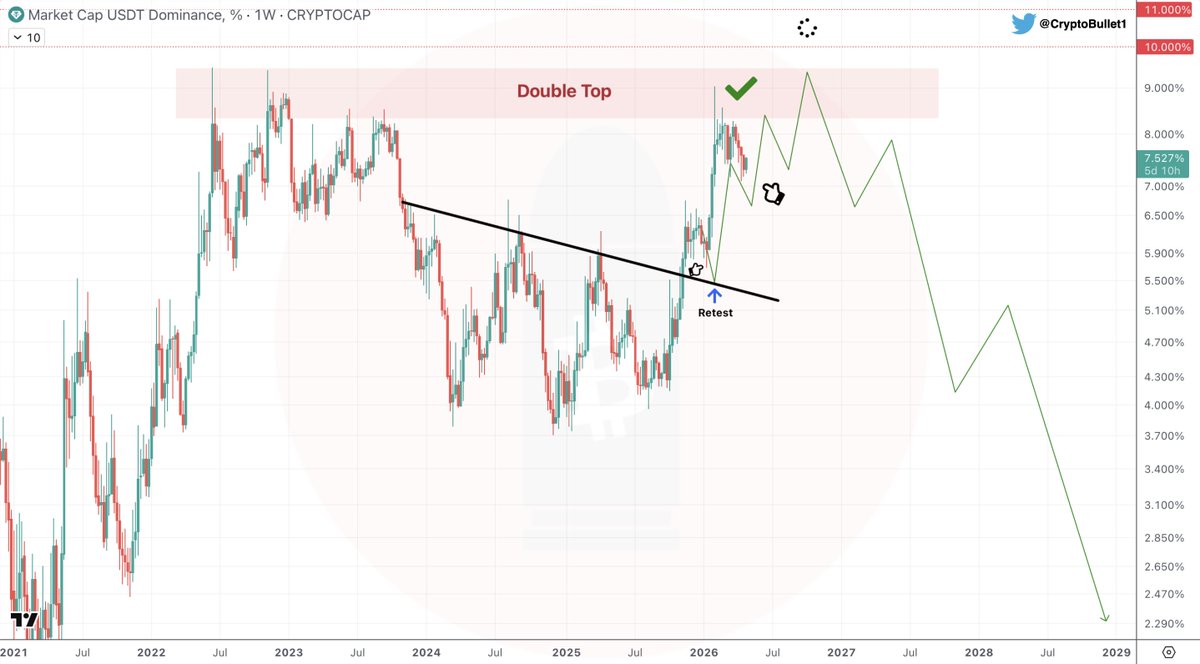
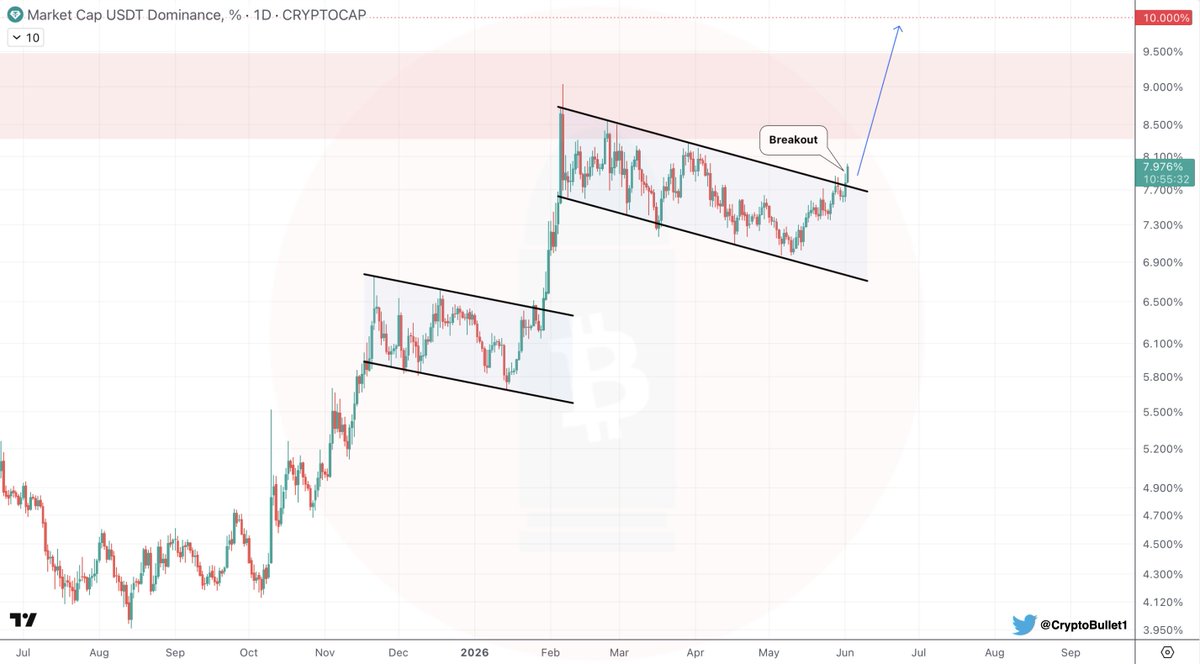
$USDT.D update
Broke the February high as expected. Should go even higher
10-11% Target remains
7
1
50
3,988
Jun 12
🇯🇵 Japan Interest Rate Decision & $BTC
👉 Bank of Japan is expected to raise rates again on June 16.
Here’s what happened after the previous rate hikes:
March 19, 2024 -> $BTC -23%
July 31, 2024 -> $BTC -26%
January 24, 2025 -> $BTC -28%
December 19, 2025 -> $BTC 14%
So, as you can see, it’s mostly bearish for $BTC
Now June 16, 2026 -> $BTC ???
I still think $BTC has a good chance of making new lows this month 📉 🤷♂️
13
23
323
21,717
Jun 10
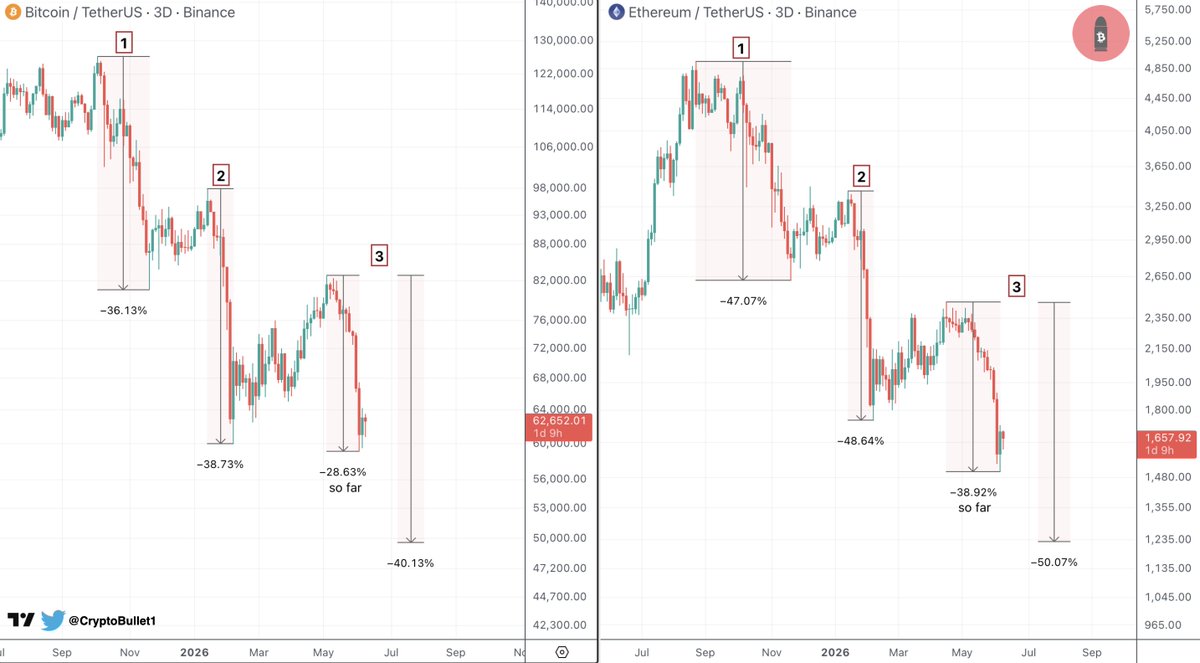
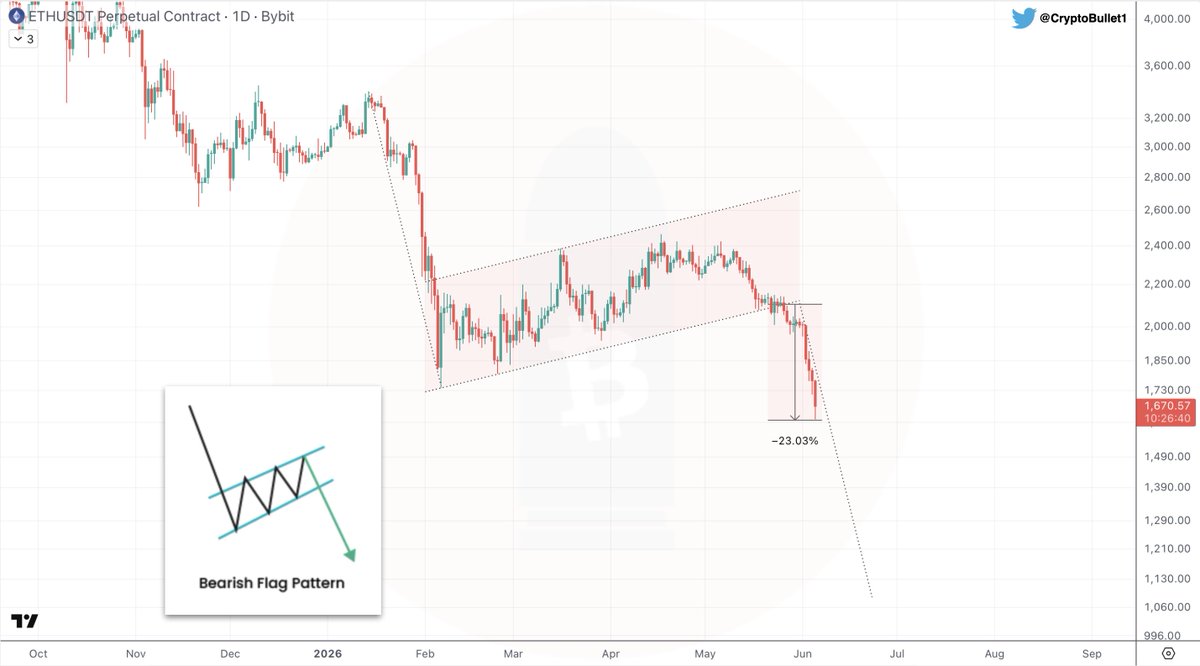
And what about $ETH ?
Well, $ETH tends to outperform $BTC to the downside, which isn't surprising since the $ETHBTC chart still looks bearish 🤷♂️
1st Leg Down on $BTC: -36%
1st Leg Down on $ETH: -46%
(10% difference)
2nd Leg Down on $BTC: -38%
2nd Leg Down on $ETH: -48%
(same 10% difference)
If the 3rd Leg Down on $BTC is gonna be -40% (explained yesterday), then the 3rd Leg Down on $ETH would be -50%? Which is approximately $1230 📍
Jun 9

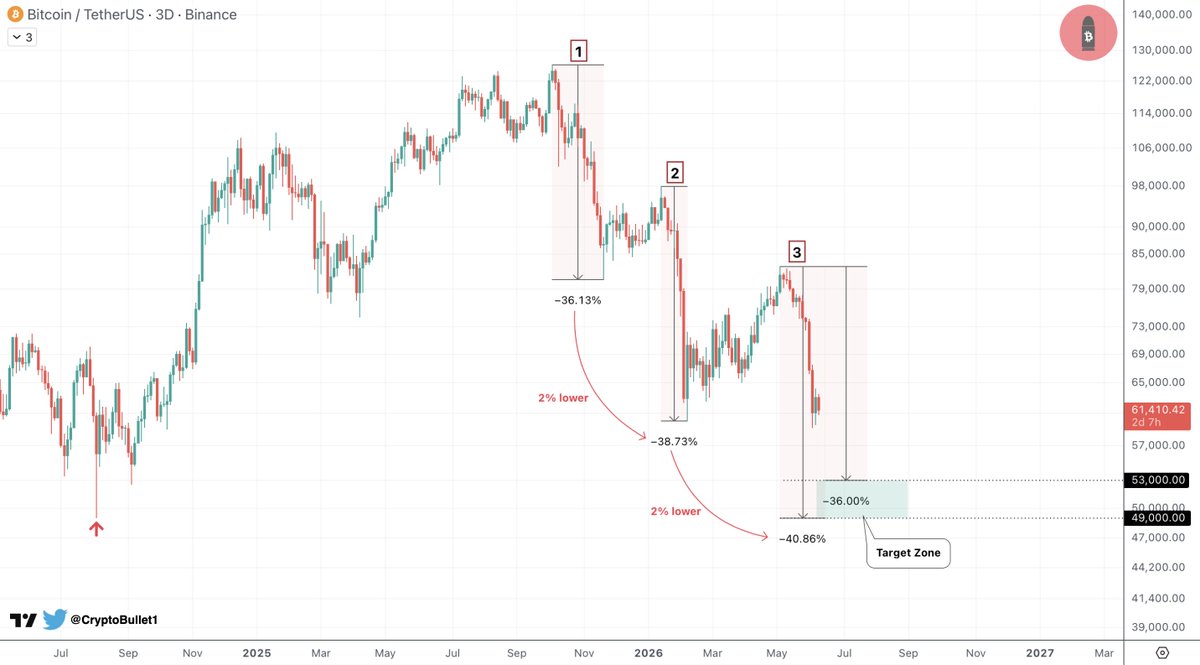
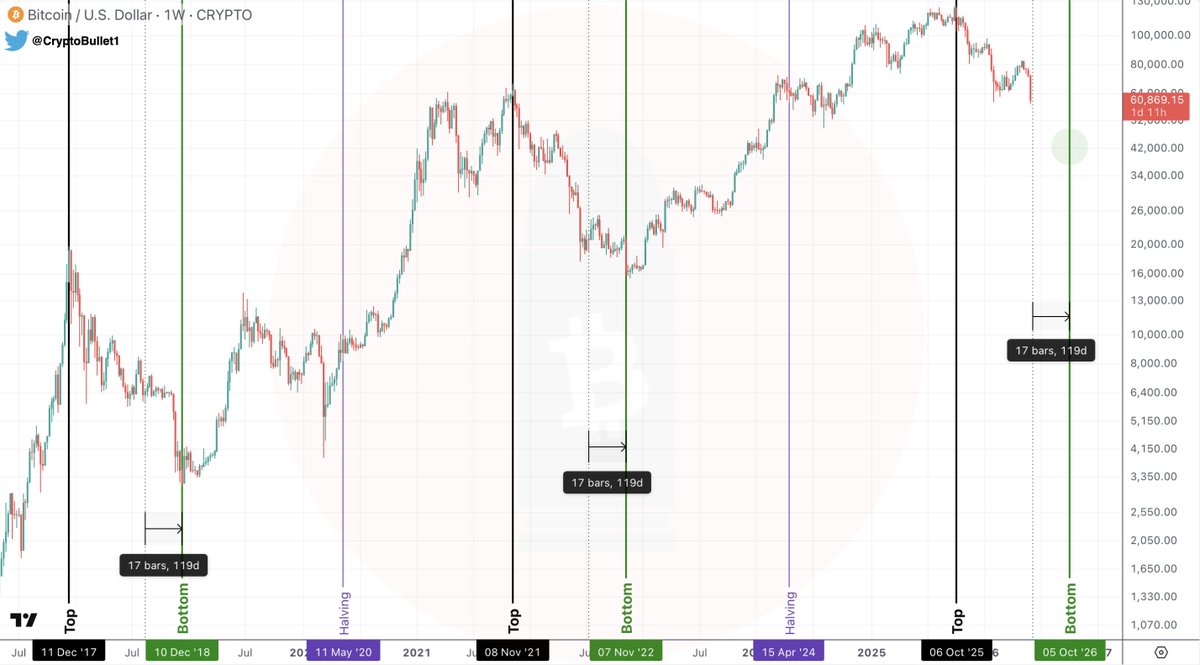
How low can $BTC go on this leg down?
My Target is $49-53k
That's where we could stop and consolidate for a month or two before the final capitulation 📉 🩸
1st Leg Down: -36% (October-November)
2nd Leg Down: -38% (January-February)
So the 3rd Leg Down (May-June) could be the same -36% (to match the first one) or it could be 2% deeper than the 2nd one, just as the 2nd Leg Down was 2% deeper than the 1st one. That would be -40%
39
53
345
36,817
Jun 9
How low can $BTC go on this leg down?
My Target is $49-53k
That's where we could stop and consolidate for a month or two before the final capitulation 📉 🩸
1st Leg Down: -36% (October-November)
2nd Leg Down: -38% (January-February)
So the 3rd Leg Down (May-June) could be the same -36% (to match the first one) or it could be 2% deeper than the 2nd one, just as the 2nd Leg Down was 2% deeper than the 1st one. That would be -40%
62
68
495
72,001
Jun 9
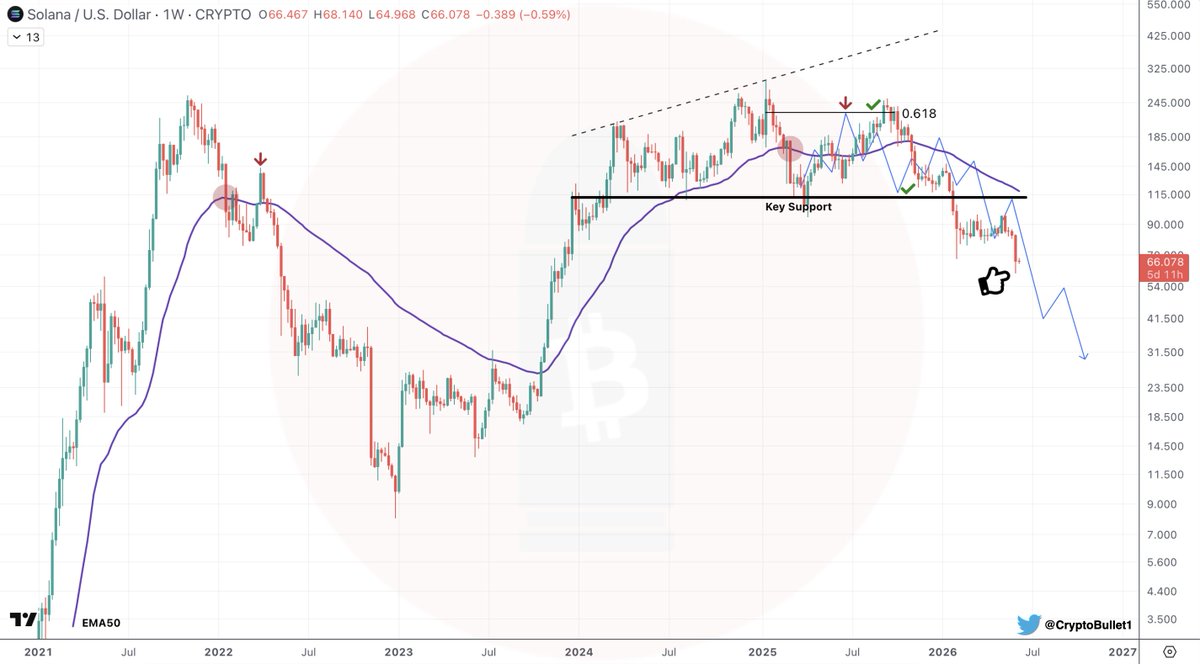
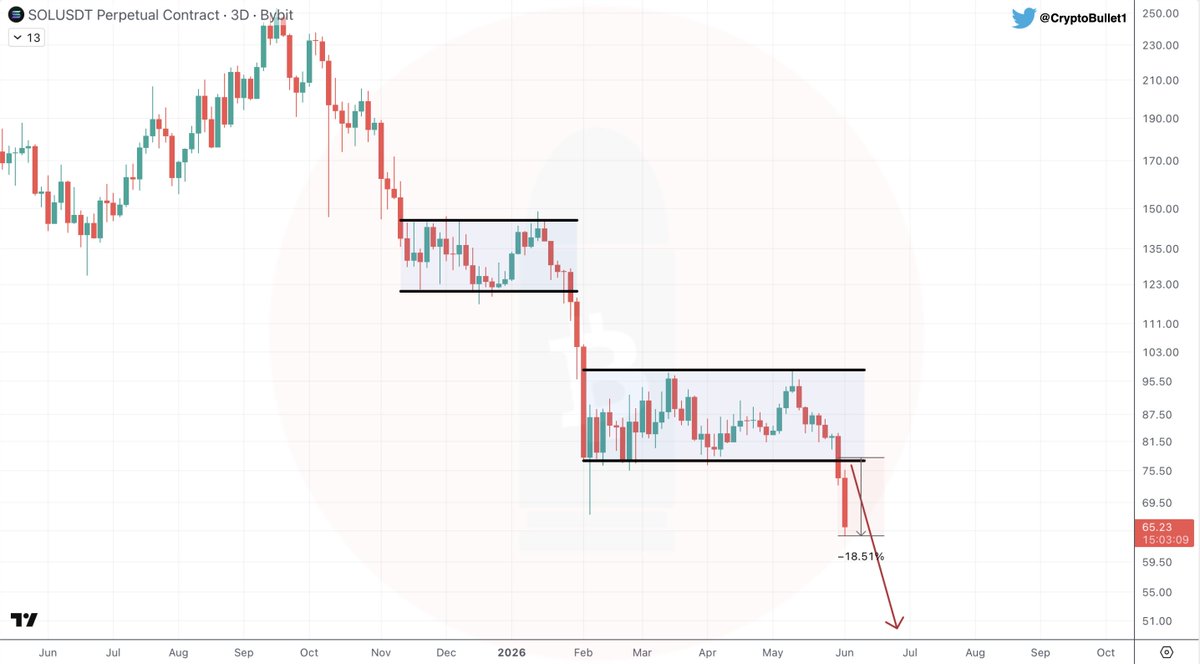
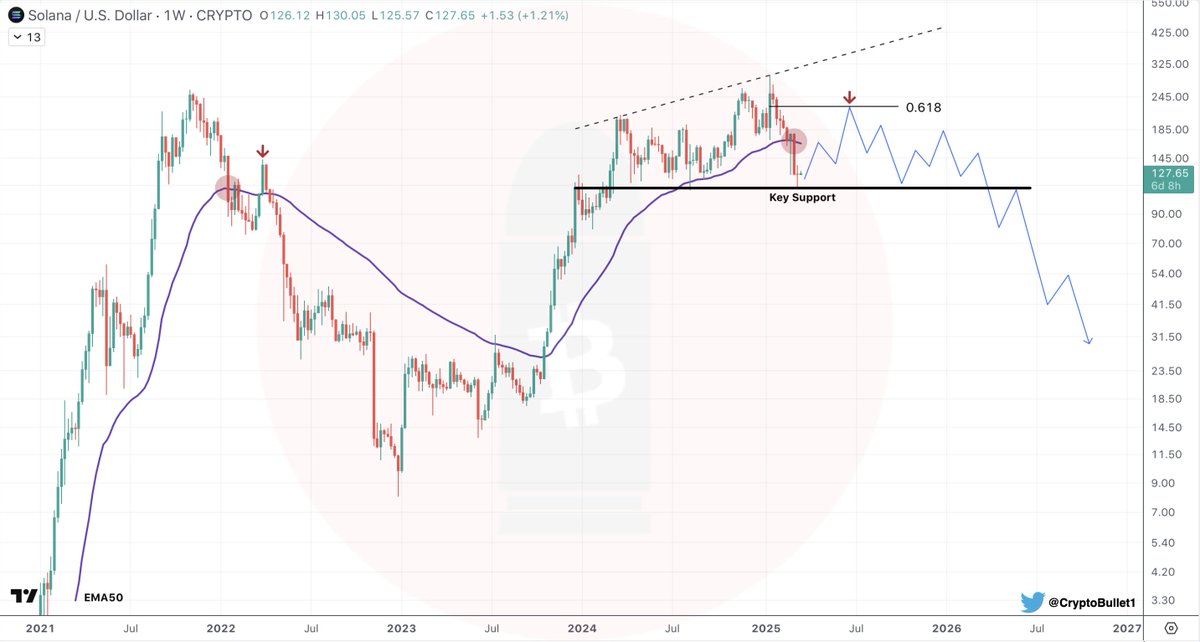
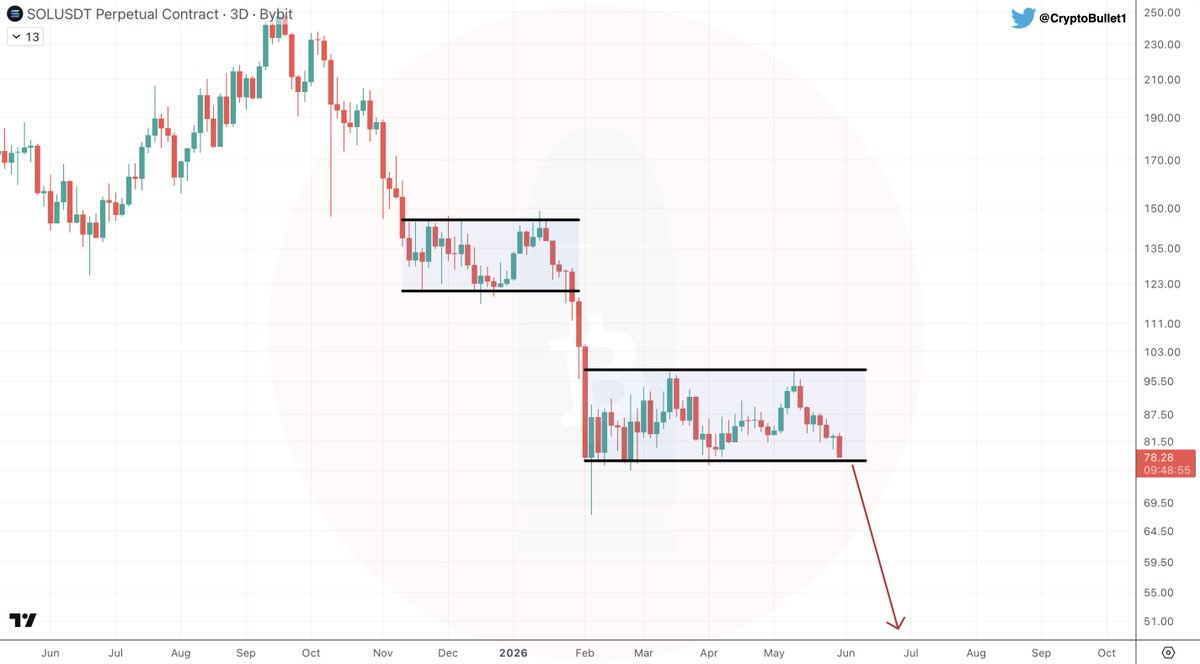
$SOL 1W update
Not bad, right? 😎
17 Mar 2025
Even though I think $SOL is cooked, I still expect a good bounce (Dead Cat Bounce) in the medium term 📈
Imo #SOL will spend several months above Key Support before the inevitable breakdown 📉
It will be one giant Distribution above the $110 level
47
27
336
42,453
Jun 8
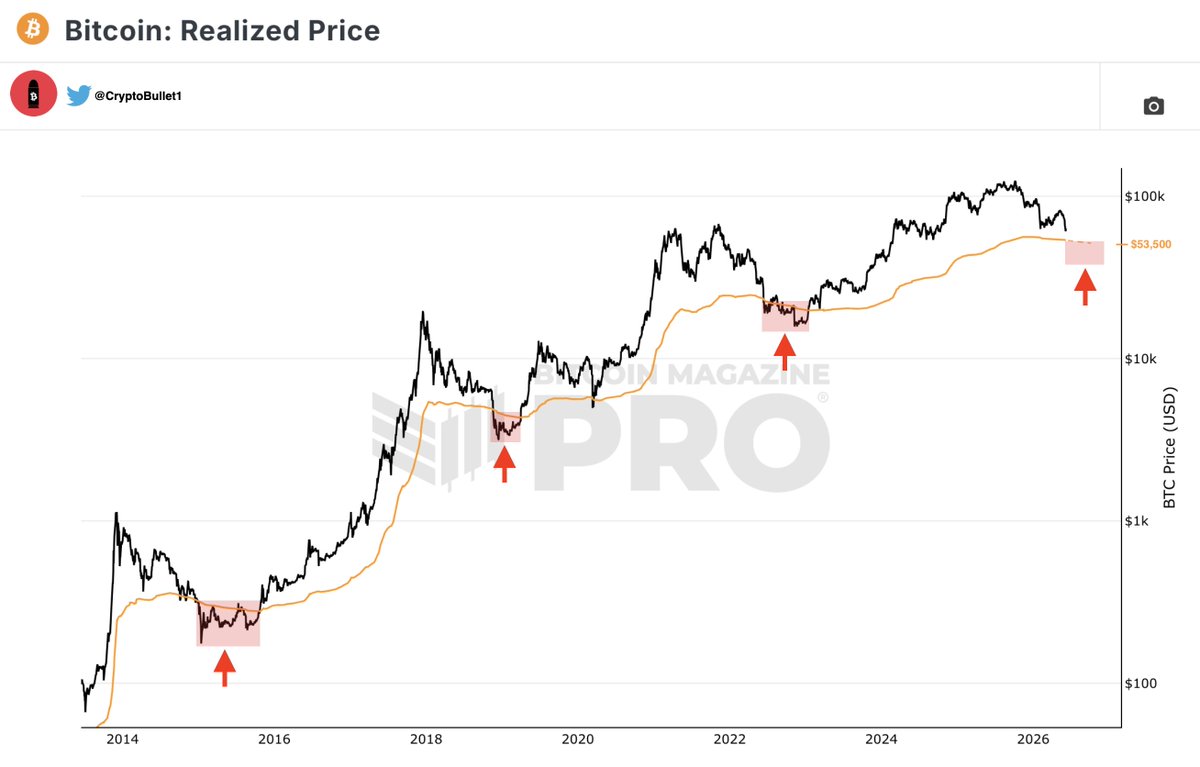
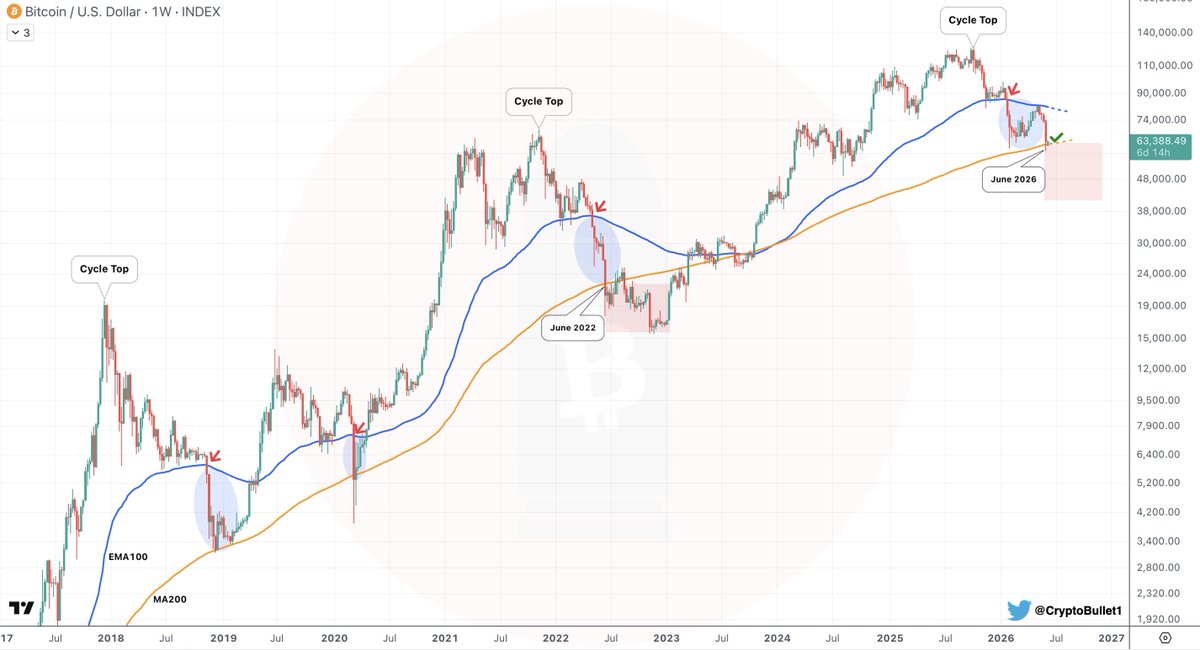
So $BTC finally hit the 200-Week MA
Even though it provides great Support, I believe we'll break it, just like we did in 2022 📉 🐻
Feb 2
#BTC has lost the 100-Week EMA
The 100-Week EMA provides ultimate support during the Dead Cat Bounce
Once that MA is lost, we head straight to the 200-Week MA 📉 🎯
(and I believe we’ll break below it eventually)

40
28
397
38,017
May 23
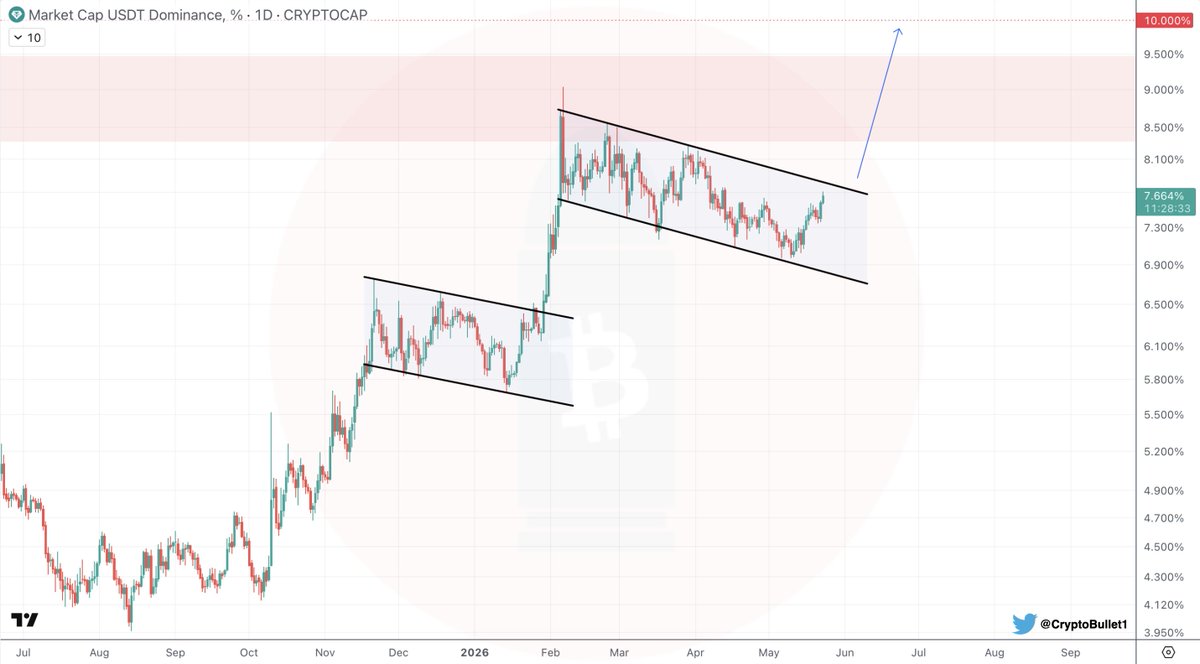
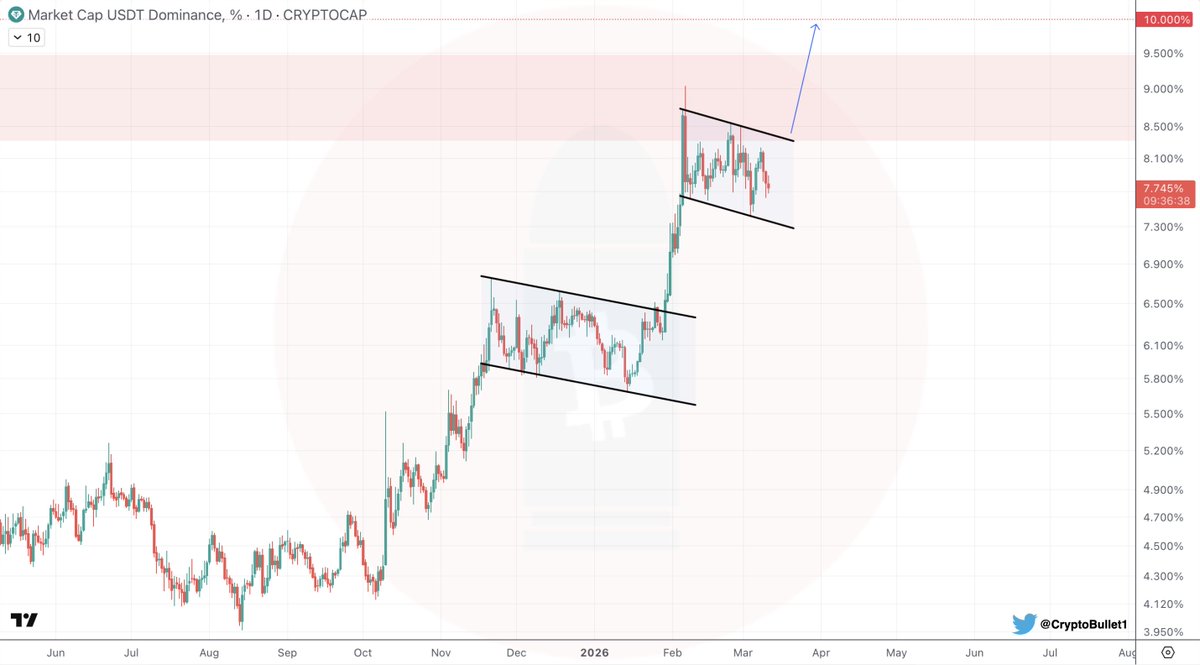
$USDT.D 1D update
The Bull Flag is still in place
I'm still expecting a breakout 📈
(bad for $BTC📉)
40
39
304
52,907
Jun 2
3
2
55
11,807
Jun 7
4
2
44
5,903

Jun 5
Feb 17
Some people think $60k was the bottom
No, it was not.
I can guarantee you that $BTC will go lower this year
21
7
247
36,192

Jun 4
22
18
284
28,648
Apr 17
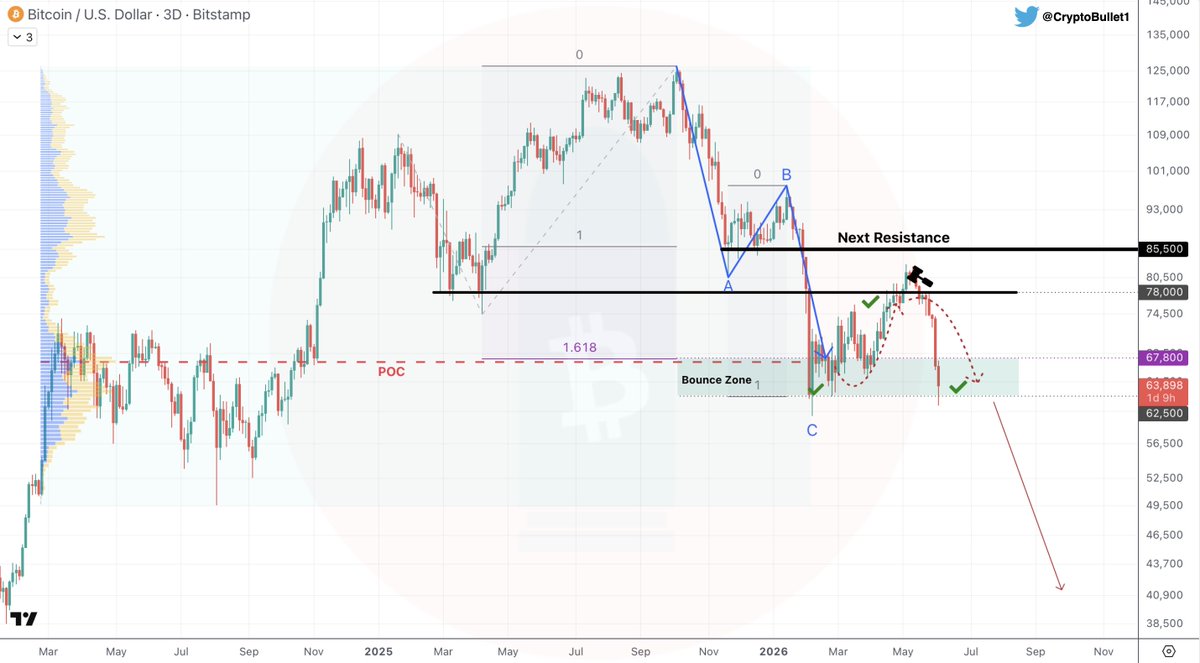
$BTC 3D update
So here we are - testing my $78k Major Resistance Level
I'm not surprised by this as I was the first one to mention this scenario back in early February 💁♂️
👉 $78k is a very serious Resistance Level, but if the bears are trapped in high lev shorts, we'll smash through the resistance to liquidate them (remember the $6k Resistance in 2019?)
From the TA perspective the next Horizontal Resistance is at $85-86k 📍
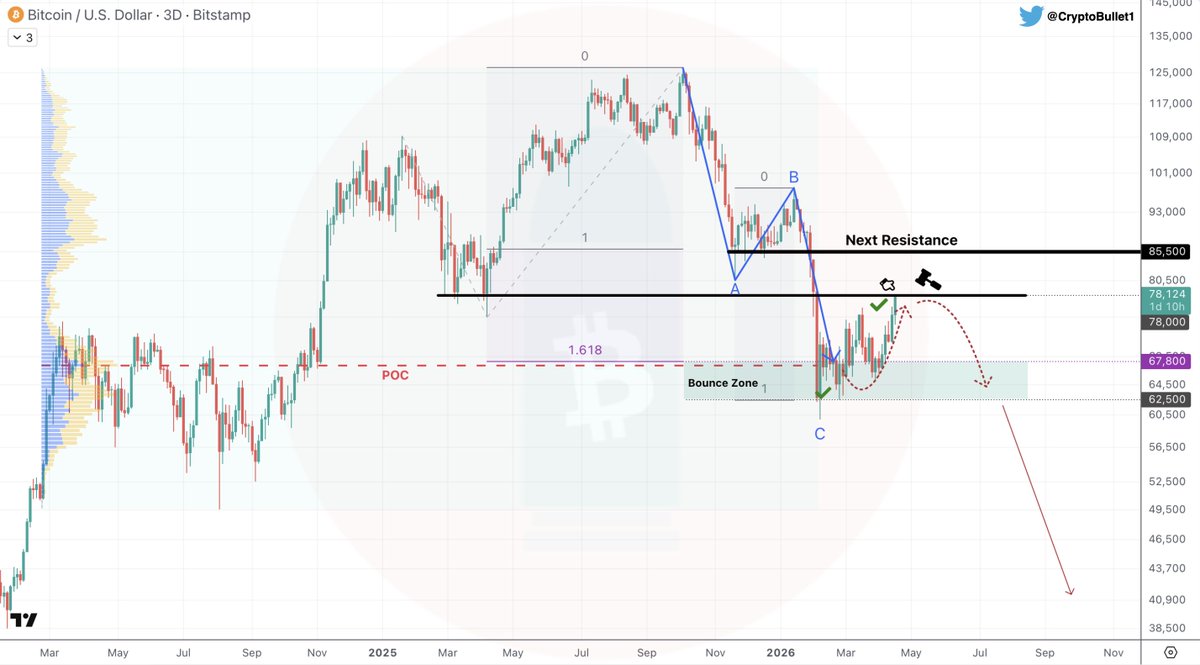
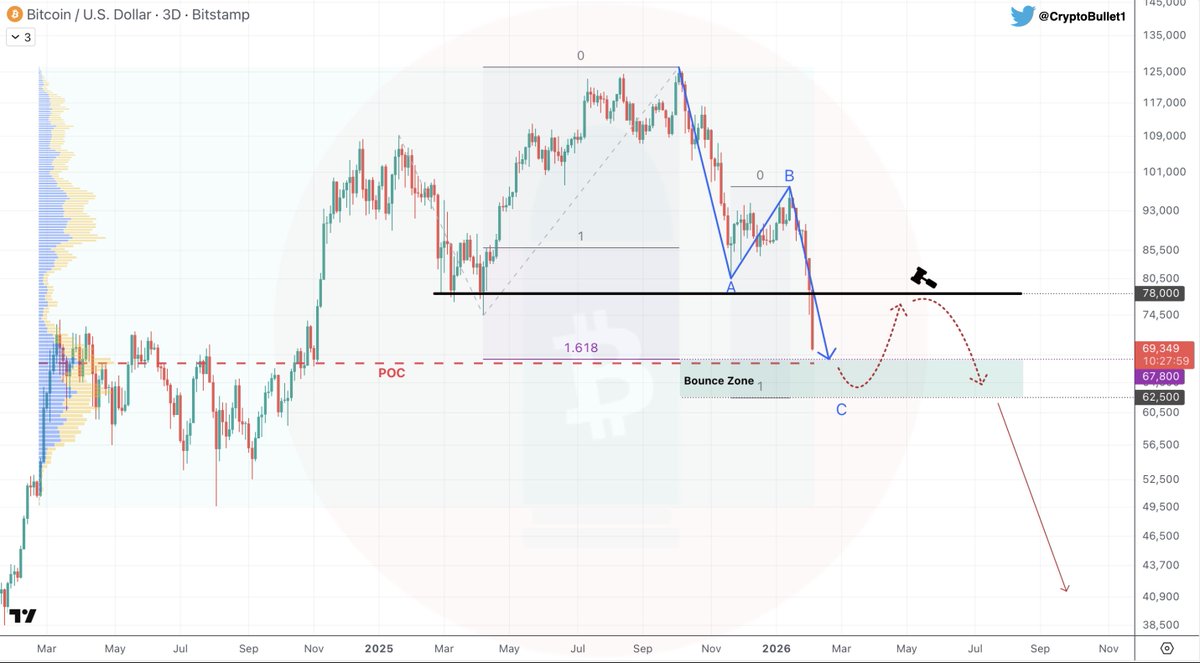
Feb 5
$BTC 3D chart
We’re approaching a strong Support Zone - $62,500-67,800 (1.618 Fib POC on VRVP A=C)
Once we dip into that zone I’ll be looking for a strong bounce 📈
IMO $Alts will show strength during that bounce
60
65
487
131,773

Jun 4
$BTC 3D update
And here we are - retesting my green Support Zone as expected 😎
Be patient, we're definitely gonna break it 📉📉
6
4
62
7,334
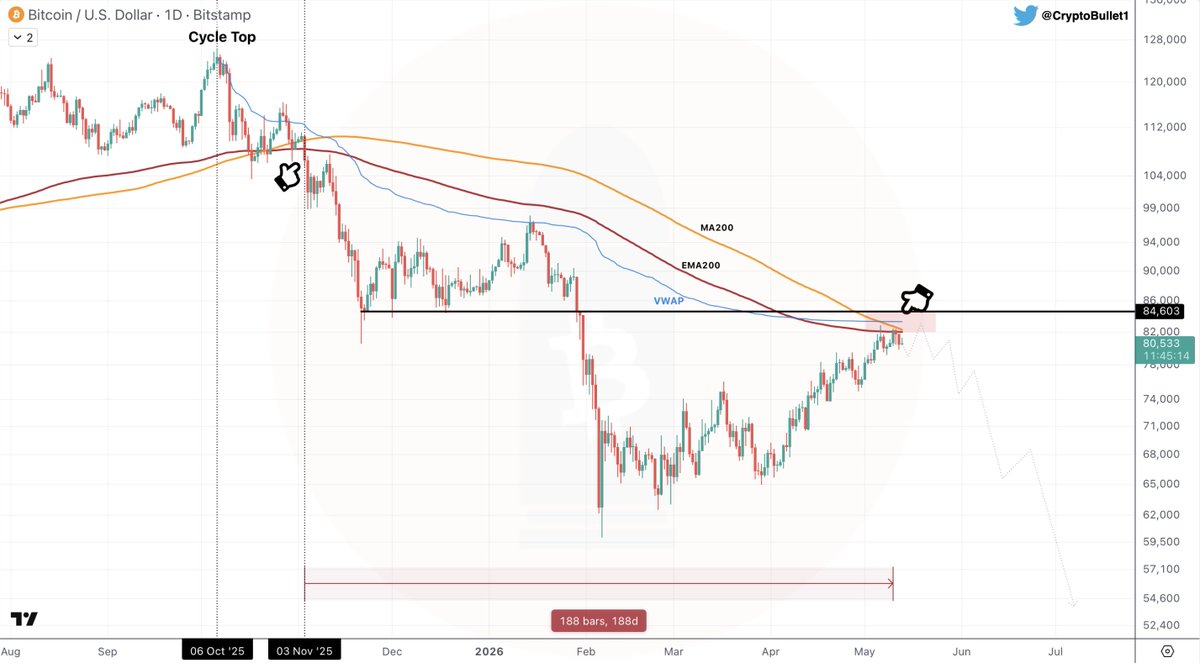
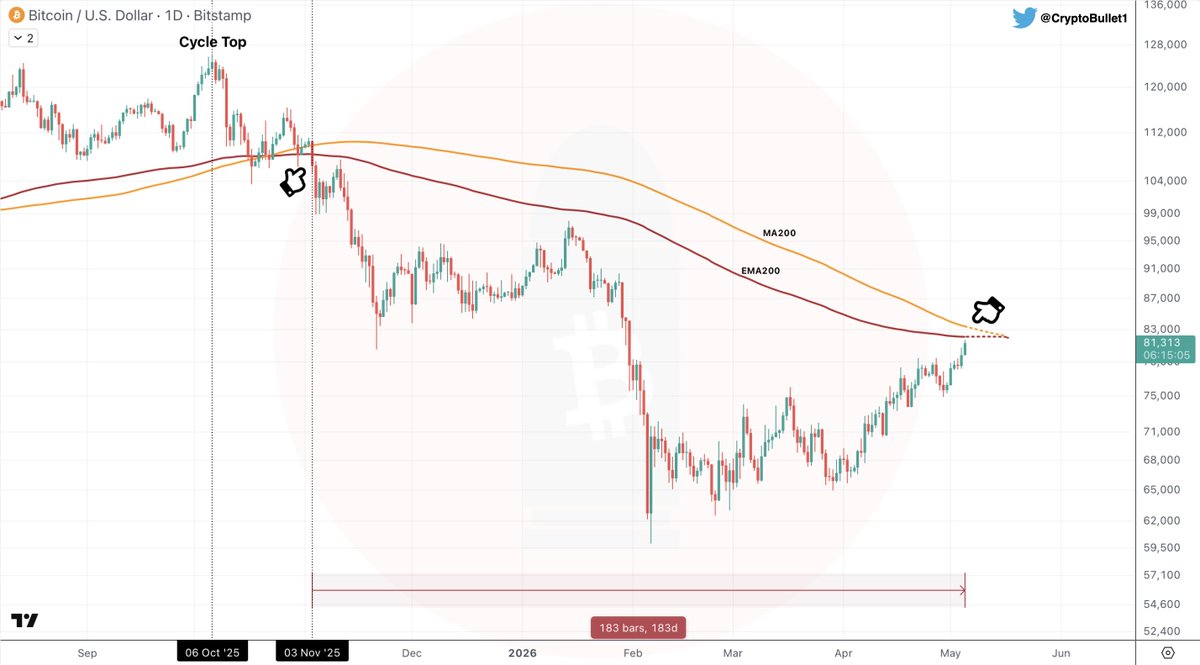
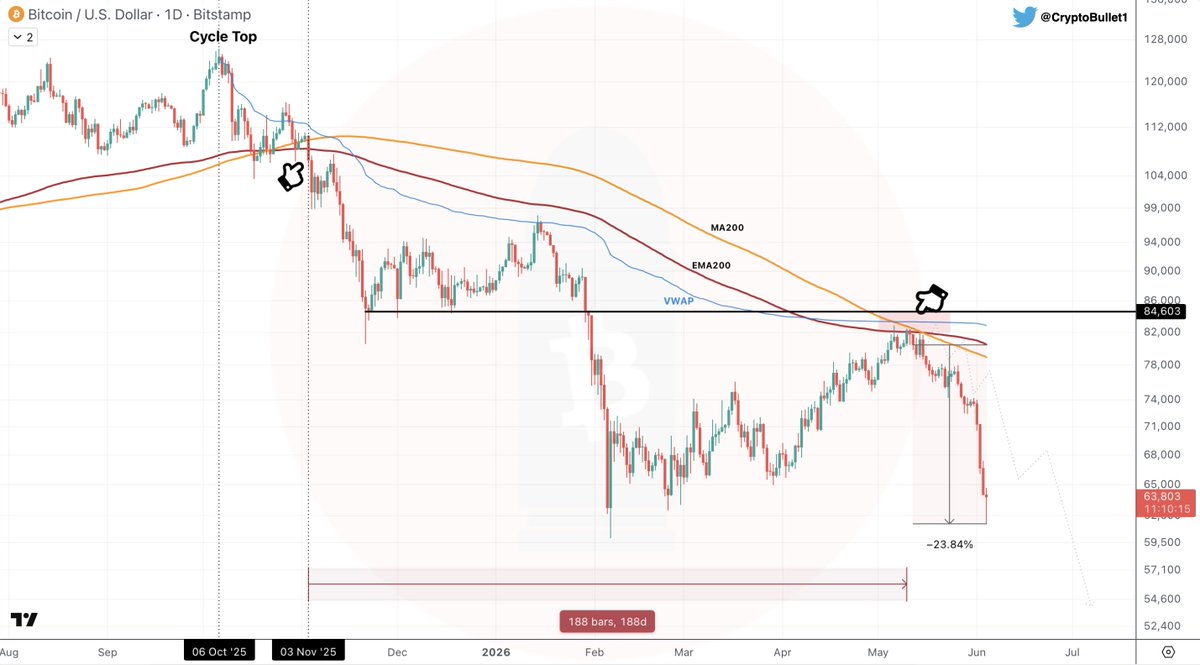
May 13
$BTC is facing Major Resistance here
👉 200DMA 200DEMA Strong Horizontal VWAP
We may spend the rest of the month (or more) between $78-85k giving $Alts time to breathe (pump) before bearish pressure returns.
$BTC is still in a bear market, don’t forget that 😉
45
38
375
69,260
Jun 4
$BTC moonboys are silent today for some reason 😏
May 13
$BTC is facing Major Resistance here
👉 200DMA 200DEMA Strong Horizontal VWAP
We may spend the rest of the month (or more) between $78-85k giving $Alts time to breathe (pump) before bearish pressure returns.
$BTC is still in a bear market, don’t forget that 😉
15
2
176
18,957