
📍Daily free updates | 🔮 Elliott Wave Mastermind | 📉 Deep Market Structure & Macro Flow | ⚡ Precision Waves. No Noise.
Joined March 2025
- Tweets 2,456
- Following 81
- Followers 1,751
- Likes 4,687
1,405 Photos and videos


Pinned Tweet

14 Jul 2025
Chart update for everyone following my setups:
I’m refining my color coding so you can clearly see what I’m doing and why:
🔵 Blue zones = Spot accumulation areas
🟣 Purple zones = Potential futures entry areas (not yet active)
🟥 Red zones = Start of my distribution (where I begin selling spot)
If you see a clearly marked Long/Short setup with SL & TP → future trade
No more guesswork. Full transparency.
👇 Like & Follow @CryptoWaveV
if you appreciate structure over noise.
#Crypto #TradingStrategy #SpotVsFutures #ChartClarity #TA #CryptoTwitter #CryptoWaveVision
4
24
26,503
Jun 13
$HYPE Update
$HYPE is unfortunately becoming increasingly difficult to interpret from a structural perspective.
The upside sequence I was tracking has now fully completed, and price has since developed a strong bearish impulse toward the $52 region.
At this stage, I see two scenarios:
• Scenario 1: Price produces a corrective recovery toward roughly $66 before another leg lower develops.
• Scenario 2: The entire move is part of a larger corrective structure, with downside potential extending into the $50–42 region, where I would begin looking for bullish reversal signals and evidence of accumulation.
The challenge is that neither scenario has provided enough confirmation yet to justify a high-conviction position.
This is also not the path I originally expected.
My preferred outcome was a longer period of consolidation near the highs followed by continuation to the upside.
Instead, the market has revealed considerably stronger selling pressure than anticipated, resulting in an aggressive downside impulse that forces a reassessment of the structure.
For now, patience remains the optimal approach.
May 25

$HYPE
$HYPE late long entry idea:
If possible, I’d open a separate position for new entries here. I would personally continue holding existing longs and avoid ruining the average entry on the core position.

2
2
716
Jun 13
$CRCL
$CRCL is currently on my watchlist for the coming weeks.
The ideal scenario would be a completed corrective structure followed by a clear trend reversal back into the previous range.
If that occurs, the next area of interest would be around $172.
Before considering a long position, I would like to see:
• Bullish divergences developing on the 4H timeframe
• A clear structural break to the upside
• Acceptance back into the prior trading range
• Momentum confirming the move
Without those signals, patience remains the preferred strategy.
The current structure suggests that the opportunity may develop, but confirmation is still required.
I will keep you updated if and when a valid long setup appears.
10
851
Jun 13
$SOL Update
$SOL reached my final downside target zone with remarkable precision at $60.19.
At the moment, I still believe the highest probability scenario is one more brief move lower, potentially marginally below the current low, before a larger trend reversal can develop.
There is always the possibility that the low is already in and price transitions directly into a sustained advance from here.
From a portfolio management perspective, that possibility should not create stress.
If your plan was to accumulate in the target zone, the work should already be done.
4
8
319
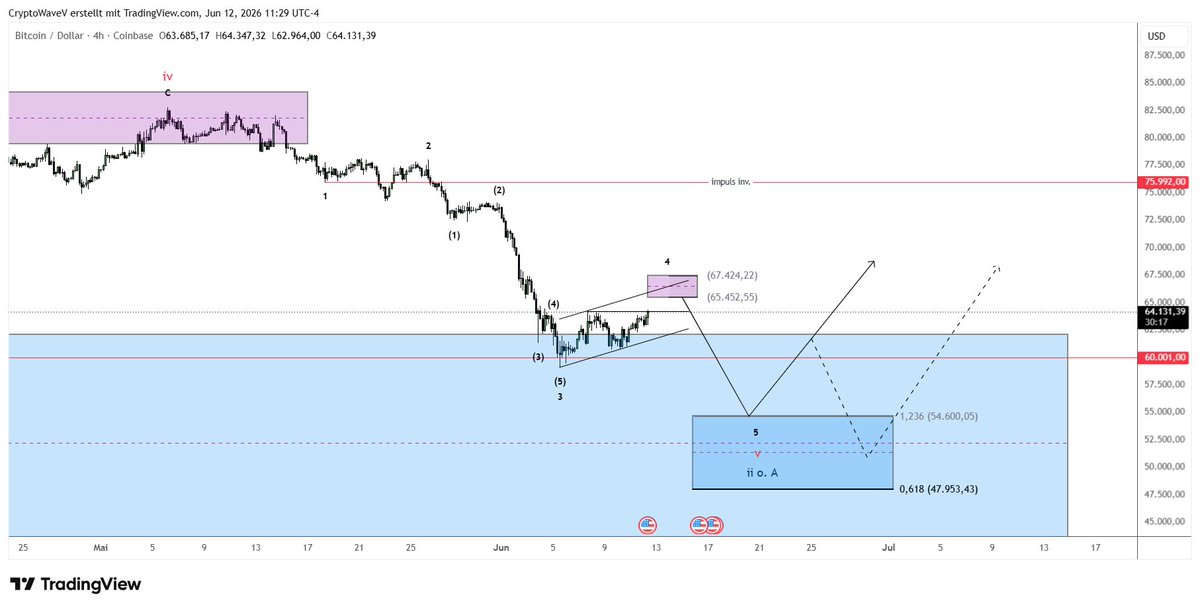
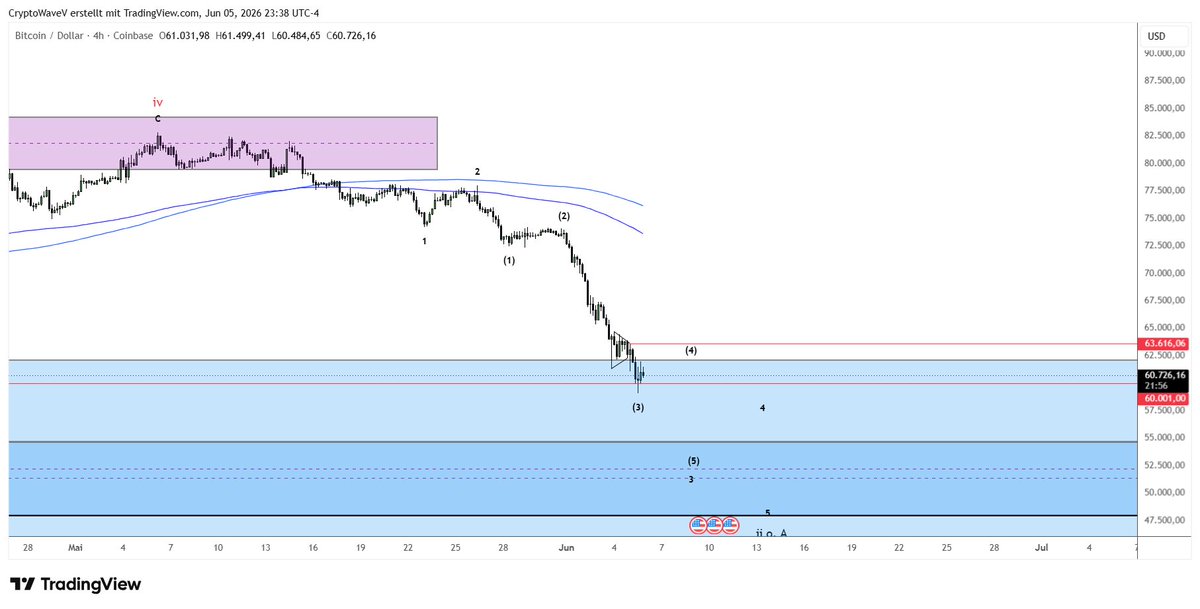
Jun 12
bitcoin:native
$BTC LTF
As I mentioned in last week’s post, it’s important not to become overly focused on every individual wave count during the final leg of a larger correction.
At this stage, I think it makes much more sense to focus on the broader target zone between $55k and $48k rather than obsessing over every short-term move.
On the lower timeframes, I still believe we are in the process of developing Wave 3. One reason Wave 3 is often easier to identify is that Wave (5) of Wave 3 tends to extend. In other words, there is usually one final aggressive move in the direction of the trend before that structure completes.
Since that extended Wave (5) is not clearly visible yet, my assumption remains that the structure is still developing.
As long as we don't see significant structural breaks on the lower timeframes, I have no reason to flip bullish prematurely. For now, I’m not paying much attention to weekend price action and will reassess things properly once the market opens up again on Monday.
1
8
432
Jun 10
GM from Koh Samui 🇹🇭☀️
The next lower low is where I’ll be deploying the remainder of my capital into Wave (5).
Sometimes the final Wave 5 never fully materializes, or it becomes extremely difficult to anticipate in real time.
If we break below $59,000, I’m hoping we finally get the move into the expected $55,000 region. My bids actually start around $57,900 already.
I don’t want to make the same mistake I made with HYPE and speculate on the perfect entry. This time I’d rather secure a 100% fill than miss the move while waiting for perfection.
$BTC LTF
As I mentioned in last week’s post, it’s important not to become overly focused on every individual wave count during the final leg of a larger correction.
At this stage, I think it makes much more sense to focus on the broader target zone between $55k and $48k rather than obsessing over every short-term move.
On the lower timeframes, I still believe we are in the process of developing Wave 3. One reason Wave 3 is often easier to identify is that Wave (5) of Wave 3 tends to extend. In other words, there is usually one final aggressive move in the direction of the trend before that structure completes.
Since that extended Wave (5) is not clearly visible yet, my assumption remains that the structure is still developing.
As long as we don't see significant structural breaks on the lower timeframes, I have no reason to flip bullish prematurely. For now, I’m not paying much attention to weekend price action and will reassess things properly once the market opens up again on Monday.
7
591
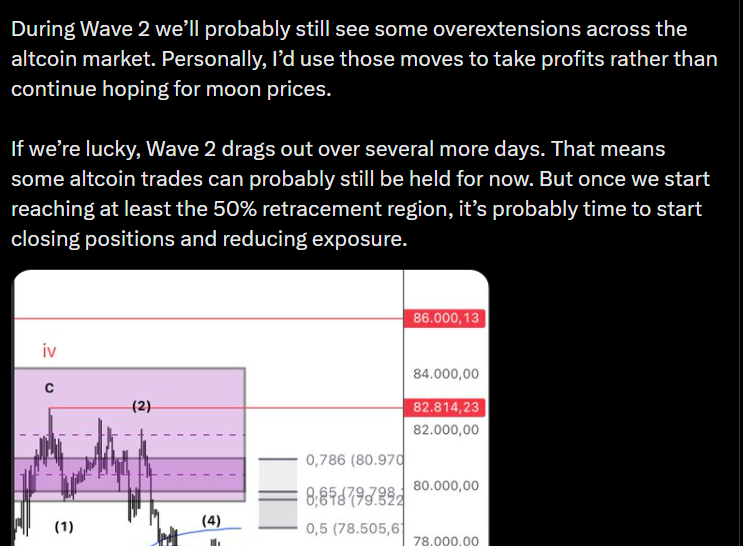
While I’m sitting here relaxing a bit, there’s one thing that’s worth mentioning.
If this correction is indeed approaching its final phase and ultimately marks the cycle low, then it’s important not to mess up the opportunity when it arrives.
I know a lot of people feel the urge to go all-in with high leverage at major bottoms to squeeze every last bit of return out of the move. The problem is that cycle lows are rarely clean. More often than not, you get plenty of volatility, stop hunts, liquidity grabs, and general market nonsense before the real trend reversal is obvious.
That’s why I personally wouldn’t be aggressive with leverage at these levels.
For people who tend to be emotional traders, I’d honestly suggest making these purchases through spot positions only. I know from experience that I’m far more willing to hold a spot position through volatility than a futures position.
For those who absolutely feel the need to use leverage, the approach I’ve used in the past is different. Instead of opening a highly leveraged position immediately, I would enter the bottoming process with a 1x futures position. In practice, that behaves very similarly to spot exposure but without introducing liquidation risk.
Then, once the bottom becomes clearer and the first bullish impulses start to appear, you can increase leverage later. For example, moving from 1x to 2x allows you to free up part of your capital while keeping the position open. That released capital can then be used to buy later pullbacks after the trend reversal has already started to confirm itself.
The key idea is simple: use leverage after the market starts proving you right, not before.
That way you scale exposure with increasing confirmation rather than maximum uncertainty. You stay involved, reduce liquidation risk, and still keep dry powder available for future opportunities.
I know I explained this concept before and I’m not sure if I can still find the original post. If there’s enough interest, I can make a more detailed breakdown after I get back from Thailand. But as a general framework, if you feel like you have to use leverage, I’d much rather see people increase leverage after confirmation than try to catch the exact bottom with maximum size.
1
8
608
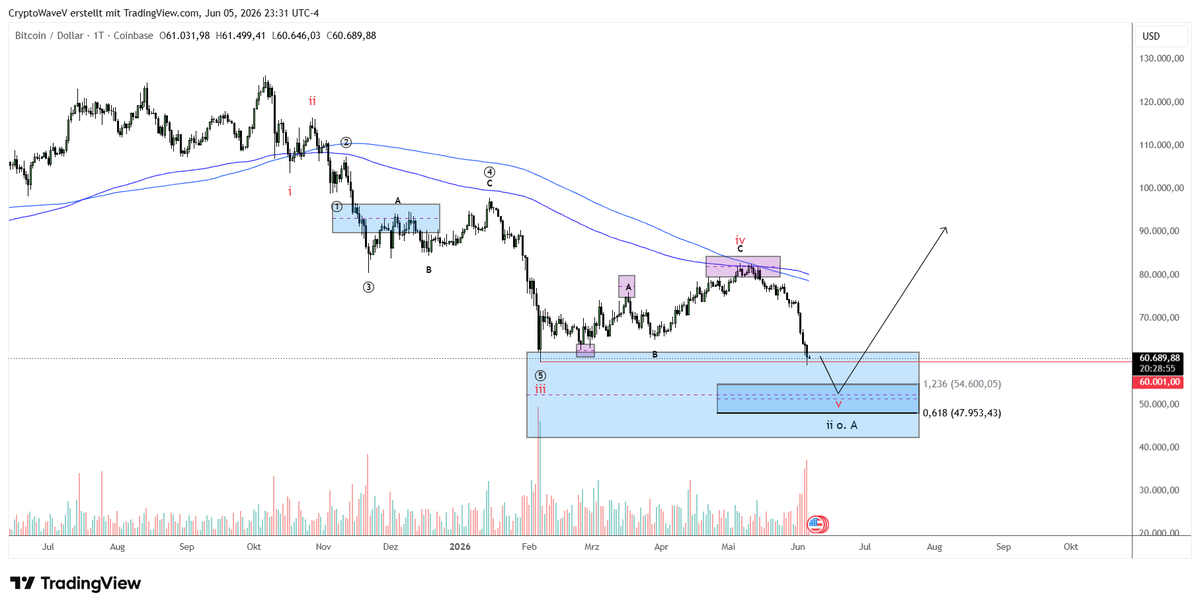
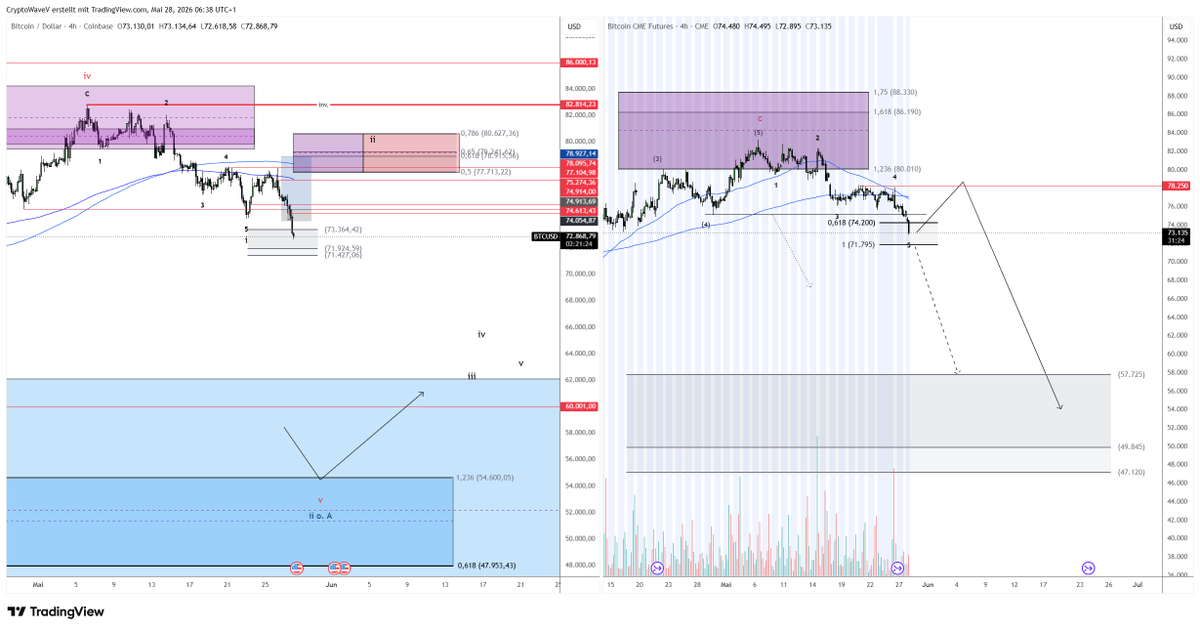
$BTC HTF
Bitcoin update:
Bitcoin should now be in the final leg lower of Wave 5 and complete the entire corrective move in the $54,600–48,000 region.
This remains the primary target zone where I expect the current downtrend to find its conclusion and where the probability of a meaningful bullish reaction becomes significantly higher.
2
3
22
2,082
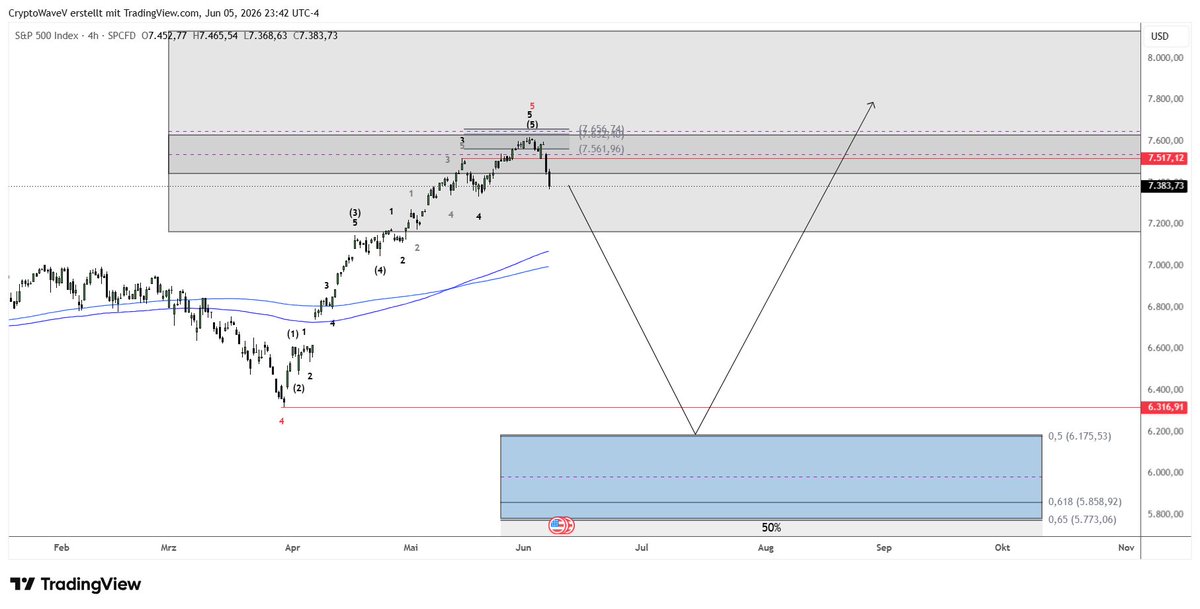
$SPX
The big elephant in the room remains the S&P 500.
Over the last several weeks, the S&P has held up remarkably well and hasn’t seen the kind of correction many were expecting. However, from my perspective, the structure has now largely completed itself and I still expect a larger pullback at some point.
Ideally, I’d like to see a flush toward the 6,000 region. Not because I’m bearish long term, but because it would remove one of the biggest remaining concerns — that the S&P could spoil the party later on.
If Bitcoin and the S&P 500 were to sell off together and find their bottoms around the same period, that would be an extremely strong signal for larger allocations. It would create a much cleaner environment to deploy capital again and position for the next major move higher.
And hopefully this time Bitcoin and the S&P can actually rally together afterwards instead of taking turns leading and lagging each other.
1
3
427
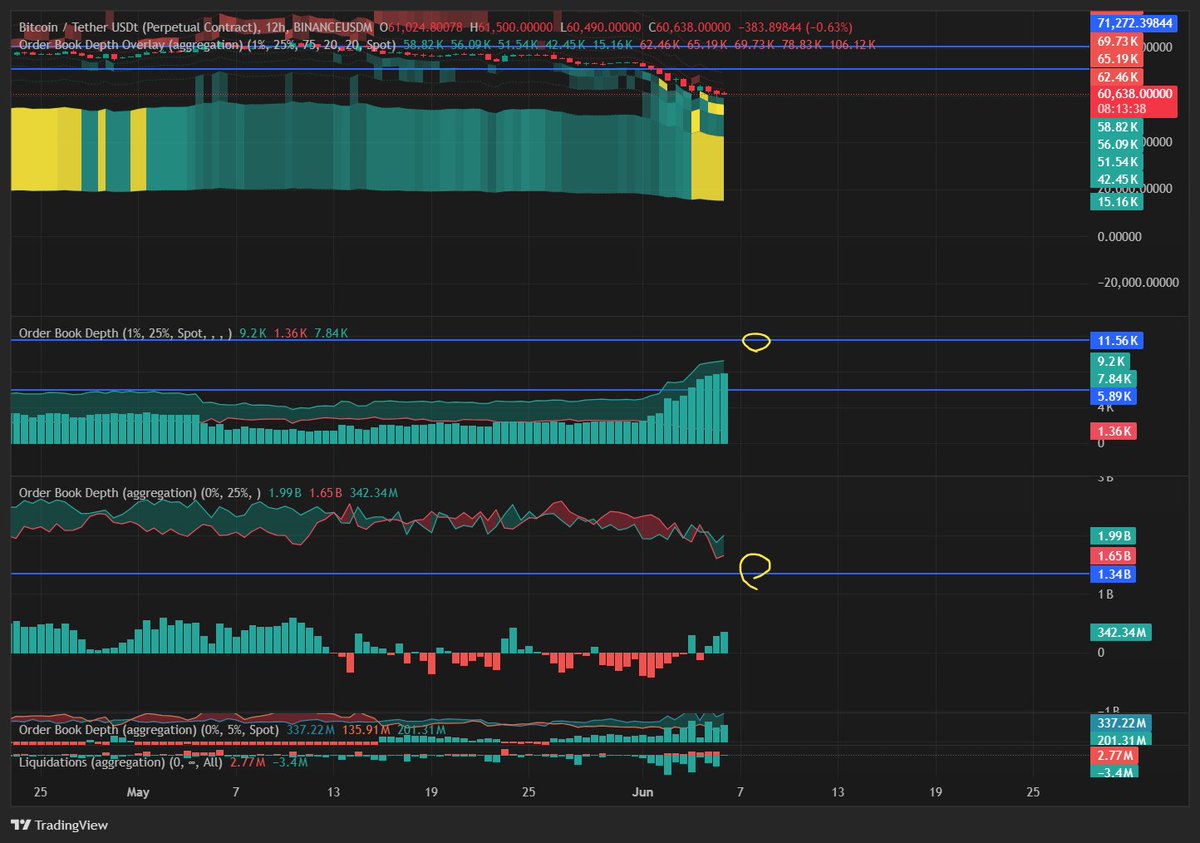
Another indicator I like to use when looking for a potential bottom is aggressive spot buy delta.
You can already see the order books starting to refill, but what I’m really watching is whether we get the same kind of spot buying pressure that appeared around previous cycle lows.
I’ve highlighted the delta readings from the historical cycle bottoms in yellow. If Bitcoin reaches the $55k–48k target zone and we see the buy delta expand to similar levels as it did in the past, that would be another very strong signal that a larger cycle bottom is likely being formed.
For now, it’s something worth monitoring closely, because strong spot demand is usually one of the clearest signs that real buyers are stepping back into the market.
3
261
GM ☀️
Putting together an update shortly.
Will probably turn it into a thread this time since I only brought my laptop with me. The charts get way too small in the multi-chart layout, so it’s hard to show everything properly.
5
194
Good evening from Thailand 🇹🇭
Not at the PC, but my Bitcoin target zone remains unchanged at $55k–48k.
Ideally, I’d also like to see a simultaneous sell-off in the U.S. stock market. If we get that kind of broad capitulation, I’ll be looking to deploy every remaining reserve.
Until then, enjoy some time away from the charts and stop watching the bloodbath 24/7 😄
May 28
$BTC
Bitcoin update:
The long position got stopped out. I still believe we eventually get a bullish reaction back above $78k, but the market is showing so much weakness right now that you almost have to expect direct continuation lower.
Like I already mentioned before, that was my final long position for this week. I’m off to Thailand for a month now
Hopefully when I come back, Bitcoin is trading below $55k.
1
7
660
May 28

3
698
May 28
solana:rndrizKT3MK1iimdxRdWabcF7Zg7AR5T4nud4EkHBof
Moved it to break-even now. Do or die. I’m honestly getting tired of this constant pump-and-dump market.
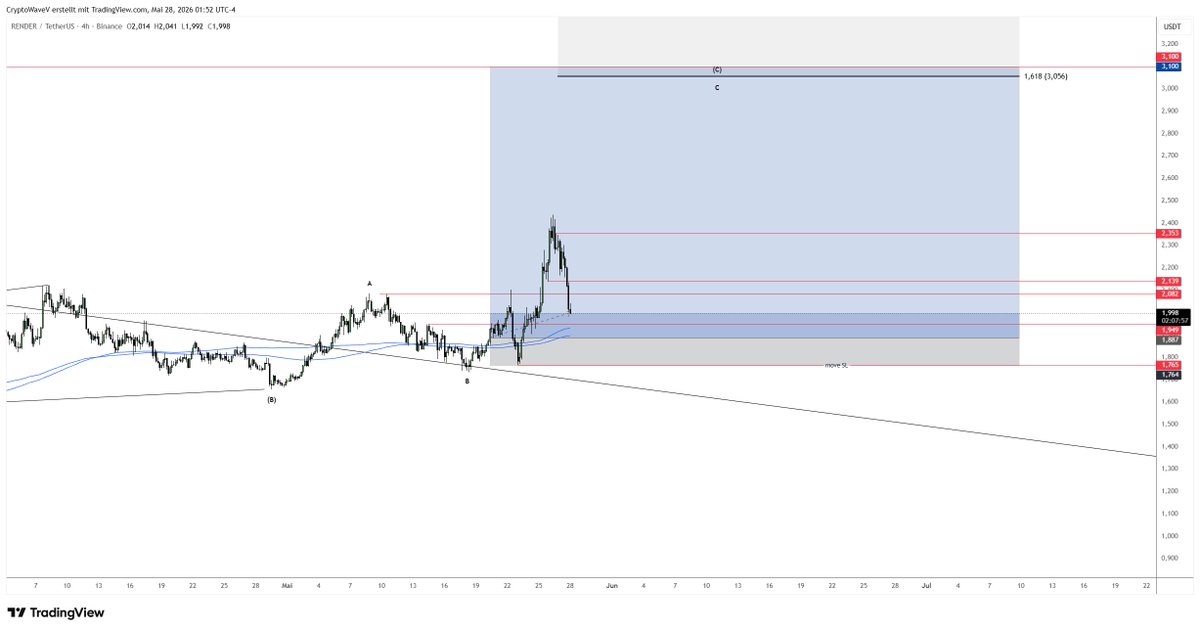
May 20
$RENDER
Current watchlist focus: $RNDR.
Render is not only trying to reclaim the 4H trend right above price, but it’s also sitting directly below the daily 200 EMA trend level. I could definitely see a bullish breakout toward the $3 region if we manage to break above the $2 level.
The structure itself unfortunately isn’t particularly clean, but right now I’m mainly paying attention to the strength of the trend. Could be one of the few names setting up for a real breakout here.

2
632
May 28
$BTC
Bitcoin update:
The long position got stopped out. I still believe we eventually get a bullish reaction back above $78k, but the market is showing so much weakness right now that you almost have to expect direct continuation lower.
Like I already mentioned before, that was my final long position for this week. I’m off to Thailand for a month now
Hopefully when I come back, Bitcoin is trading below $55k.
1
1
20
1,695
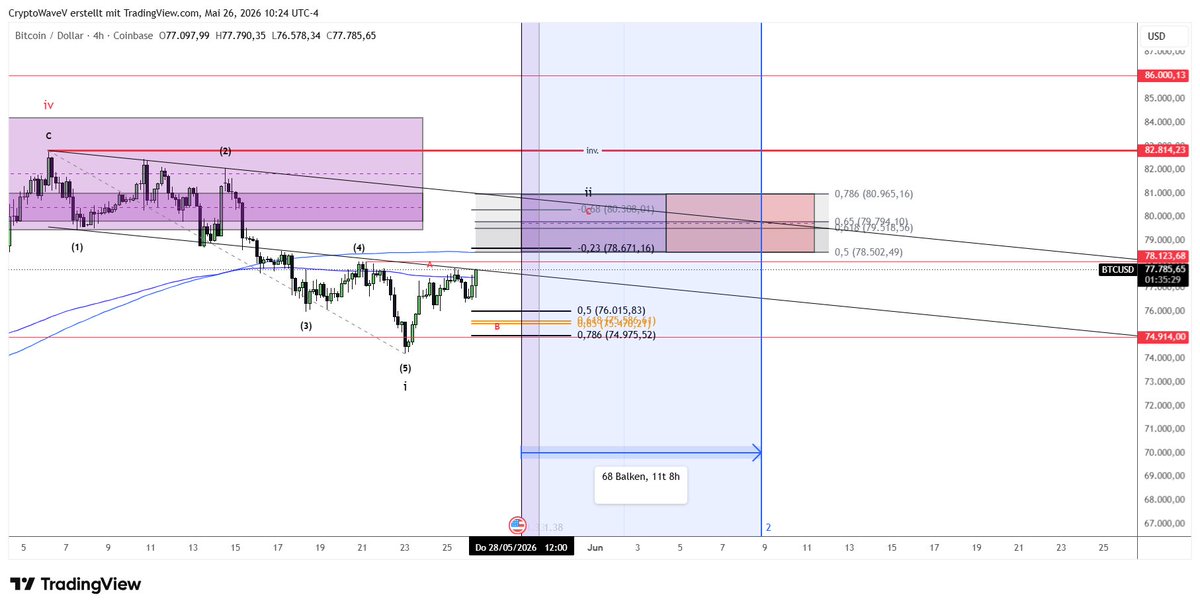
May 26
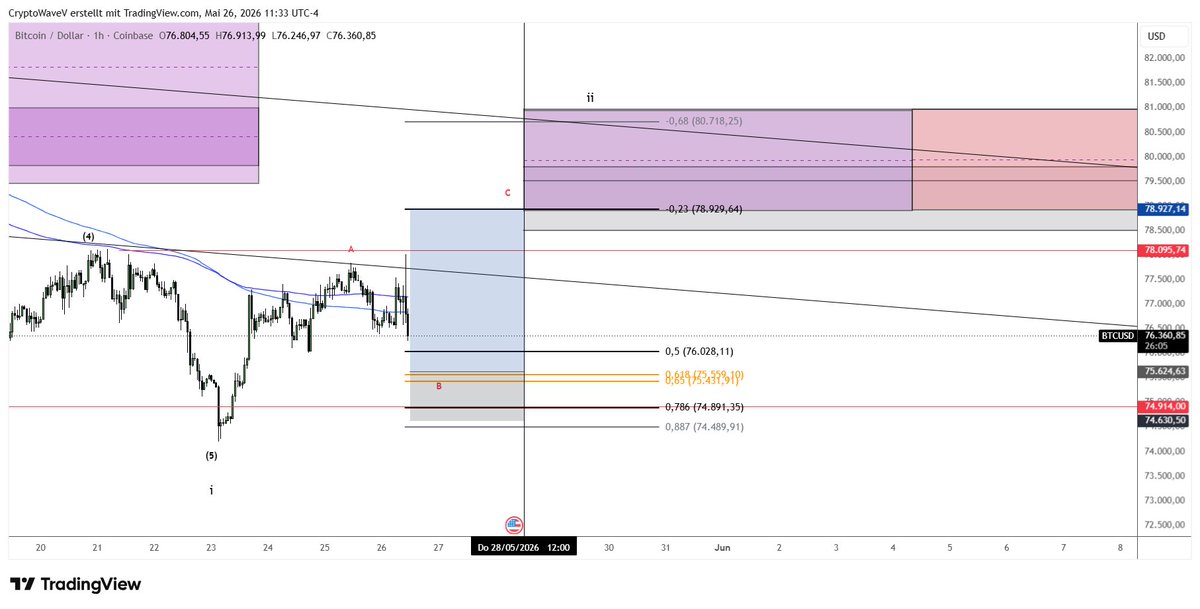
$BTC
I’ll probably take one final long trade this week. After the take-profit gets reached, I’ll most likely start reducing some of my other long positions as well.
2
9
806
May 26
Based on the time model — although I’m generally not a huge fan of trying to call exact tops within specific time windows — there’s a basic principle that says a correction should last at least 33% of the duration of the first impulse.
That means if this really is a corrective move on Bitcoin, it likely shouldn’t peak before Thursday at the earliest.
So the party probably continues until then, but after Thursday I’d start paying very close attention.
1
1
6
896