
DeFi, Altcoins & Macro. Class of '20 🎓 Daily charts here. Deep dives on youtube.com/@CryptoYieldPro ▶️ PRO Squad, Bonuses & Tools (NFA) 👇
Joined December 2024
- Tweets 2,506
- Following 578
- Followers 1,082
- Likes 5,447
900 Photos and videos
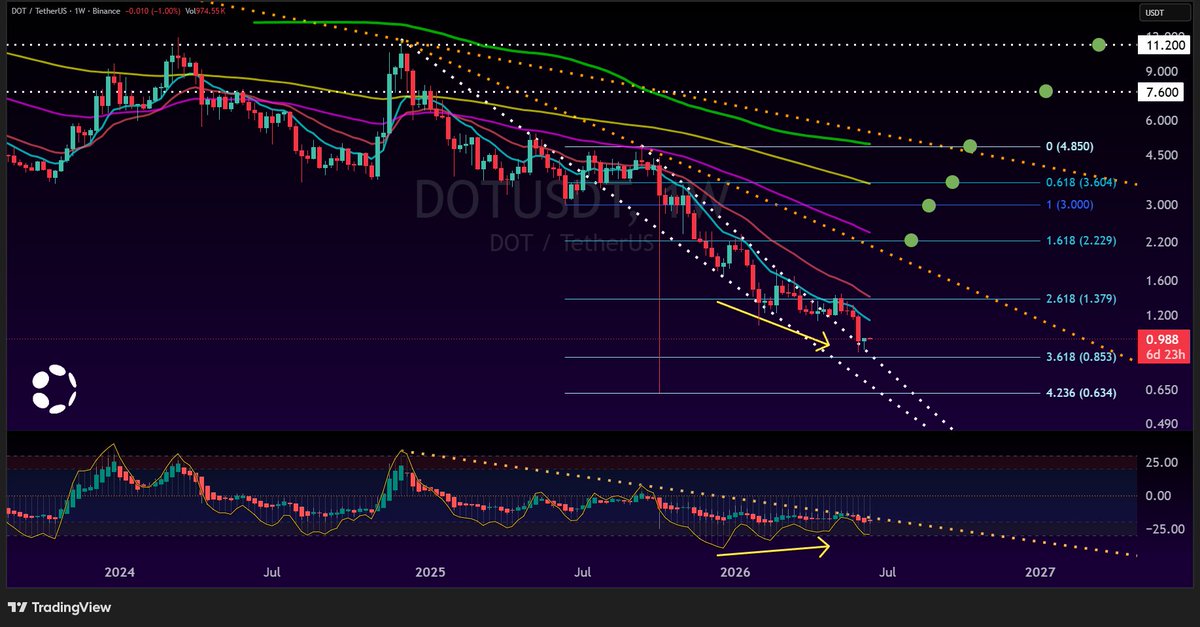


Polkadot $DOT broke its falling wedge in April, then turned the breakout into resistance.
Now pinned near all-time lows, with $0.85 acting like a magnet.
Chart's bearish. The code says otherwise.
Here's why. 🧵👇
1/2
1
1
202

Jun 10
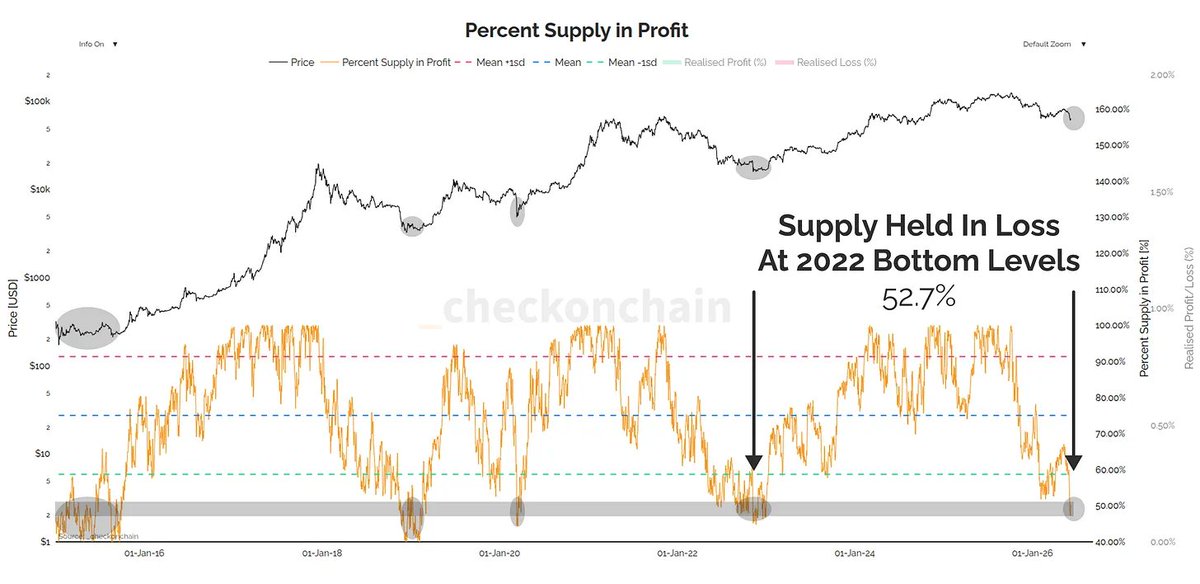
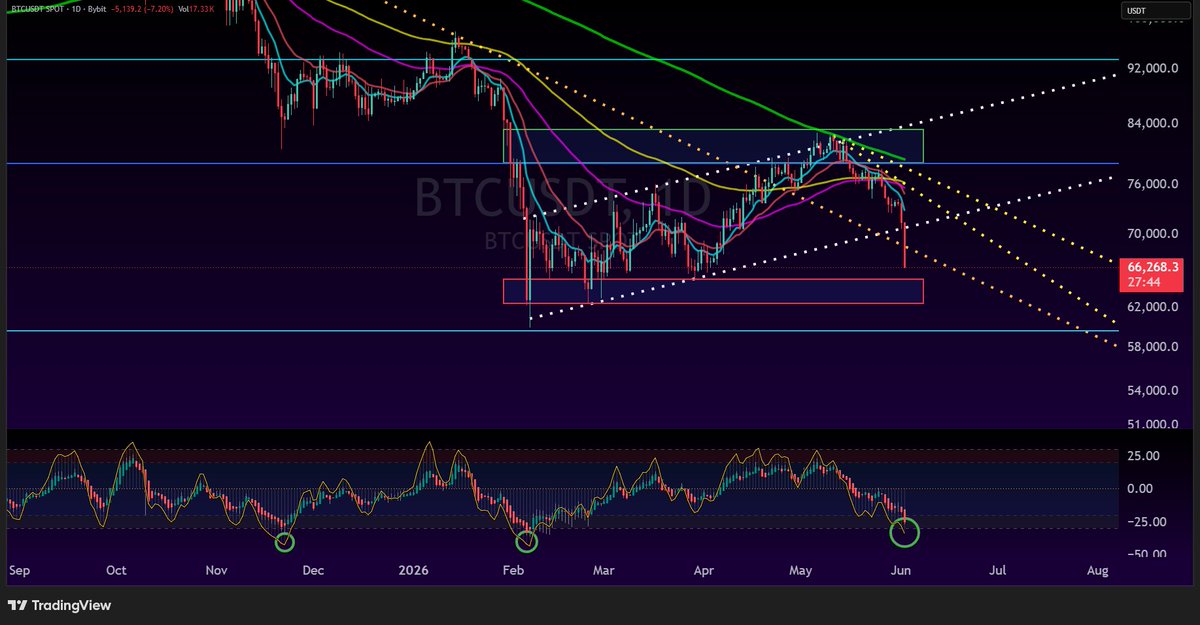
52.7% of Bitcoin supply is held at a loss.
That number marked the 2018 floor. It marked the 2022 floor. $BTC at $62k and we're back in the same band.
When the network gets this underwater, forced sellers run out of coins to dump. The pattern hasn't broken in 8 years.
72
Crypto Yield Pro retweeted

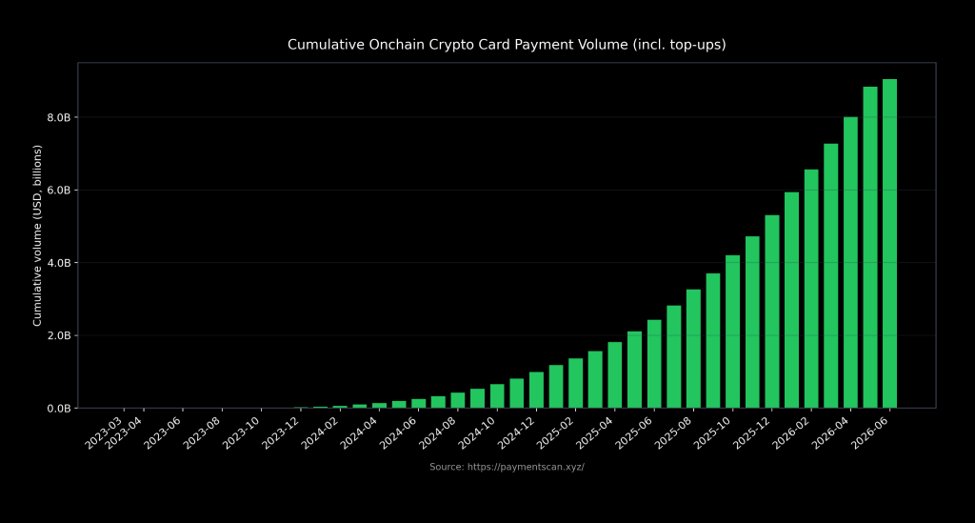
BREAKING: Total onchain crypto card payment volumes hit a record $833 million in May 2026, up 180% year-over-year.
High performance networks such as Optimism and Solana have benefited from the growth in payment related activity.
These networks have outperformed the broader market since 2025 while capturing a combined ~22% of market share.
Key onchain players are accelerating adoption, such as Jupiter Spend through localized payment options such as QR integration, which has seen 60% month-over-month payment volume growth.
As a result, cumulative onchain crypto card payment volumes have exceeded $9 billion for the first time in history.
Onchain adoption is seeing rapid growth.
97
134
1,141
158,711
The fundamentals on Bittensor $TAO have never looked better. The chart has rarely looked worse.
I walk through the full weekly setup and exactly how I'm positioned through it.
263
$cbETH saw a 5-month high in whale txs (185 >$100k) exactly at the local bottom.
While elevated volume can signal distribution, the immediate price stabilization points to block accumulation.
Large Ethereum wallets passively absorbed the selloff.
91
Crypto Yield Pro retweeted

Jun 8
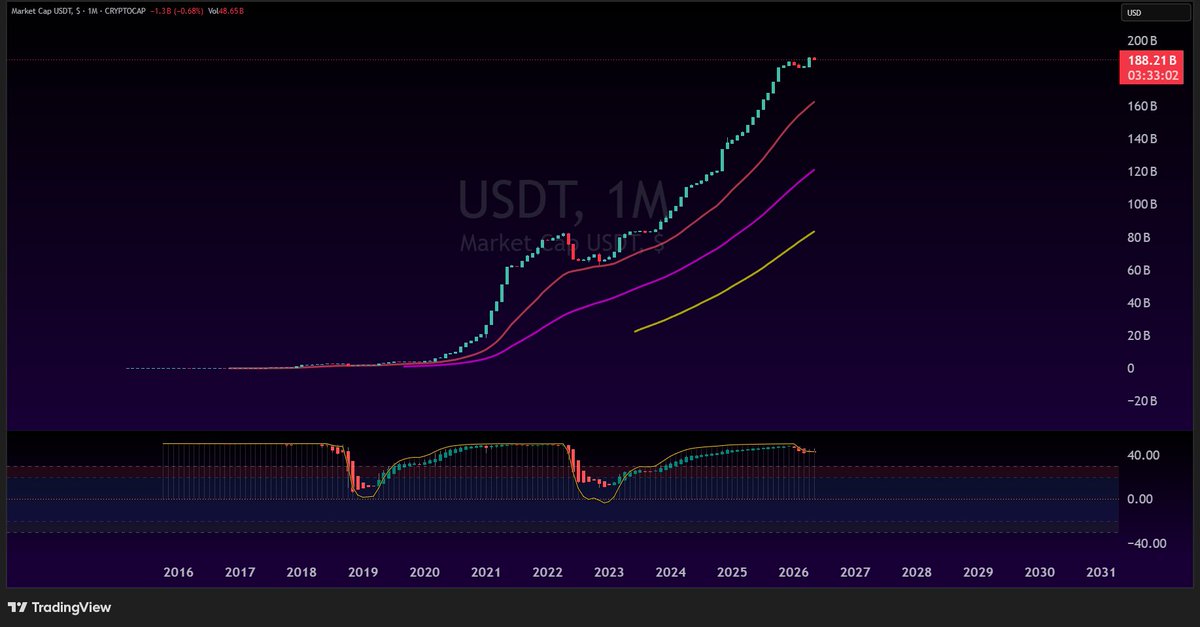
For the first time in history, Ethereum’s market cap is now the same as Tether’s market cap.
But what is even more intriguing is the Tether Market Cap vs Ethereum Market Cap Ratio, which has formed fascinating trendlines that have marked extremely precise tops and bottoms throughout Ethereum’s history.
And right now, it is testing the lower trendline again. 🫣
Use this information however you want.

13
18
142
8,381
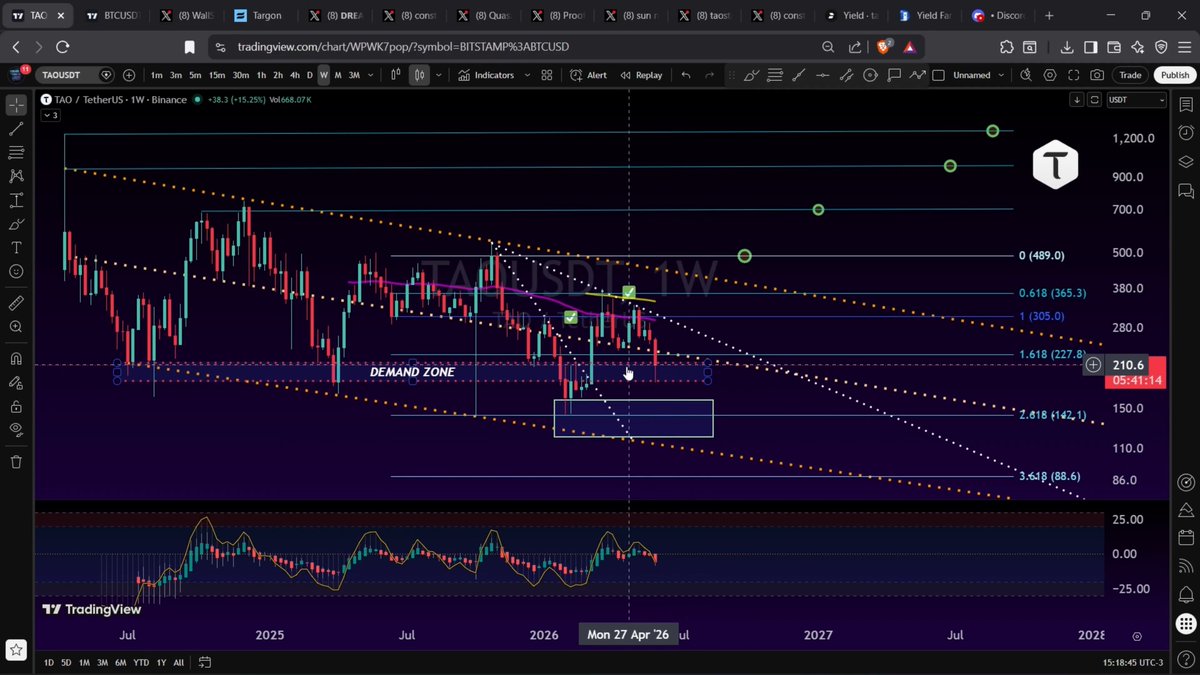
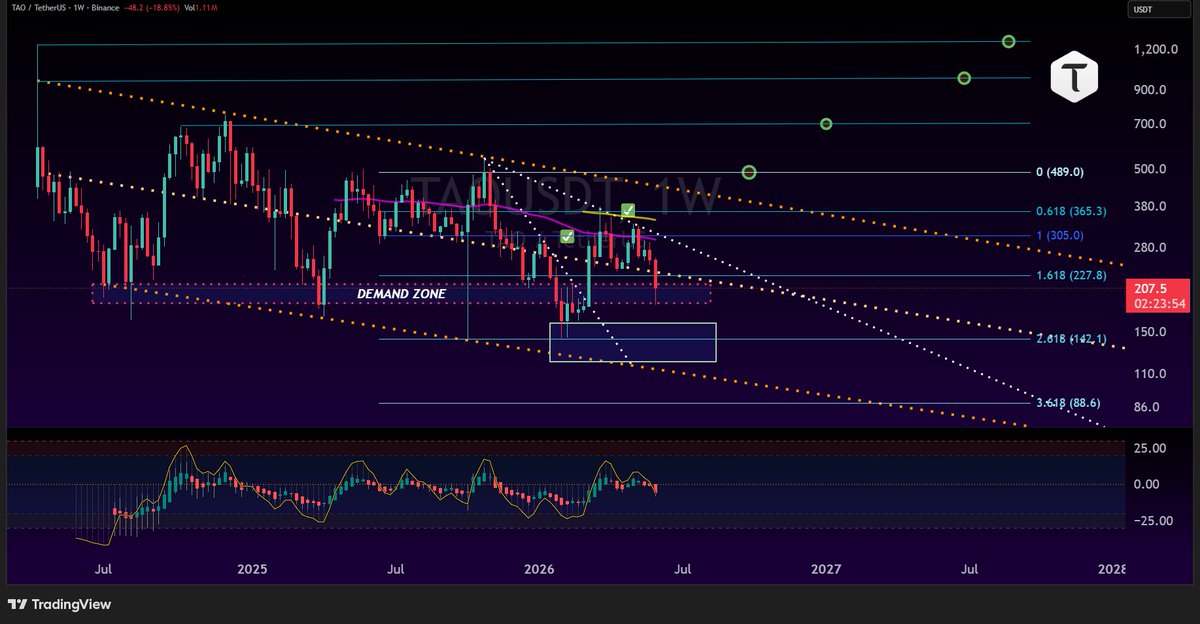
Bittensor $TAO lost the 1.618 fib at $227 and is closing back below the mid-channel.
Now parked in the $185-$210 demand zone. Strongest fundamentals it has ever had, weakest chart in a year.
Here's why. 🧵👇
1/2
1
1
464


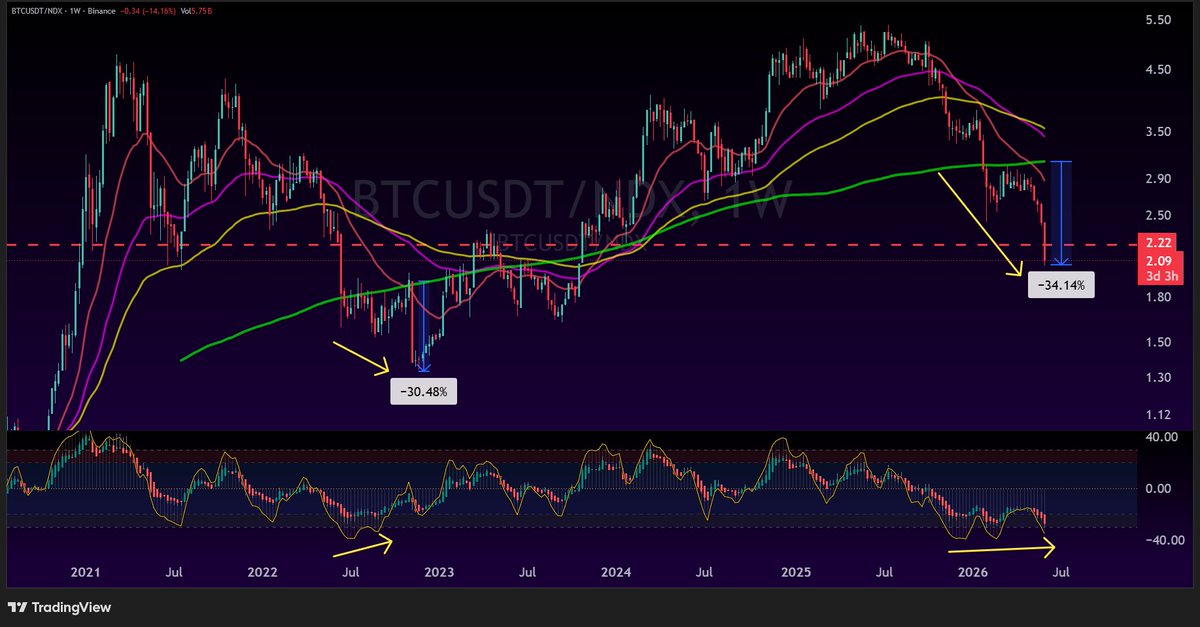
The great capital rotation is quietly setting up.
Take a look at the $BTC / $NDX (Nasdaq) 1W chart. We're printing a massive bottoming formation right at support, backed by a clear divergence on the RSI. (Seeing a similar setup against the S&P 500).
Let’s be clear on what this actually means:
This isn’t a guarantee of an immediate god candle in USD terms. It tells us that tradfi tech is positioned to correct harder than crypto in the coming weeks/months.
The play? Once Bitcoin confirms a solid macro support floor on its USD chart, I expect a decent portion of that exiting Nasdaq liquidity to rotate directly into Bitcoin / Crypto.
This capital rotation is a huge fuel catalyst behind the next major leg up, imo.
1
2
306
Crypto Yield Pro retweeted

Jun 2
There's a quiet changing of the guard underway in crypto this year.
By the end of 2026, the space will look quite different.
114
86
1,089
173,024
4M $CHZ burned in May. 57M unlocked the same month.
World Cup lands in days and most calls Chiliz the obvious trade.
The math disagrees.
Full breakdown of why I took a small position anyway:
4
6
32
6,068
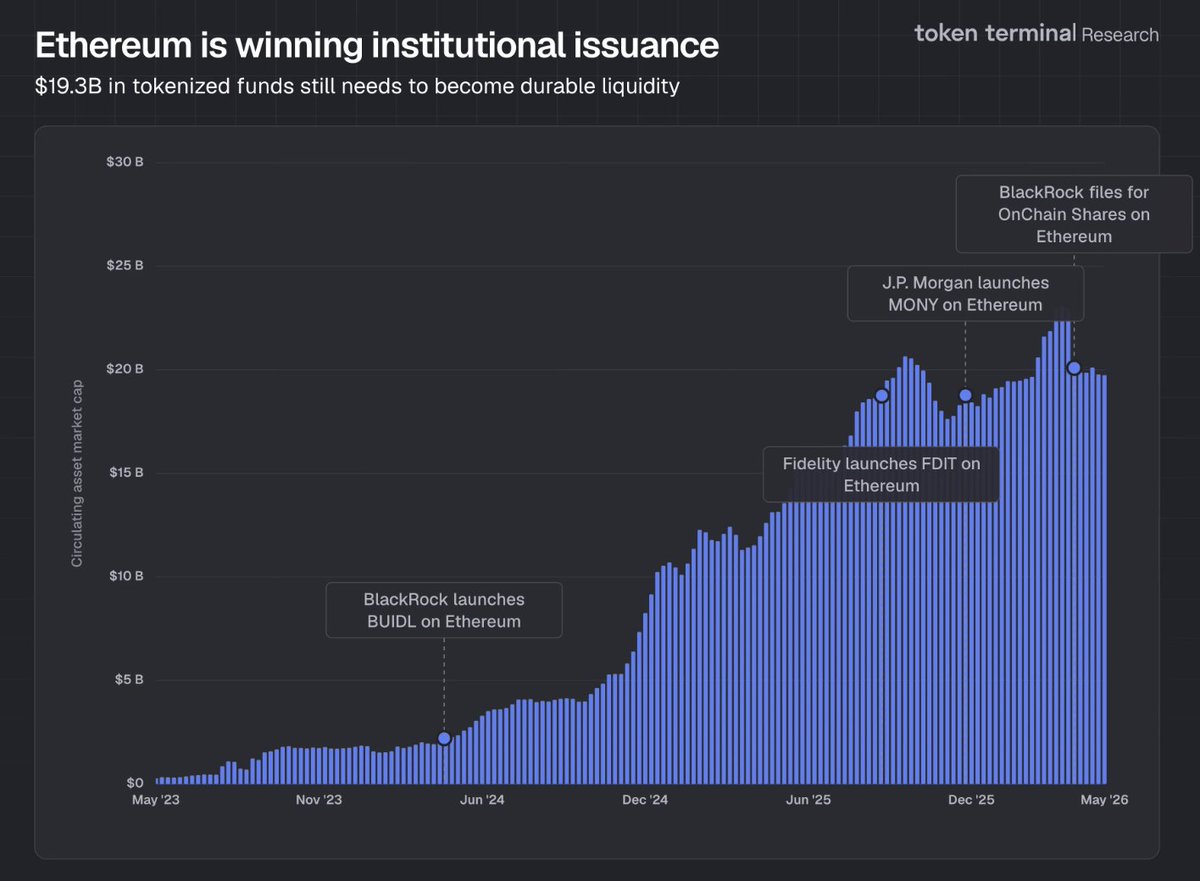
Why Ethereum? Follow the cash.
$179B in stablecoins live on Ethereum. That's 58% of the entire $308B onchain dollar supply.
Tron is second at $90B. Solana, a distant $13B.
BlackRock is definitely not chasing hype. It's parking next to the deepest pool of onchain money.
2/3
1
187
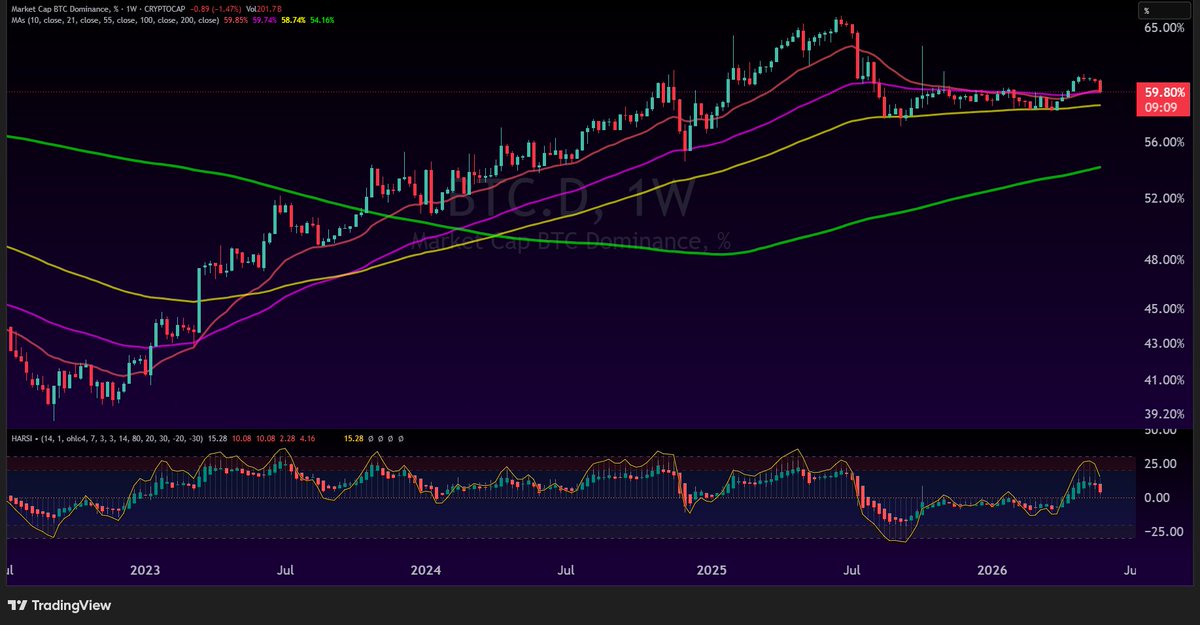
$BTC dominance just hit a decision candle.
59.8%. Sitting on the weekly 55 EMA.
Same level that cracked in August 2025 and gave us 250 days of altcoin-friendly chop.
April reclaimed it from below. Now it's being retested as support. HARSI overbought.
Two paths:
Lose the 55 EMA = altcoins finally breathe.
Hold it = direct shot at 65% and Bitcoin still the King.
One weekly close decides the next quarter.
1
1
616
May 31
$CHZ (Chiliz) weekly. Tapped 1.618 fib at $0.027. Below all EMAs, descending channel from 2021 intact.
Added a small DCA for the World Cup.
But the supply math is brutal. Here is why. 🧵👇
1/2

1
9
2,637