
Disabled People's Voice are a user-led DPO aiming to build a better life for Disabled People as members of a more inclusive society #disability #socialmodel
- Tweets 4,749
- Following 364
- Followers 430
- Likes 854


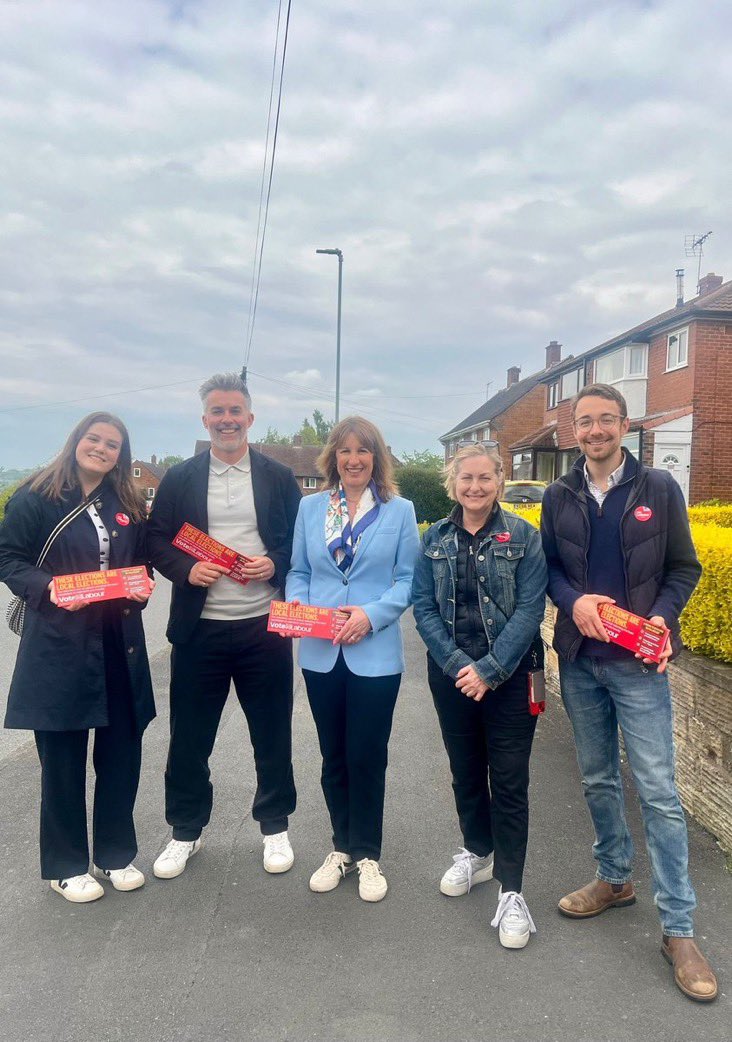
ALT Campaign photo featuring Rachel Reeves, Luke Charters, Alison Hume, and Mayor David Skaith.

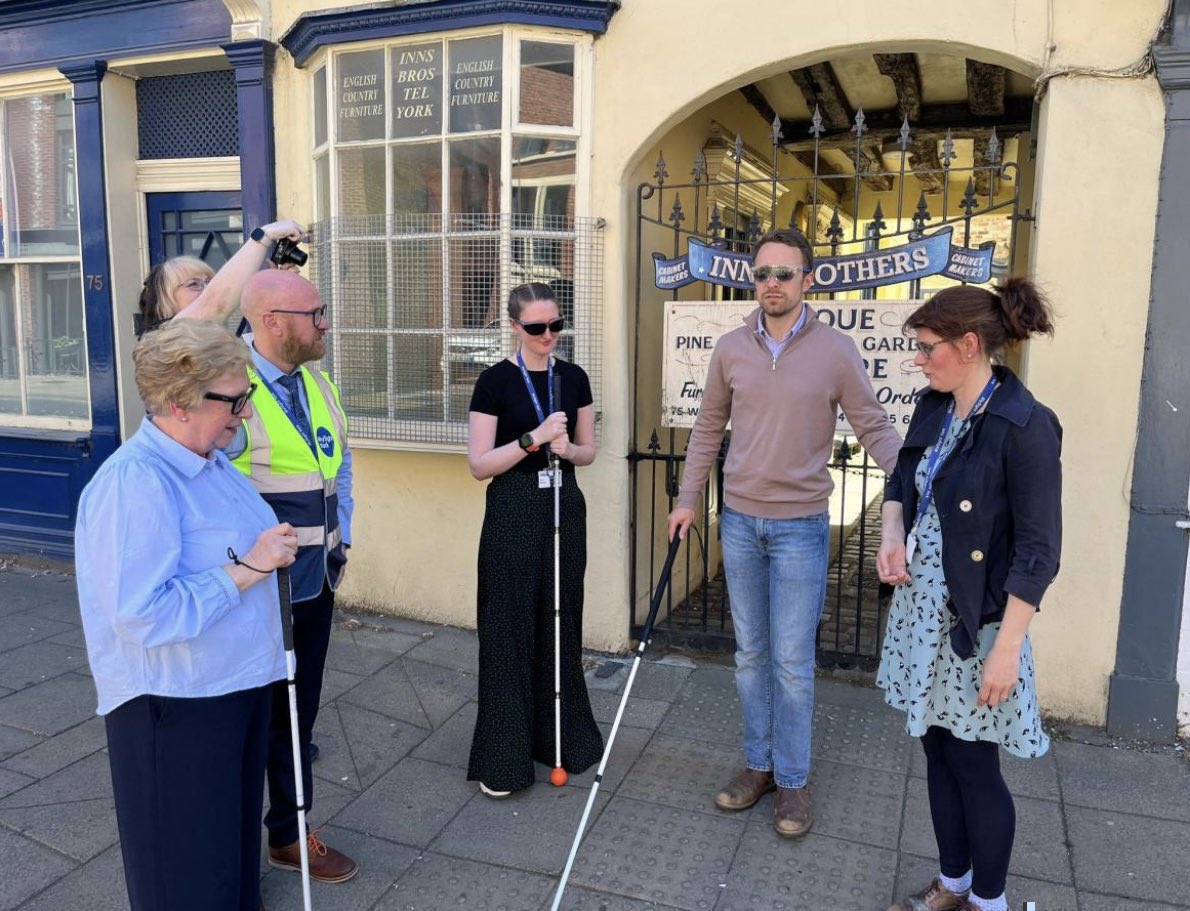
ALT Photo from Press showing Luke Charters wearing sim specs and holding a long white cane.
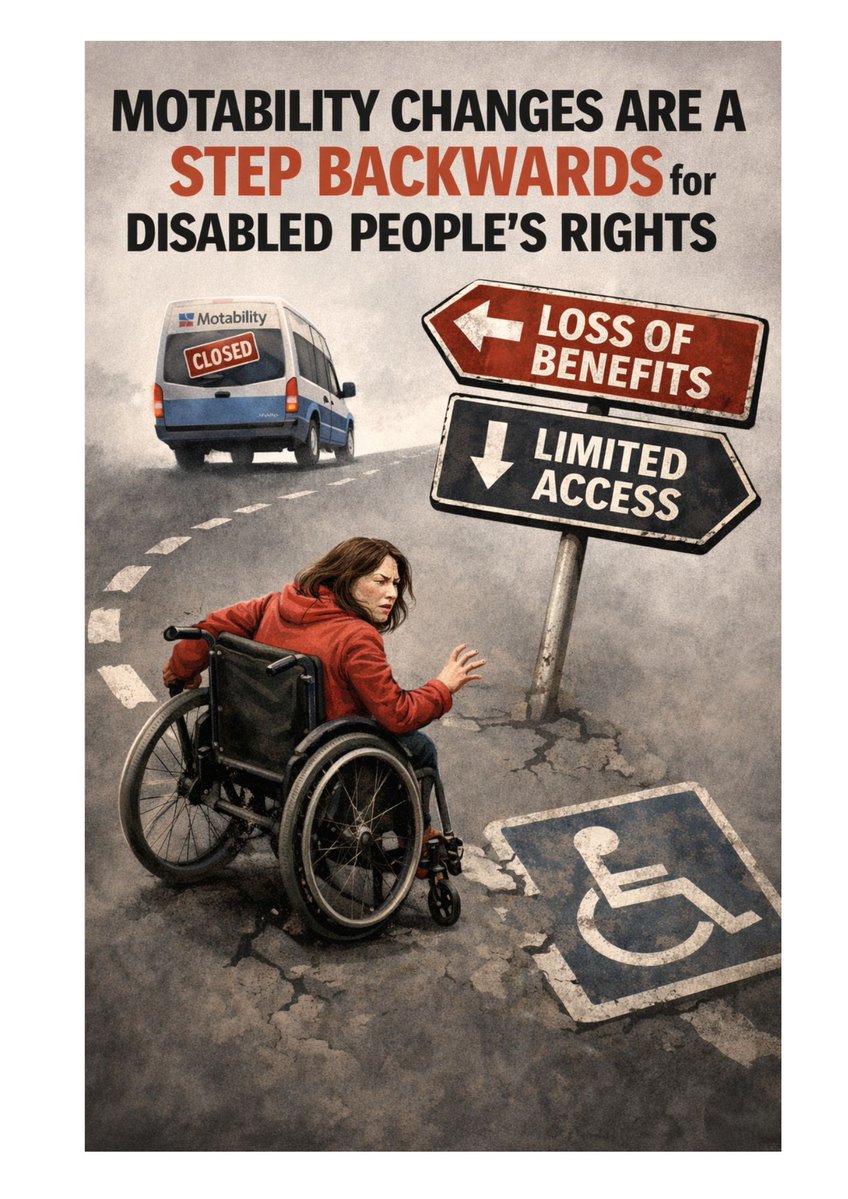
ALT A powerful illustration showing a wheelchair user on a cracked, uneven road, reaching out as a Motability van drives away with a “closed” sign on the back. Road signs point to “loss of benefits” and “limited access.” The ground is broken with a faded disabled parking symbol, and the headline reads: “Motability changes are a step backwards for disabled people’s rights.”

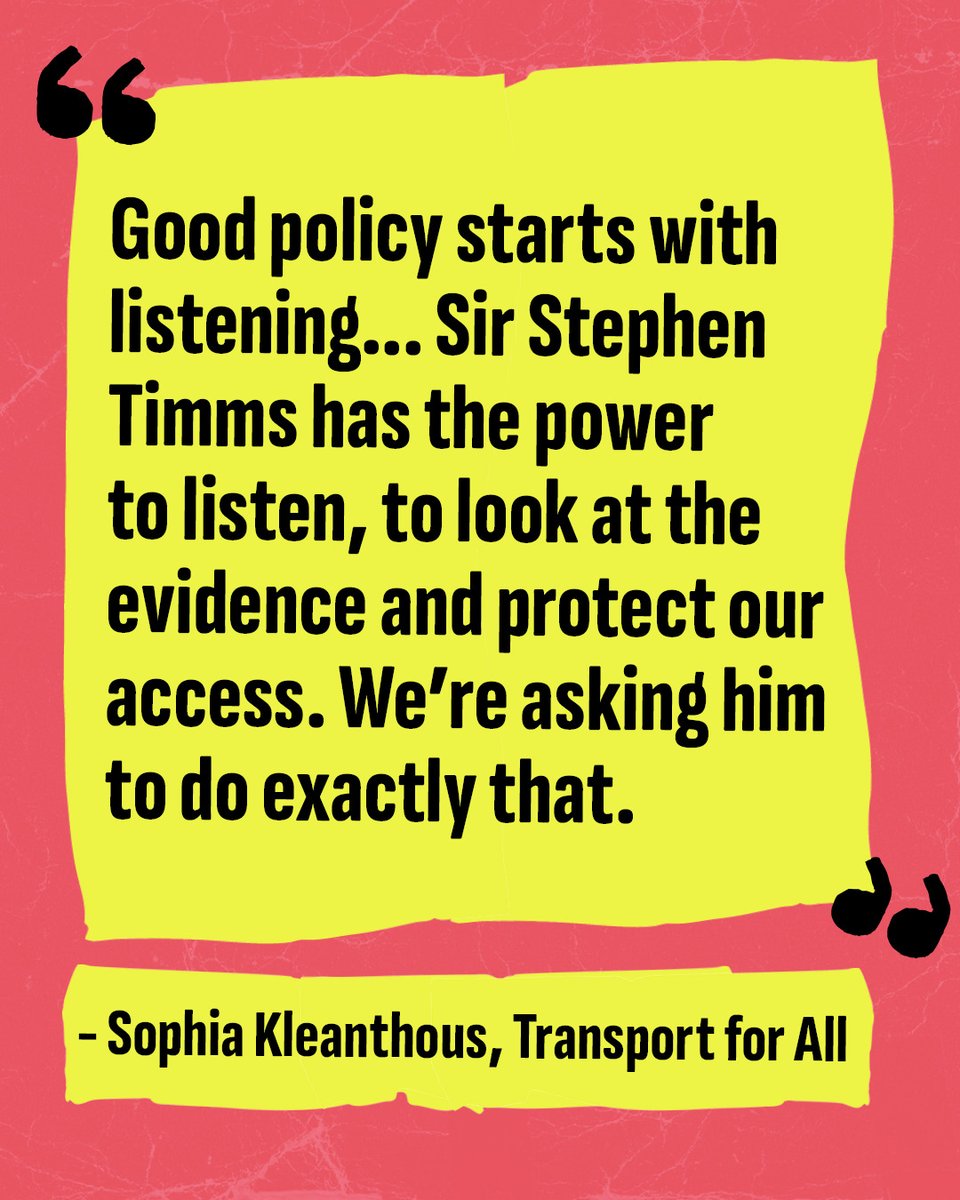
ALT Red textured background with yellow tape. Bold black text shares a quote from Sophia Kleanthous at Transport for All. It reads: "Good policy starts with listening... Sir Stephen Timms has the power to listen, to look at the evidence and protect our access. We're asking him to do exactly that."
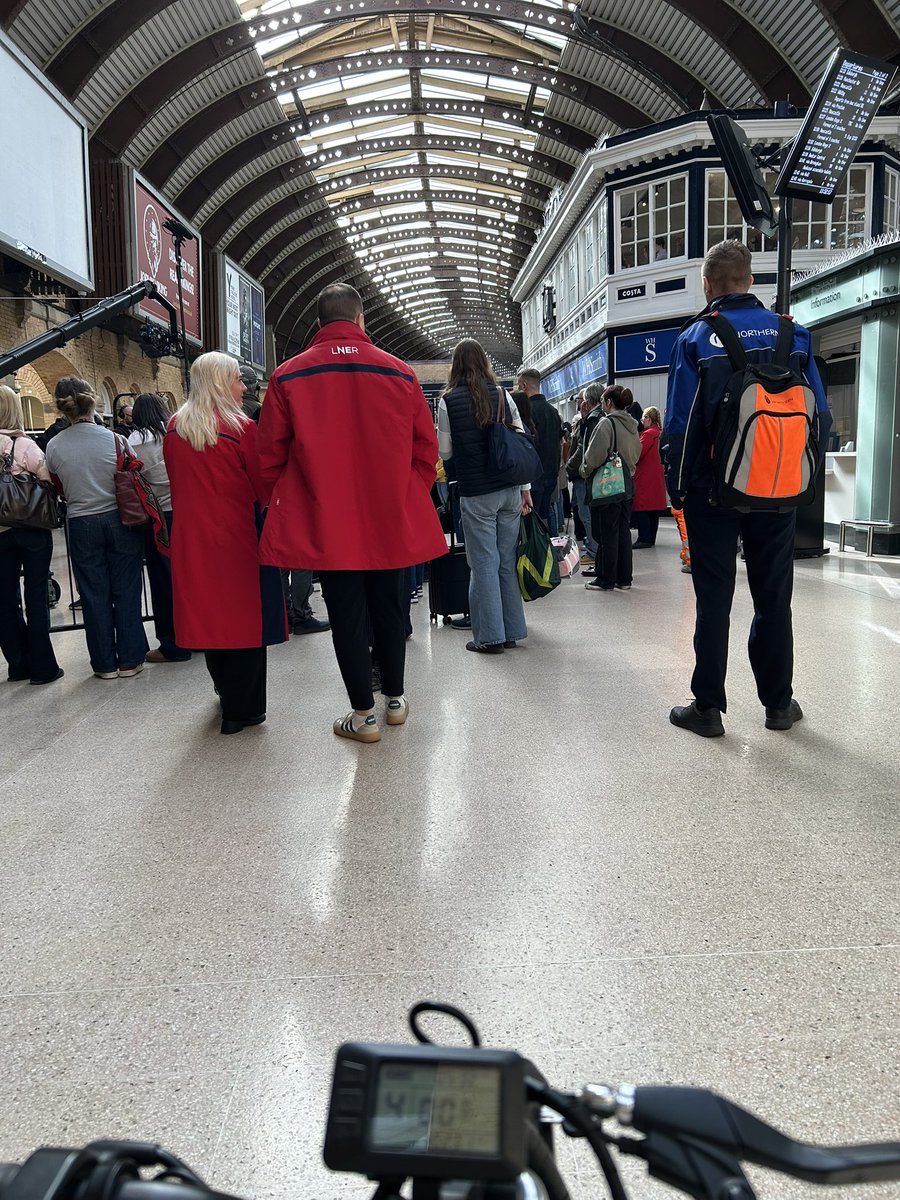
ALT Crowds surrounding the performance area with a pianist playing completely blocking the way through the concourse
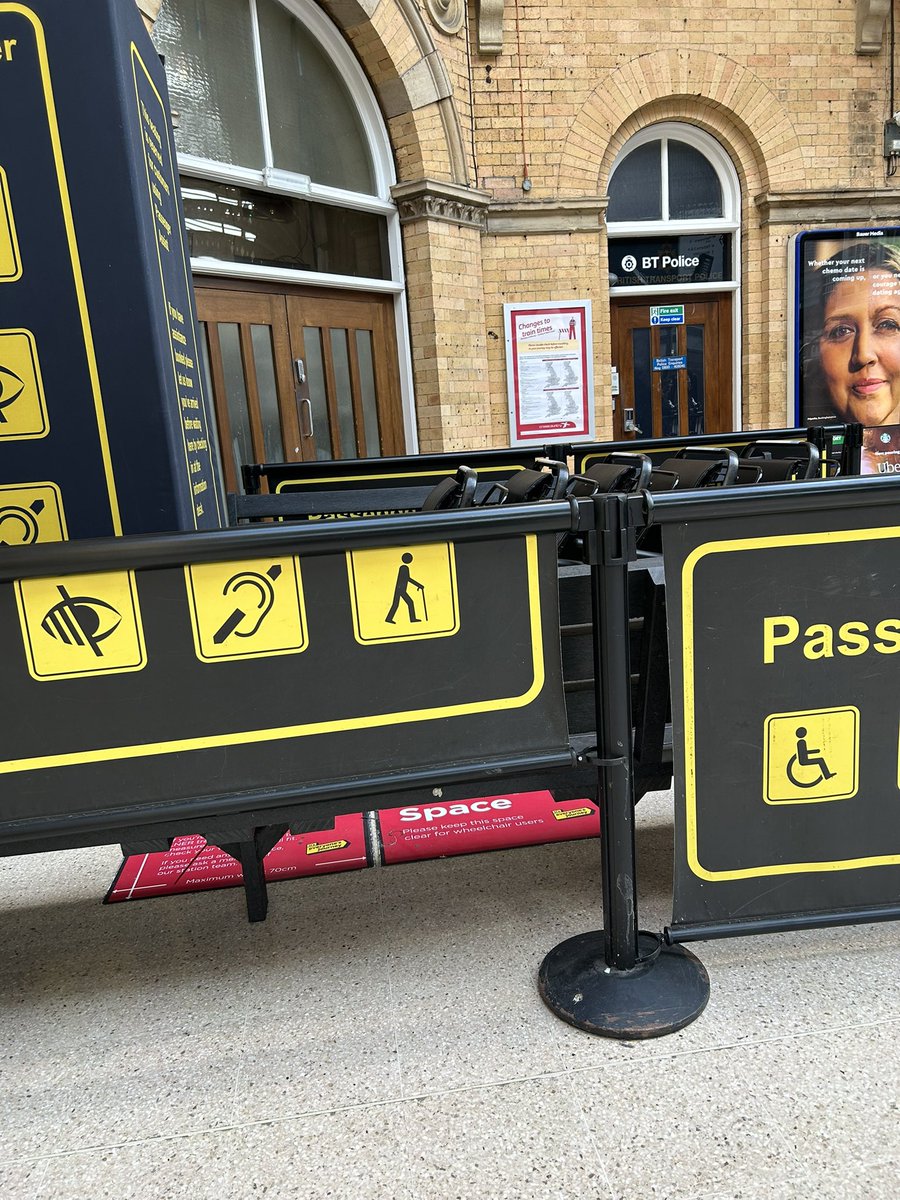
ALT Passenger assistance surrounds pushed into corner around row of wheelchairs with nowhere to sit down


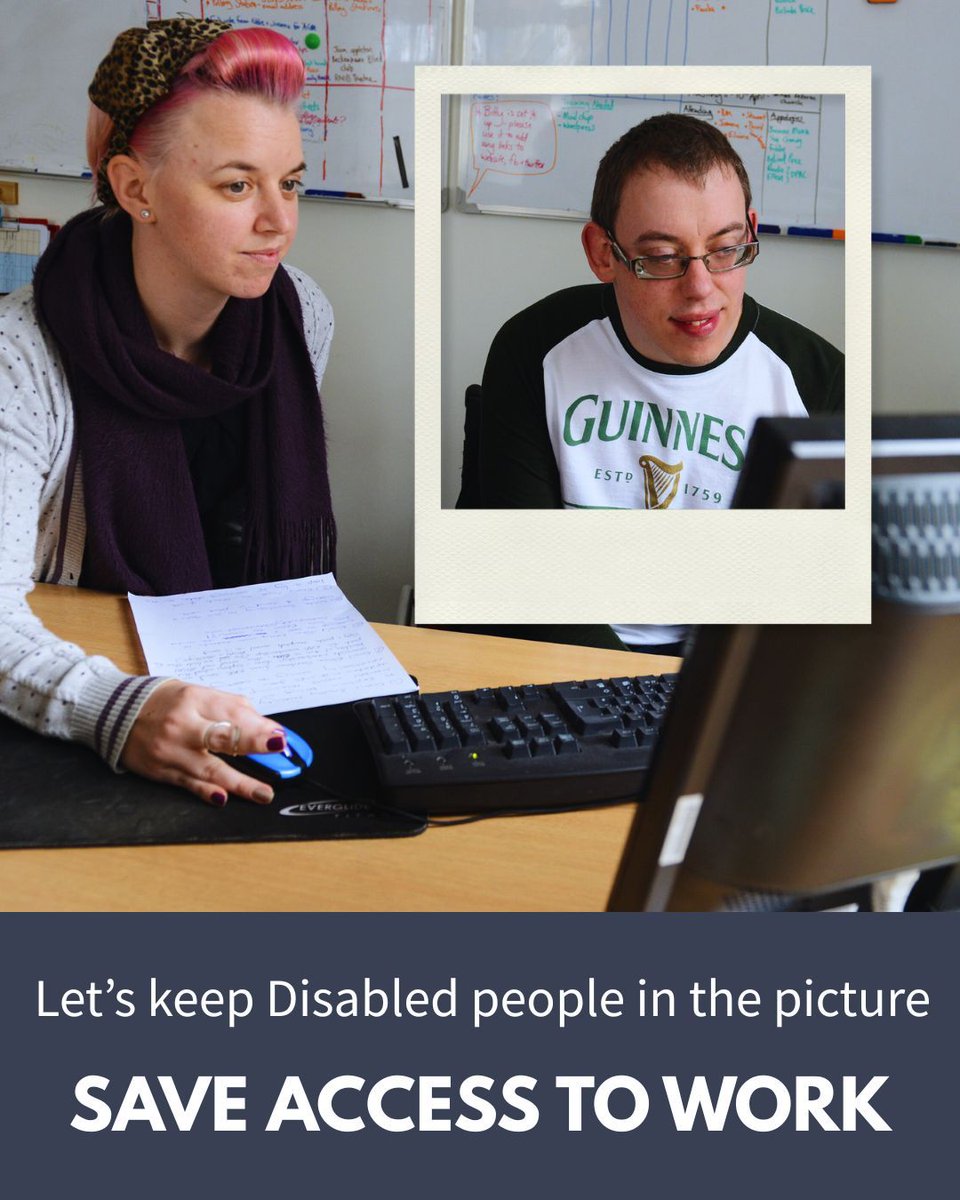
ALT A photo of two people working at a desk. One is framed as if in a Polaroid photo. Text below them says "Let's keep Disabled people in the picture. Save Access to Work."

ALT Blue textured background with yellow tape and bold black text reading: If we're not in the data, we're not in the plan

ALT Blue textured background with yellow rectangle and black text reading: For example: PTAL tells London planners how connected a place is. But not how accessible it is. Our research shows if you factor in step-free access, toilets and crowding, the picture looks very different
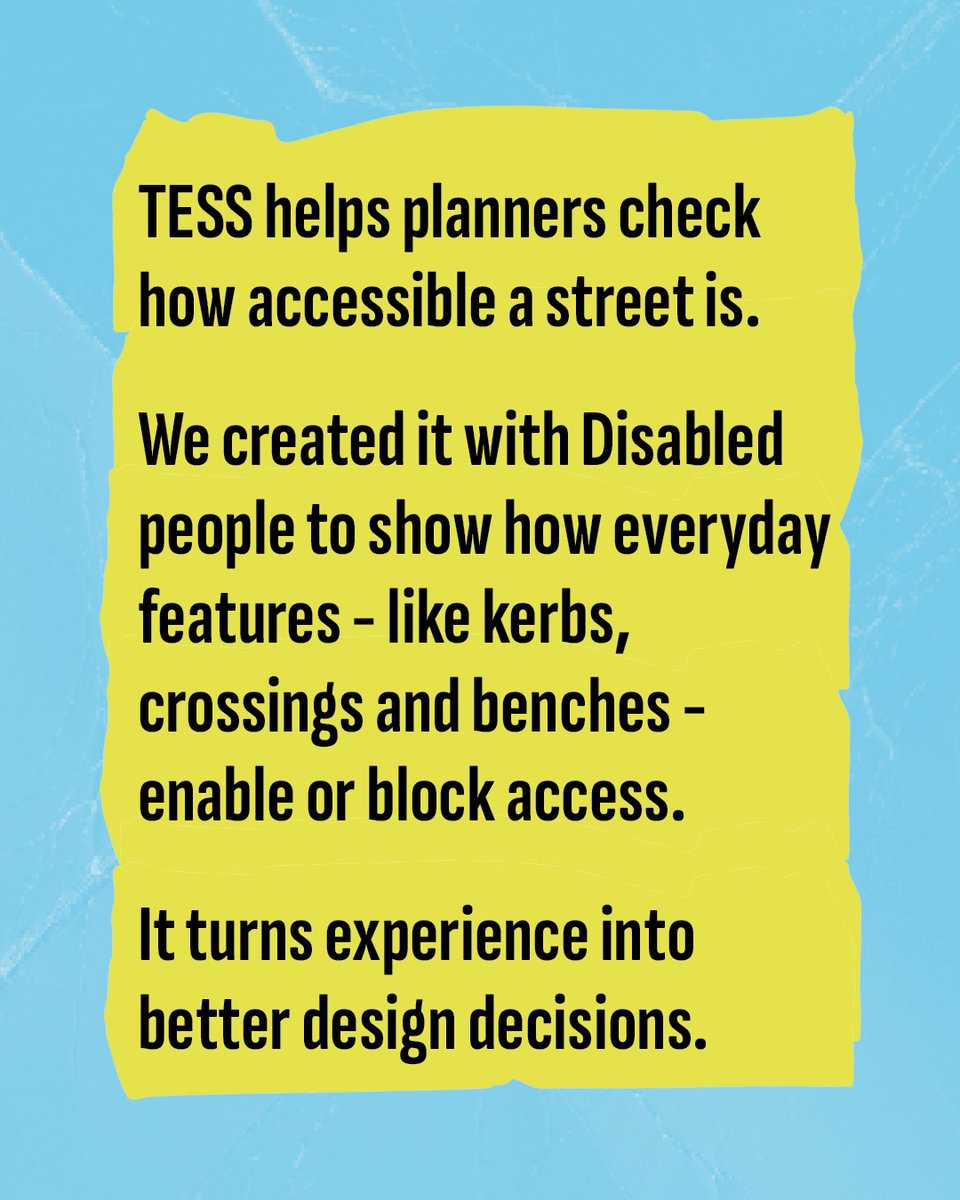
ALT Blue textured background with yellow rectangle and black text reading: TESS helps planners check how accessible a street is. We created it with Disabled people to show how everyday features - like kerbs, crossing and benches - enable or block access. It turns experience into better design decisions.
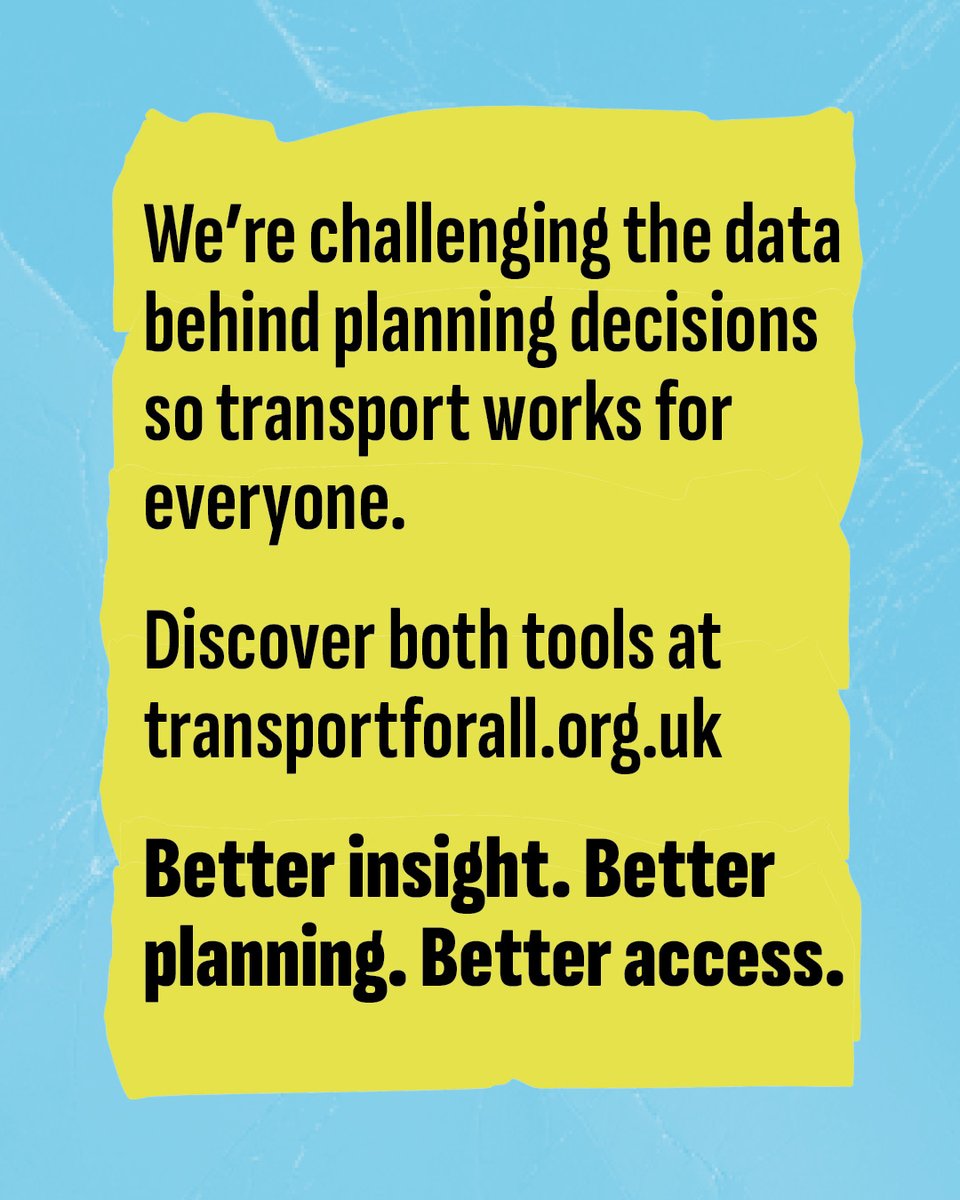
ALT Blue textured background with yellow rectangle and black text reading: We're challenging the data behind planning decisions so transport works for everyone. Discover both tools at transportforall.org.uk. Better insight. Better planning. Better access.