
Fulltime Crypto Trader & Investor 📈 | Tweets are not financial advice | TG: t.me/DaanCryptoTG | YT: youtube.com/@daancrypto |
Joined October 2017
- Tweets 50,741
- Following 538
- Followers 415,728
- Likes 121,038
13,425 Photos and videos


Pinned Tweet

12 Jun 2021
Educational Thread Overview 📚
Below, you can find all my educational threads about subjects like Profit Taking, Risk Management and others. 👇
2,699
2,165
6,809
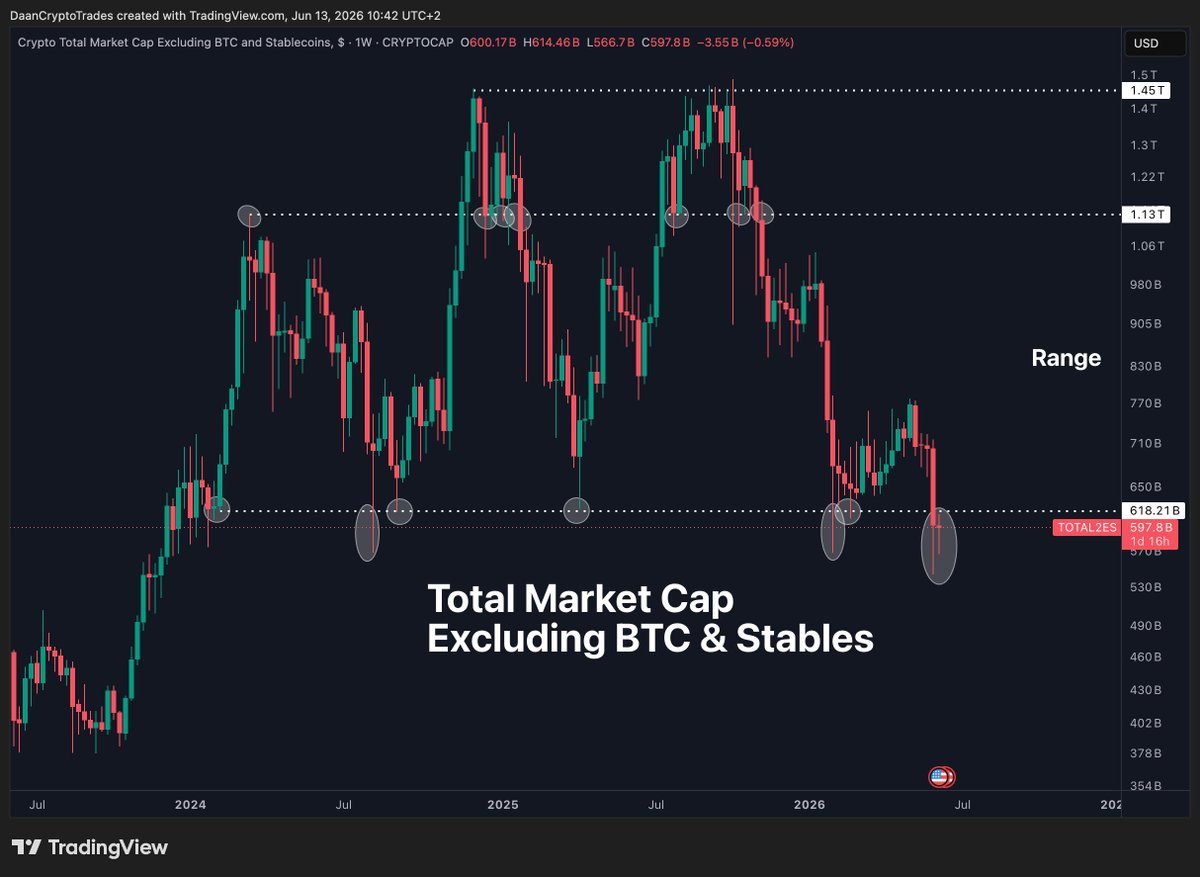
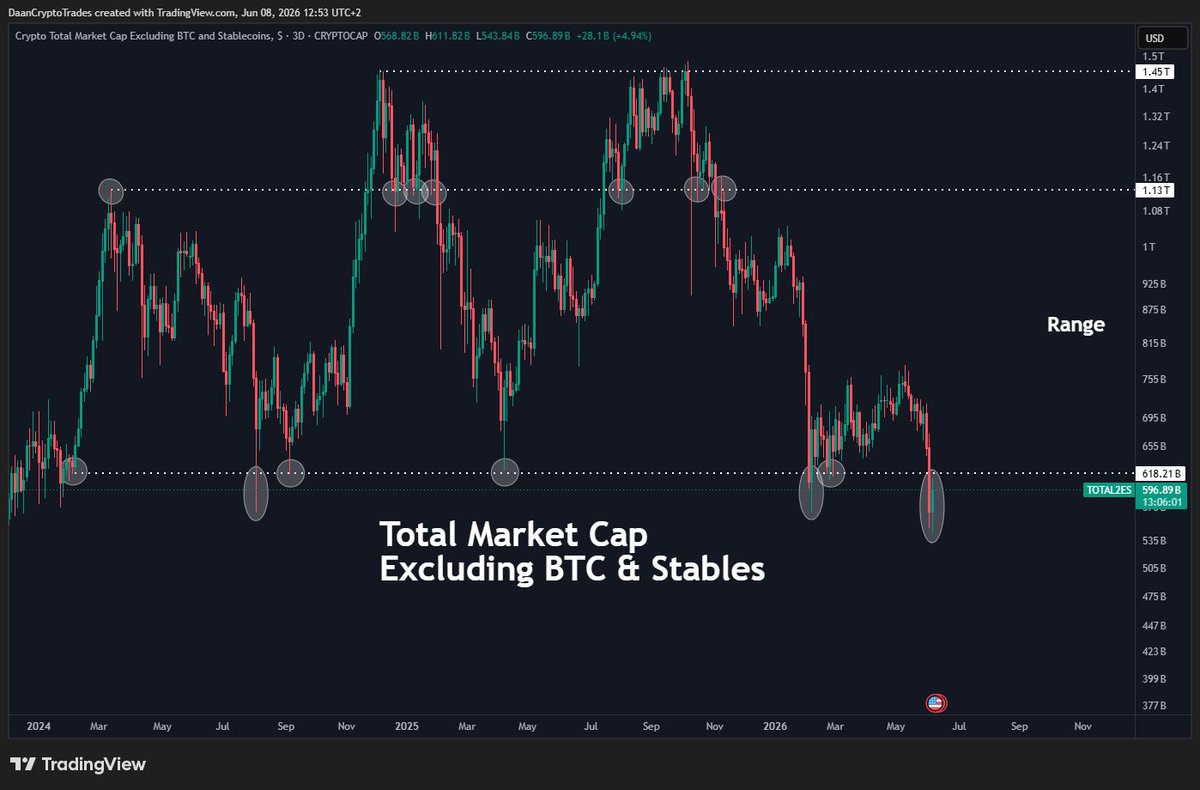
The Total Altcoin Market Cap is attempting to break into its 2.5 year range.
So far, this breakdown has been pretty lackluster so a potential deviation back into the range could definitely be on the board.
That's what I'm looking for here to determine what to expect in the weeks to come.
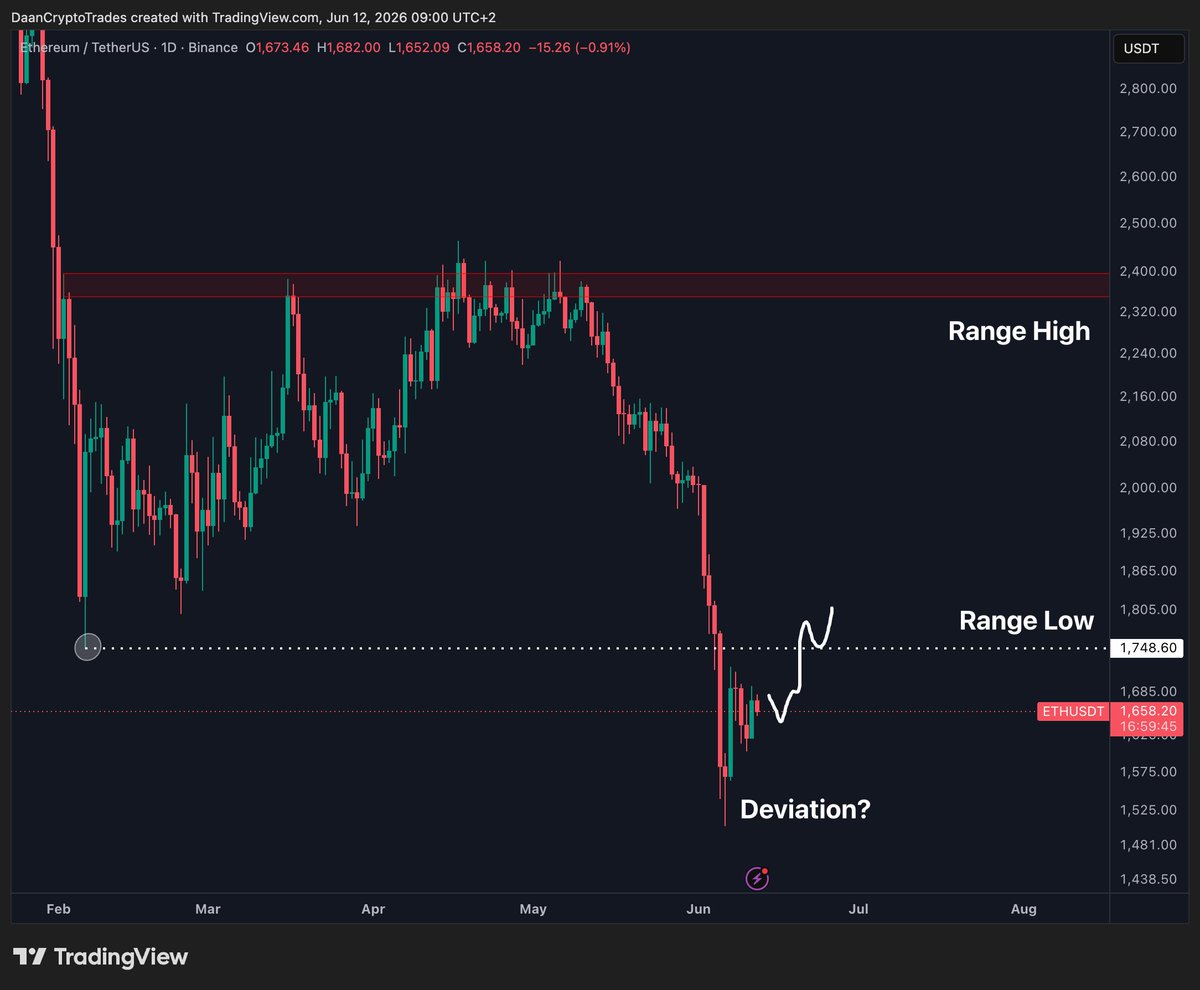
This level coincides with $ETH retaking its ~$1750 level.

The Total Altcoin Market Cap has broken down from its 2.5 year range low. But it has done similar deviations in the past several times.
It will be key for the bulls to try and get back in the range. Especially after sweeping all the prior lows, I think that could make for a good setup for further upside upon retaking the range.
So eyes on that area.
12
4
48
8,678
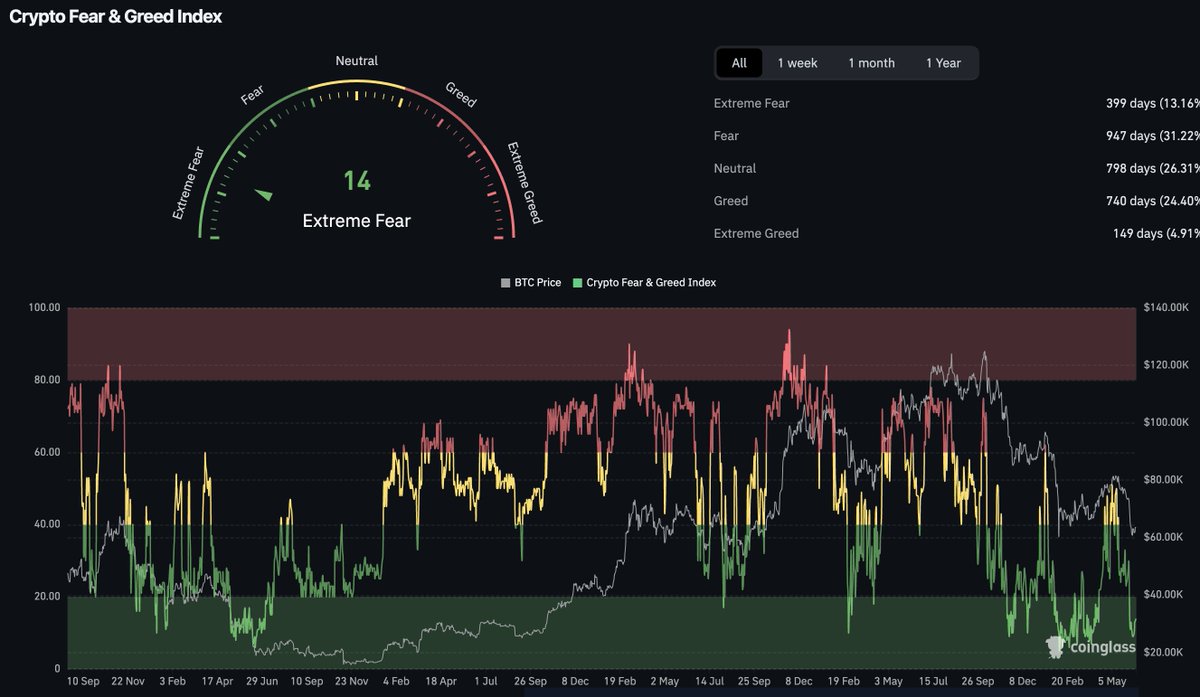
$BTC Has not spend any time in its "Extreme Greed" territory Since January 2025.
It comes to no surprise that this cycle has not even been close to previous cycle's euphoria and craziness. As most of the speculation was done in other markets (AI, Robotics, Chips etc).
The Fear & Greed indicator has also been in the extreme fear levels for more than the last bear market combined.
36
18
102
7,724
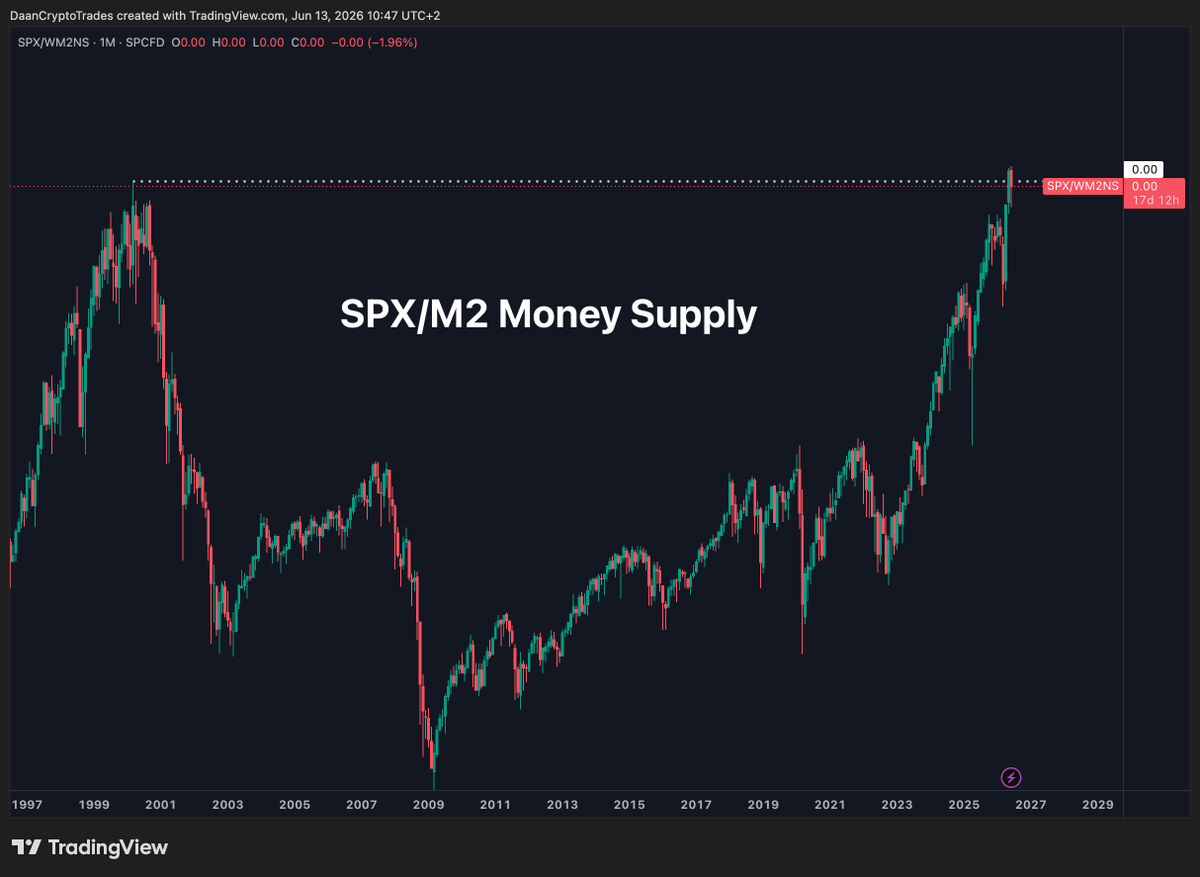
Fun Fact: When we divide the S&P 500's price by the M2 Money Supply, it is now exactly at its dot com bubble heights.
Over 25 years later.
30
15
144
10,694
$ETH Is it time for accumulation yet?
- Ethereum is on track for its 2nd worst first half of the year after 2022.
- It's the second time where ETH has seen a red Q1 and Q2 (also behind 2022).
- It's time ETH sees 3 consecutive red quarters in a row.
Easy to say this has been an extremely bad 9 months for ETH after topping post the $BMNR accumulation craze.
I do personally still think ETH will play an important role in the world of tokenization, DeFi and all. I also think the current levels are finally attractive again for longer term accumulation (years).
But as always, slow and steady wins the race here. Bear markets can go on for longer than you initially expect them to. It never hurts to have some dry powder on the side for unforeseen circumstances.
40
17
161
16,241
Jun 13
$BTC Still holding on to its Weekly 200MA this week.
As long as price trades close to it, it will be important to keep watching for the weekly closes.
65
28
262
16,196
Jun 13
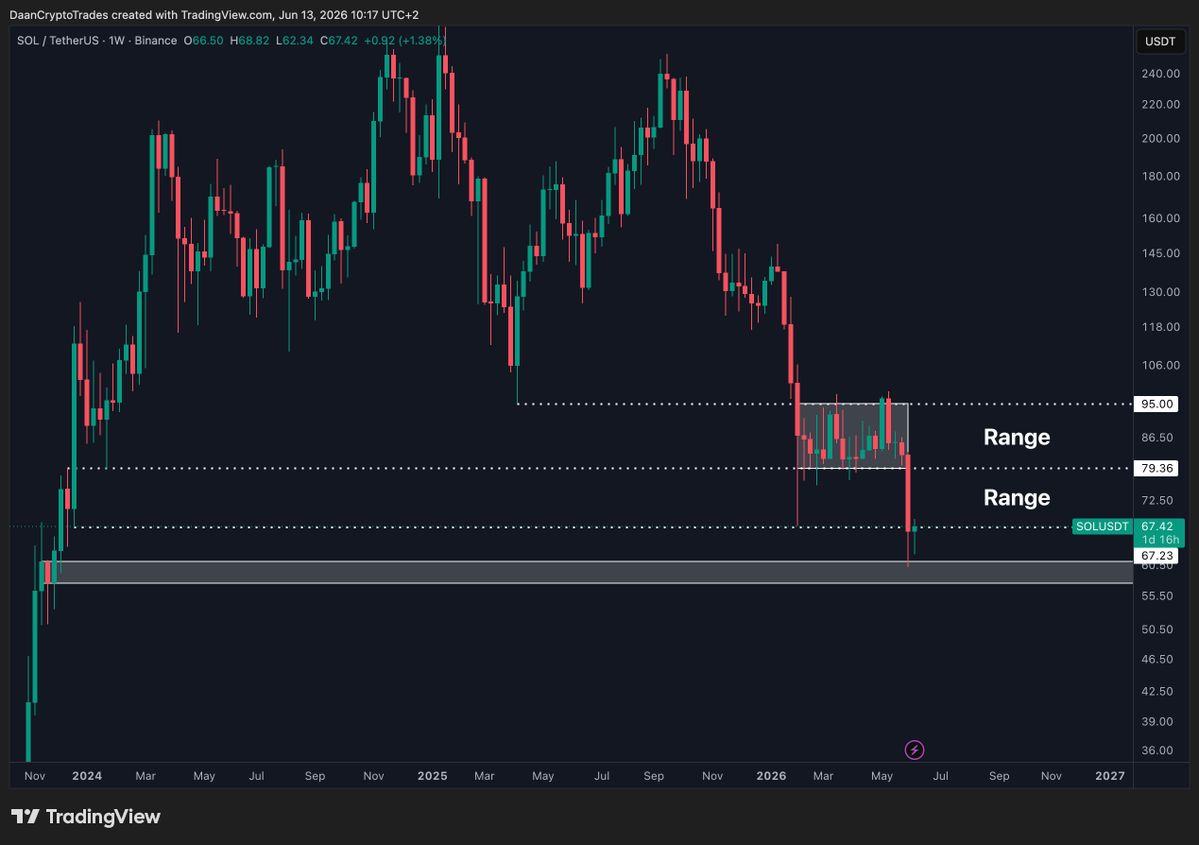
$SOL Trying to get back above the ~$67 horizontal level which marked the February low.
For me it's pretty straight forward here for SOL, it hit its last major weekly support at ~$60 and bounced for now.
From here on out it will just be about watching the weekly levels to see if it can flip the market structure around locally.
56
22
191
12,935
Jun 13
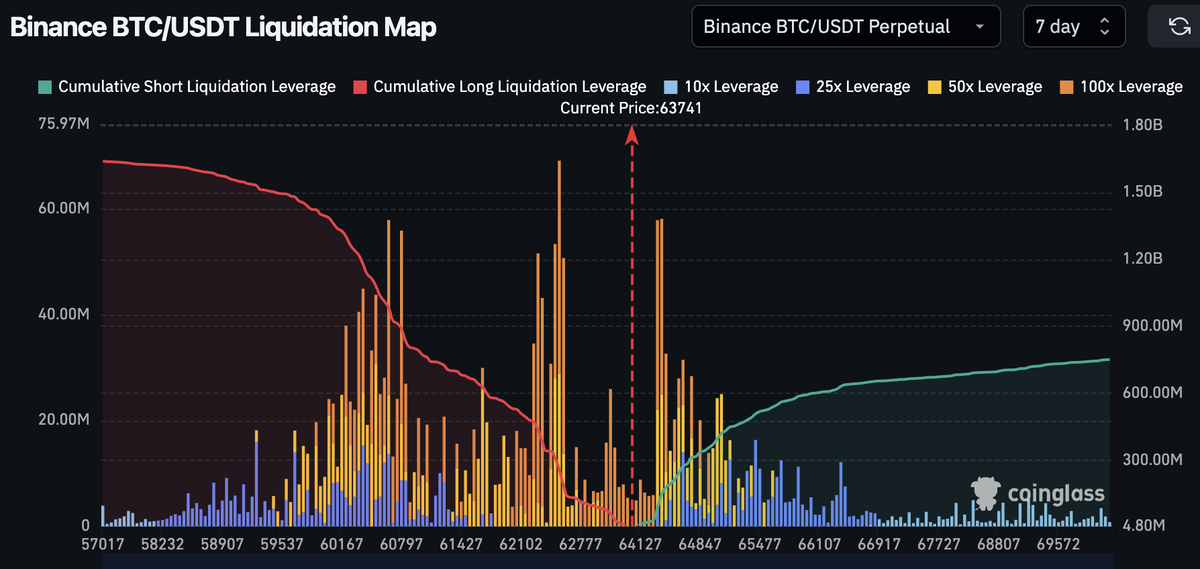
$BTC's Biggest liquidation clusters sitting at ~$60.5K, $62.5K & $64.4K.
Good to watch these levels if price trades into them, often they act as local reversal zones after a liquidity grab. Especially during weekends.
48
23
174
10,321
Jun 13
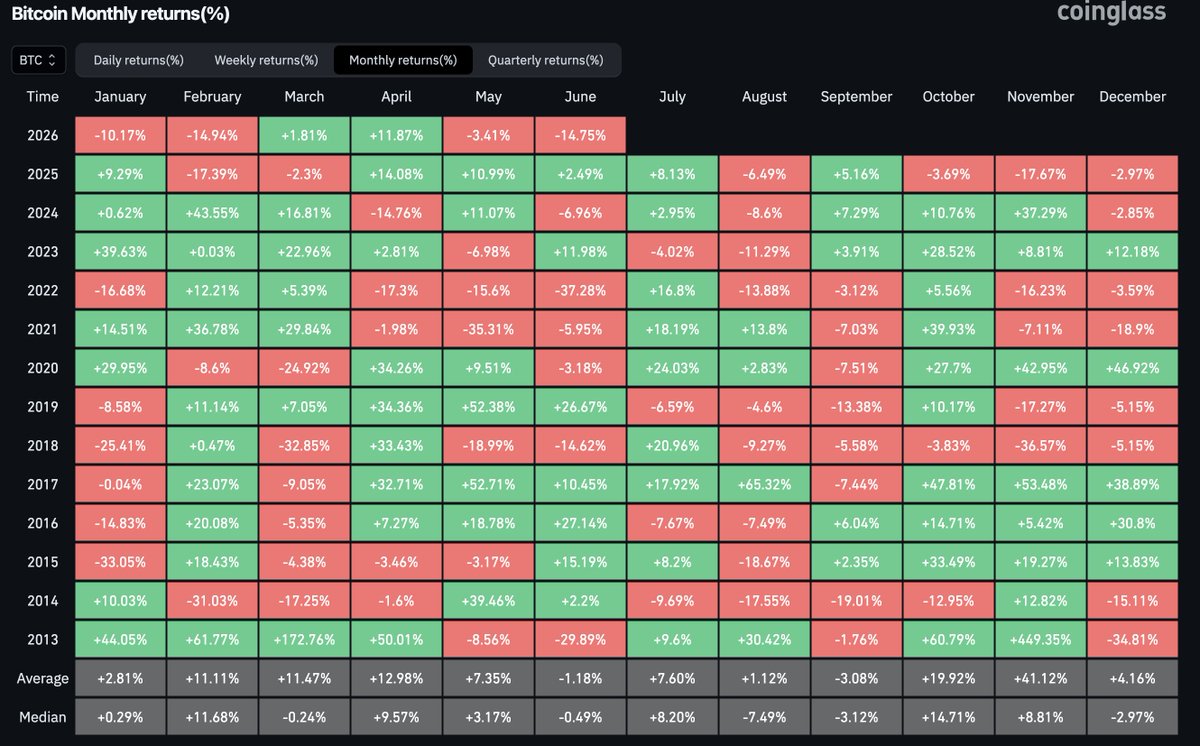
$BTC Currently on track for its worst June performance since 2022 which was the previous bear market year.
July, August & September are generally pretty slow and don't see insane moves on average due to the lower Summer liquidity and action.
It is not until October when we generally see big moves occur again. This would also be the month where the bear market would be ending according to the 4 year cycle timeframe.
47
25
192
14,929
Jun 12
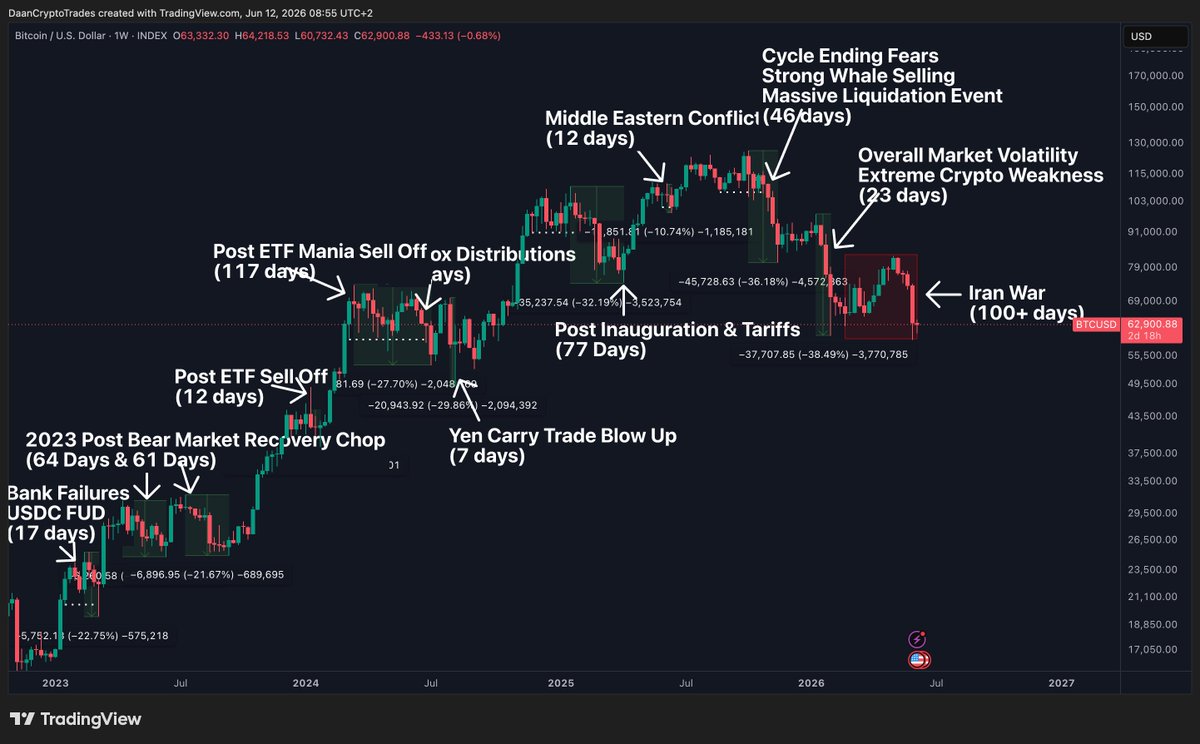
$BTC All the major drawdowns and narratives as to why this cycle.
The current conflict in the middle east has now lasted over 100 days and price remains relatively unchanged.
32
17
113
8,563
Jun 12
$ETH Has been trading lower in this channel/wedge against $BTC over the past 10 months.
An easy trade in my eyes would be to wait for the ETH/BTC pair to break this down trend and then hop onto the momentum that might unfold.
Until then, it's just lower highs and lower lows. At least price has now hit the previous breakout level during the BMNR move. Should offer some high timeframe support locally.
37
100
260
11,982
Jun 12
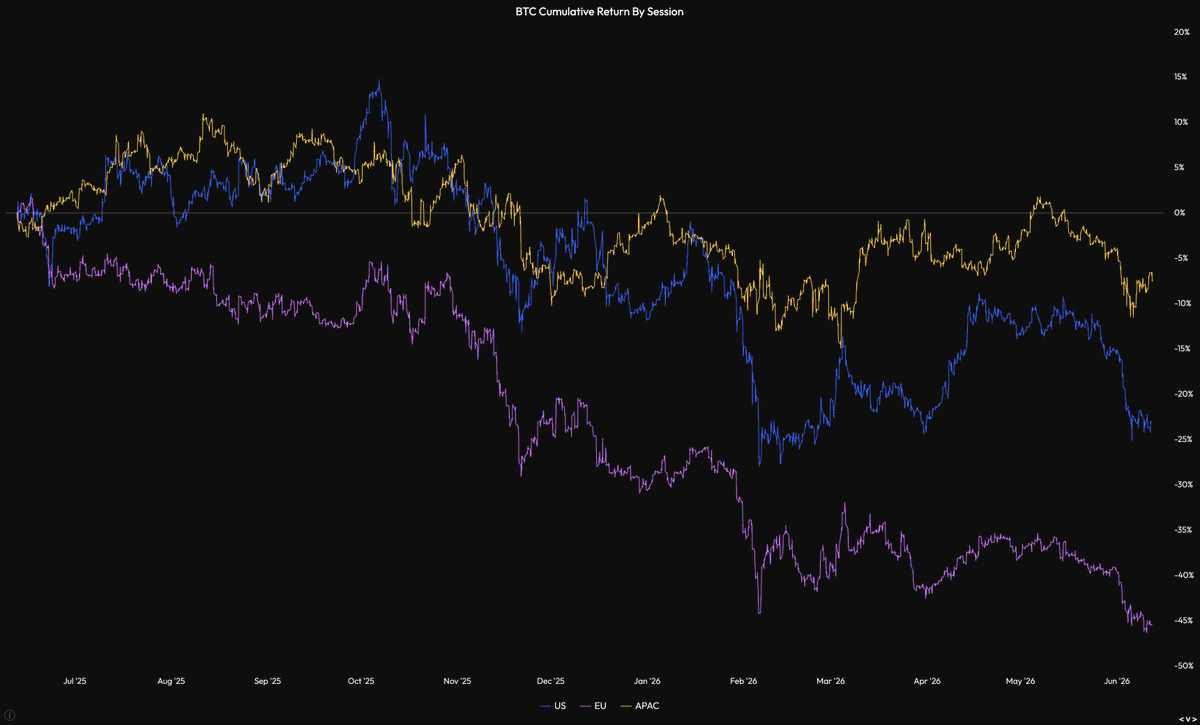
$BTC Most of the selling this year has been from the EU trading sessions.
Asia has been close to flat even during this big down turn.
US has been roughly in the middle but has seen most selling pressure in recent weeks as spot ETF outflows have increased.
You can use this info when zooming in when to expect volatility during the day during specific periods. Often it's 1 of the trading sessions causing all the action in a specific time period.
27
22
118
7,457
Jun 12
$ETH Still watching for that range low retake before getting excited again.
Until then this is just another breakdown in a larger trend.
But I will say that the continuation down has so far been pretty lackluster, which is why I'm looking for a potential deviation and retake from the range as a possibility.
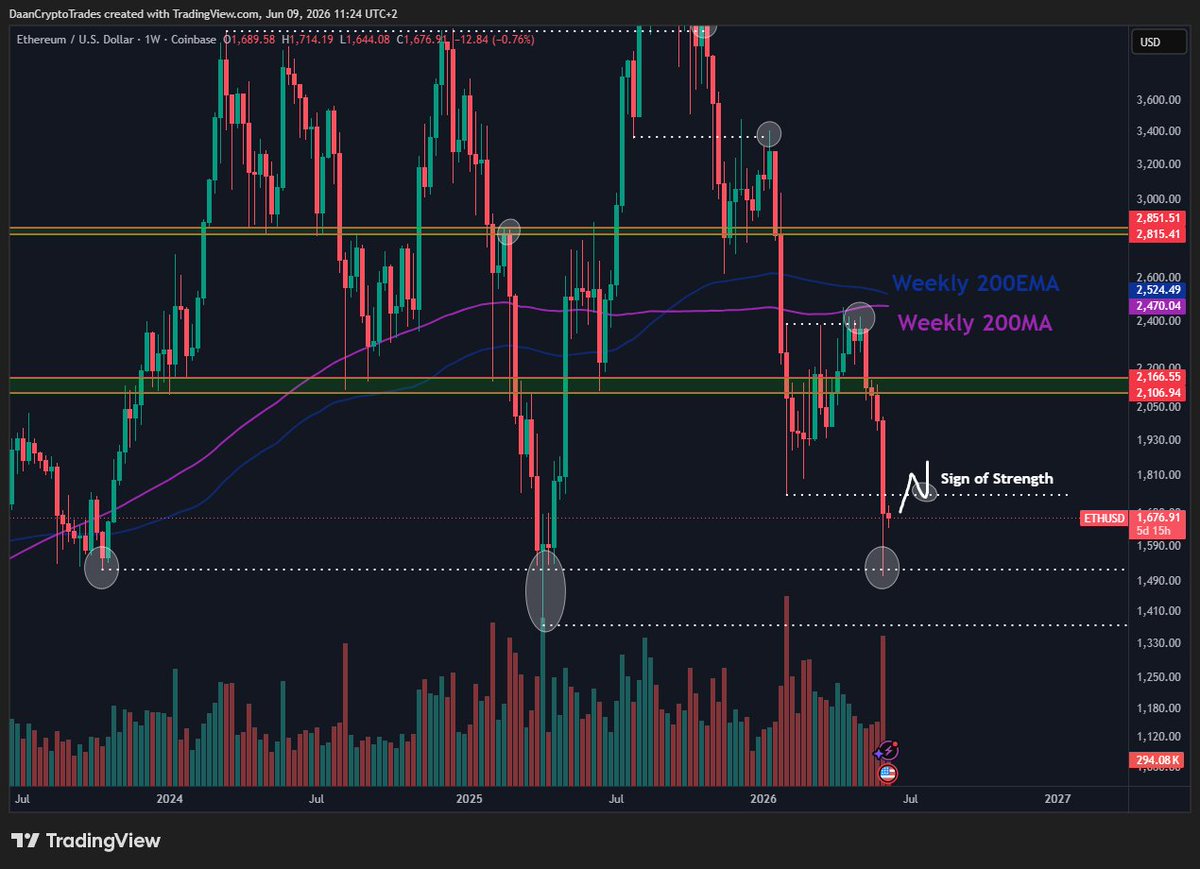
$ETH Good initial bounce and okay weekly close all things considered.
Bulls now need to retake $1750 to change the ongoing pattern of breakdowns, bearish retests and new lows.
I would consider retaking $1750 a sign of strength and would start targeting that major $2.1K area again.
Until then, this is still a bearish trend and $1500-$1750 is the range to watch.
36
54
196
20,566
Jun 11
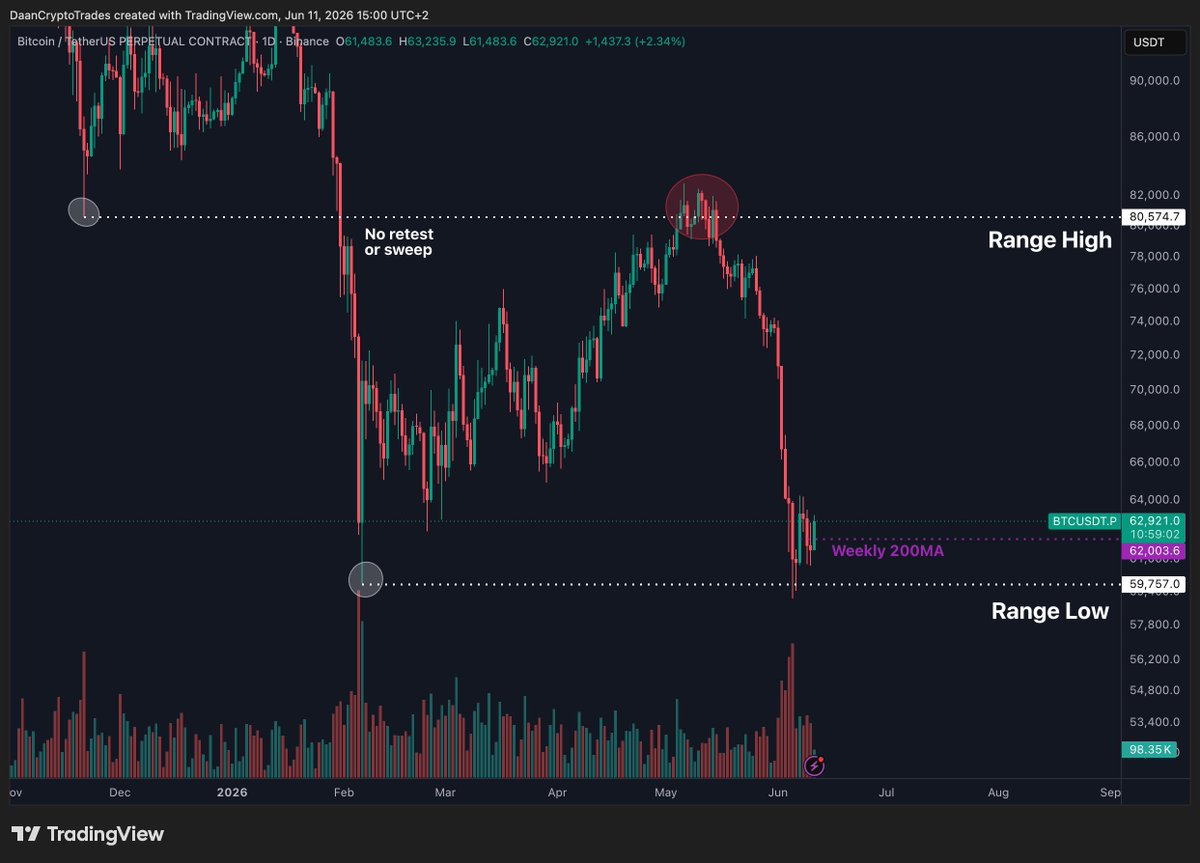
The Total Crypto Market Cap has swept its February low and has bounced slightly.
Yet, the down trend is still ongoing on the higher timeframe obviously.
It will be key to see if this current level will be held by the bulls, which coincides with the $60K level on $BTC.
In that case, we could be looking at the formation fo a larger range in between these two major horizontal regions.
40
68
159
10,248
Jun 11
$BTC Range to watch.
Bulls holding on to the $60K area and Weekly 200MA and now trying to get a bounce going.
Falling below that $60K area and the bigger down trend continues.
I said this before but will repeat it, I think the best thing to do is to just remain nimble. Don't get bearish near support, don't get bullish near resistance. Seems logical but usually emotions get in the way of many to actually act in that matter.
45
41
154
9,983
Jun 11
The Weekly RSI Heatmap of the top 100 coins is showing a big variety in levels.
Most majors sitting between the 30-40 mark which is pretty normal for a bear market/trend like this.
Outside of the top 10 or so we do have quite a bit of action with random coins moving up and down a lot.
But all in all, it's still a slow bleed down for the majority of the market and it will need $BTC (and ETH?) to lead the way out of this at some point.
18
22
69
6,669
Jun 11
The best setup in the world means nothing if your position size is wrong.
This will only end up with you getting hunted on your stop or wicked out before the actual move occurs.
You can technically be "right" but didn't give enough room for error which will still make your executing wrong and end up in losses.
More often than not, sizing lower and well managed, offers better returns in the long run.
27
3
82
7,944
Jun 10
$BTC vs S&P 500 has recently rejected from its Weekly 200MA which acted as resistance over the past few months.
It is now trading back at the level from the yen carry trade blow up wick during Summer 2024.
You could say BTC is at a relatively decent value area against stocks already but that doesn't mean this is a screaming buy straight away.
Slow accumulation over time is always the approach I personally take. Whether BTC bottoms around $60K, $50K or $40K, I just try to have some cash on the side and buy over time. Focus is a multiple year investment horizon as always.
55
24
167
10,447
Jun 10
$BTC Key level in the short term is the local high from this week.
That would confirm a higher low and higher high locally and likely mean this is due for further relief.
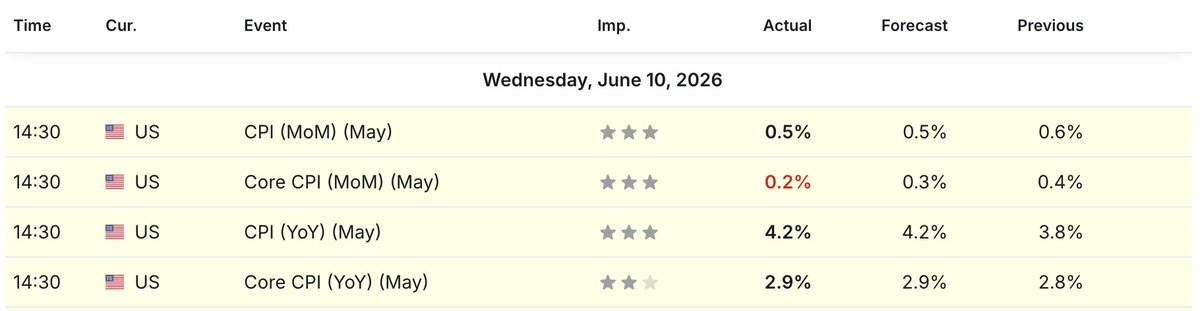
BTC is reacting well to today's inflation print and Trump's remarks relative to stocks so it's showing some minor signs of strength.
So far, the Weekly 200MA around $61.8K is also being held by the bulls.

53
31
166
10,754
Jun 10
Inflation data just came in slightly lower than expected.
Nothing major, still a high print but that was also what the estimates were saying.
As always, the most important thing is how the market reacts during the day. Especially during this volatile price action the past few days.
24
7
96
7,703
Jun 10
$BTC Most liquidity below has been taken.
Biggest clusters on the chart are sitting at ~$68K & $75K.
Obviously no guarantee price goes and visits those as BTC is in a down trend. But regardless, it can be good to watch these going forward if price does start grinding up close to them. Generally these big zones start acting as "magnets" for a liquidity grab at that point.
So while they are not that relevant yet, watch closely when price is slightly closer.

49
33
191
11,865