
Joined July 2018
- Tweets 7,219
- Following 156
- Followers 23,035
- Likes 8,053
2,044 Photos and videos


Pinned Tweet
FREE TOOLS!
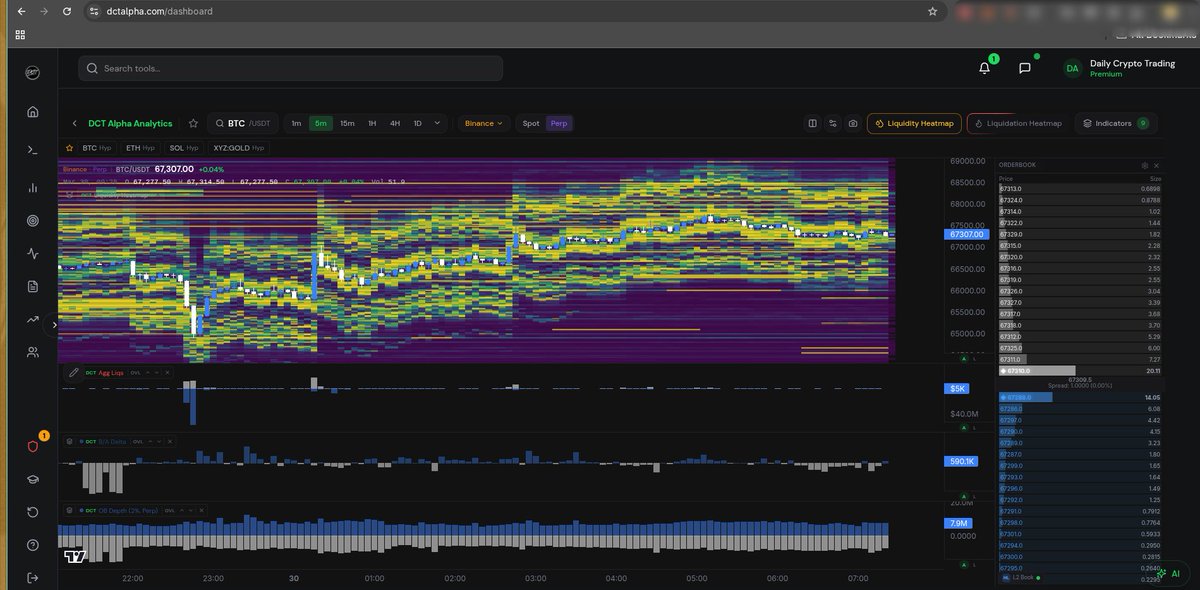
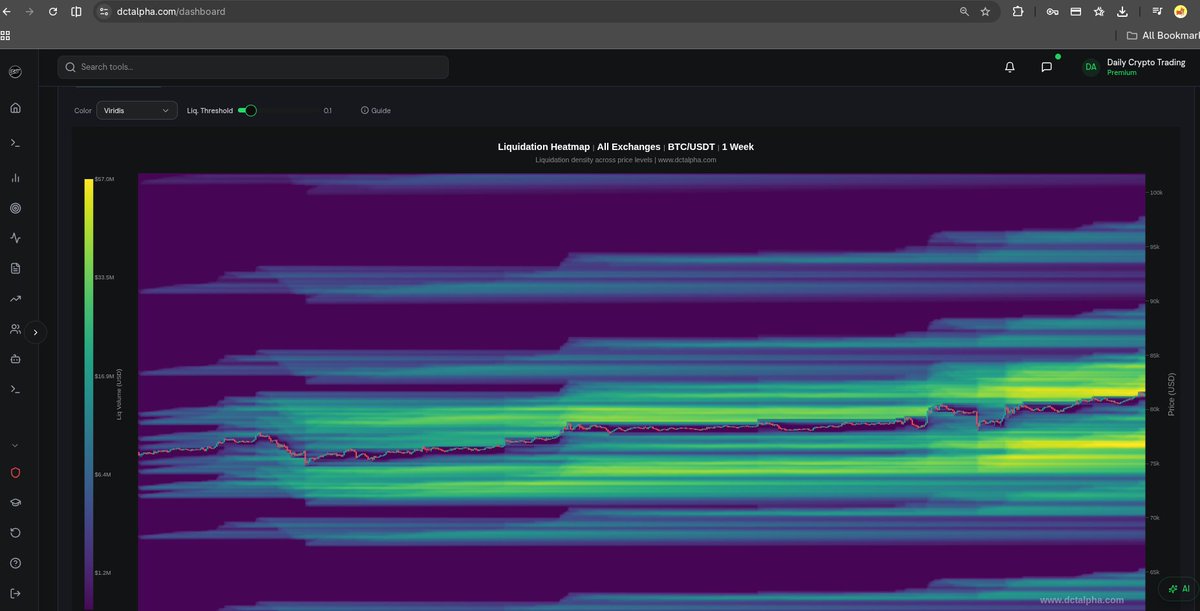
DCT Alpha Analytics V2 is now live with 140 trading tools, including 72 chart indicators, 48 dashboard analytics, and Alpha AI with 22 real-time data tools.
• Track 1,000 coins across 15 exchanges:
Binance, Bybit, OKX, Bitget, KuCoin, MEXC, Gate.io, HTX, BitMEX, Deribit, Bitfinex, CoinEx, Coinbase, plus Hyperliquid and Aster.
• Perpetuals, spot, and TradeFi markets, including Gold, Silver, Stocks, and Commodities.
All premium tools are free until April 3.
API access to our data for developers is coming soon.
Create a free account:
dctalpha.com/
Enjoy the tools? Give the post a like and repost it!
5
4
50
6,353
🚨 $BTC Long-Term Update: The Crash I Warned You About Is Here. Don't Catch It Mid-Air 🚨
We have accurately predicted every target since 2023. We nailed BTC at $43k, $50k, $60k, $73k, $48k, $82k, $89k, $99k, $125k, and back down to $60k 🎯. Nothing has changed in my long-term TA. The blow-off top I called for over a year, at $118-130k, printed at $126k in October 2025. I told you that once we went from $30k to $100k , we were nearing the top, and that after wave 5 a massive corrective would follow. We are in it now. I remain true to my analysis until it is invalidated.
I care about my community, not the noise. I do not get paid for these insights, they are my own opinions. Most so-called influencers are not traders, they sell you one bias and a VIP group. In this channel we have always shown different scenarios with different probabilities, and we have nailed every target. This is no different.
Macro Overview Recap:
Same backdrop I have posted since 2022. This is a liquidity and rates story, not hopium. Once traditional markets, especially the Nasdaq and S&P 500 tech complex, correct, Bitcoin follows. With FOMC now behind us and risk assets still heavy, BTC keeps trading like the high-beta tail of the market. Understanding the recession thesis is essential before reading the charts.
Bitcoin Charts Analysis:
Elliott Wave Theory:
My EW count has been spot-on since late 2023. The blow-off top is now behind us: wave 5 topped at $126k in October 2025, right inside the $118-130k zone I gave you well in advance. I am not changing the count because sentiment shifted. As I have always said, AFTER wave 5 completes we get a massive ABC corrective, not a dip you buy blindly. Wave A is dragging us into the demand region, then I expect a wave B relief rally back toward the supply region (the trap that turns everyone bullish again), before the impulsive wave C takes us lower. The demand and supply zones on the chart are short-term sub-wave detail inside this path, not the destination.
Targets stay where they have always been. This is the massive ABC corrective I have mapped since 2023, with Fibonacci targets at $52k and $31k before we find a bottom, and a full cycle low in the $25k-$38k band depending on the structure. A deeper $17k-$25k flush is only my extreme recession or black swan extension. Don't be surprised by sharp relief rallies along the way, they are corrective, not the reversal. This aligns with a recession-driven market decline, exactly as I warned.
Invalidation Points:
This scenario could be invalidated if:
1. Markets reset or correct cleanly over the next 1-2 years.
2. Geopolitical tensions or wars are avoided.
3. A recession is avoided (low probability).
4. No black swan event occurs. Structurally, the bearish count is wrong if we reclaim and HOLD back above the cycle-top structure in a clean impulsive five. Until then, every bounce is corrective. It is YOUR job to protect your capital
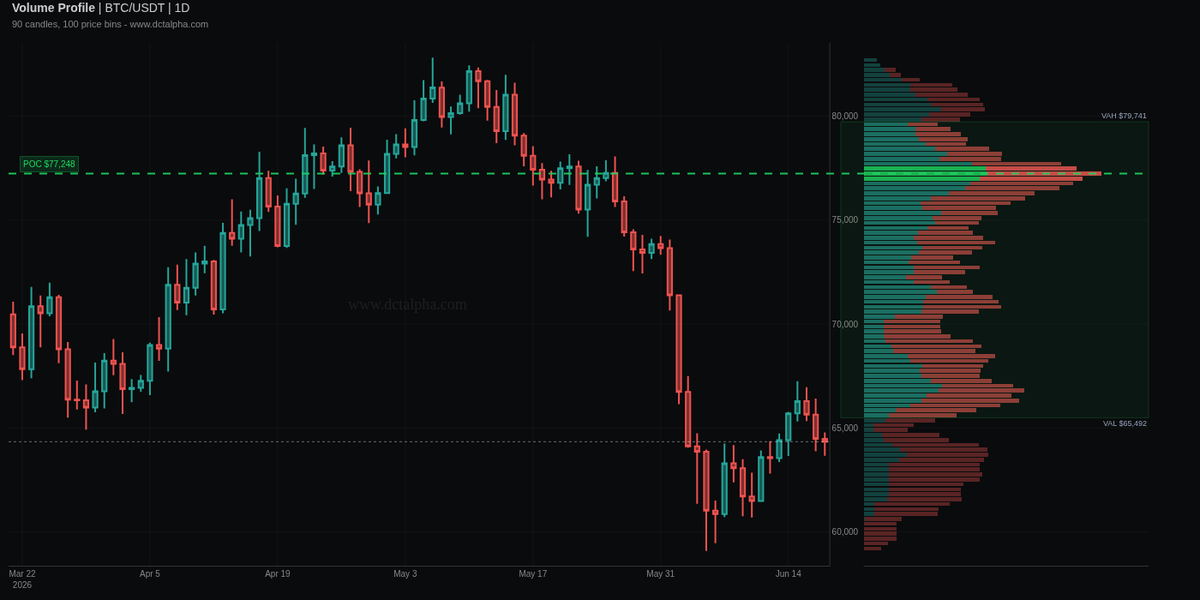
Weekly Chart:
• Structure: lower highs since the $126k top, price now compressing in the lower third of the range. Downtrend intact.
• RSI: 37.7, weak and pressing toward oversold, no bullish divergence yet.
• MACD: still below 0, printing an early bullish cross. Momentum is trying to turn from a low, not from strength.
Daily Chart:
• RSI: 43.5, still under the 50 pivot. Bulls have to reclaim it to change anything.
• MACD: bullish cross under 0, same story as the weekly.
• Range: 30-day high $77.6k, low $60.4k. We are leaning to the bottom
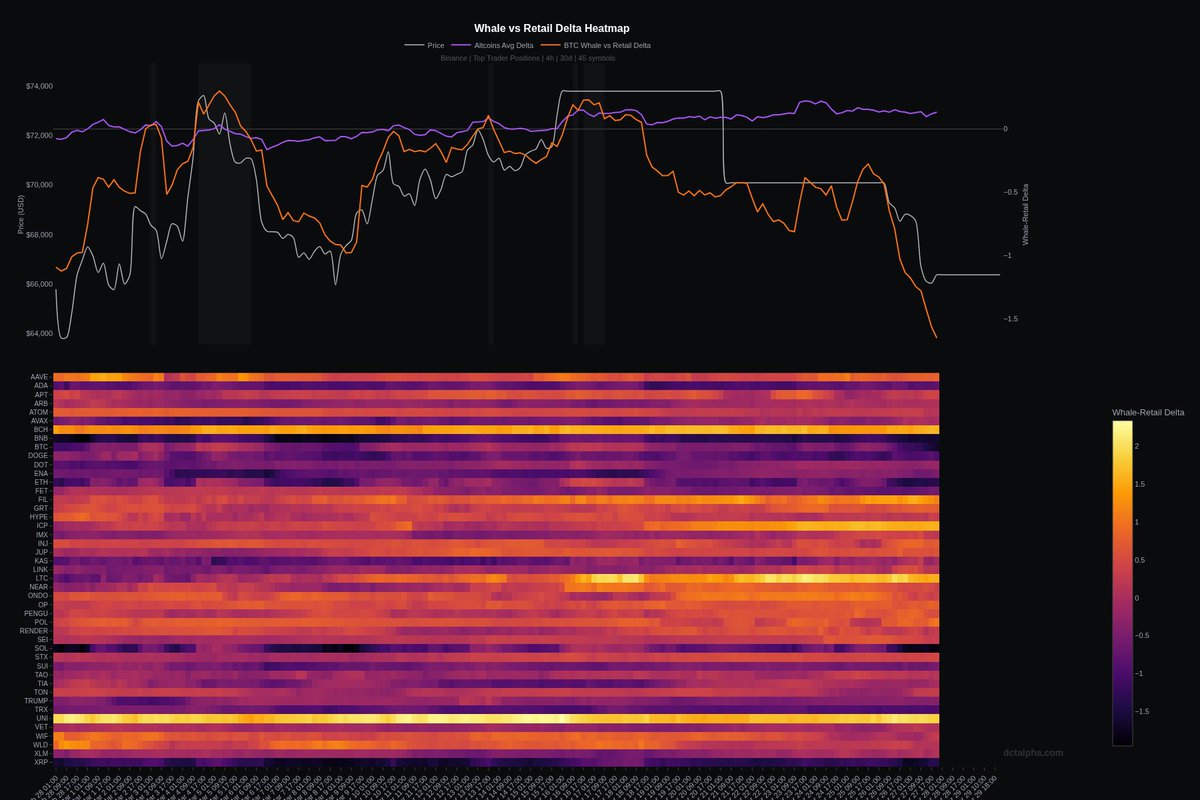
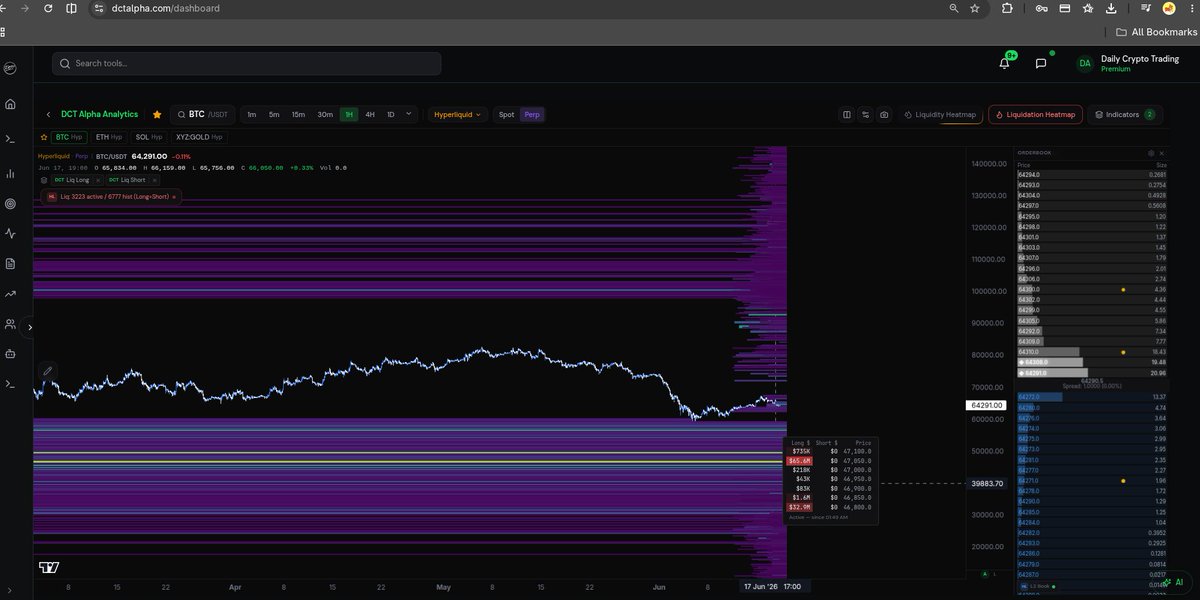
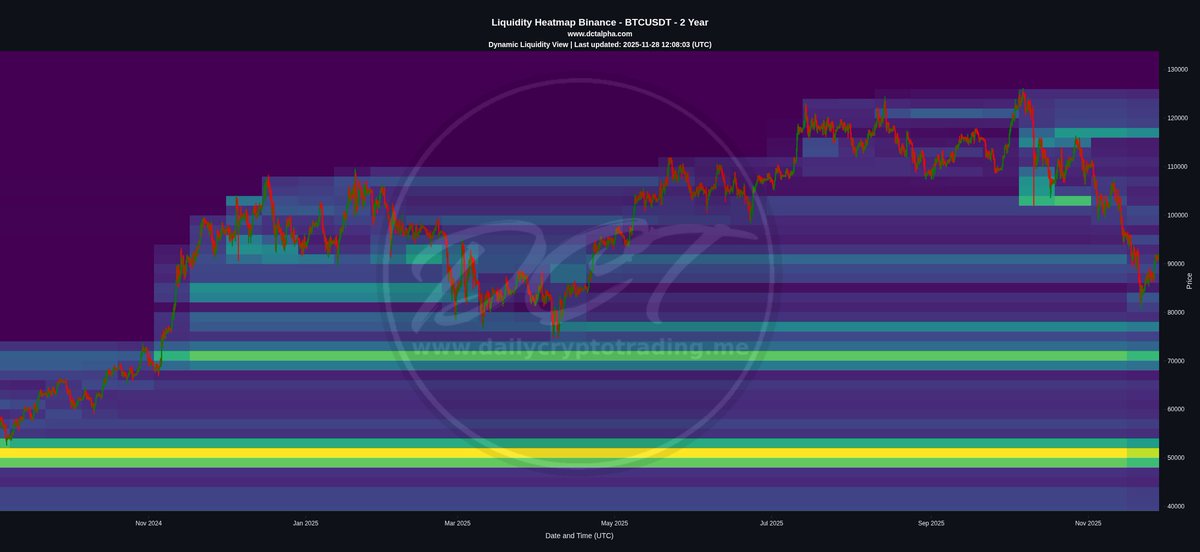
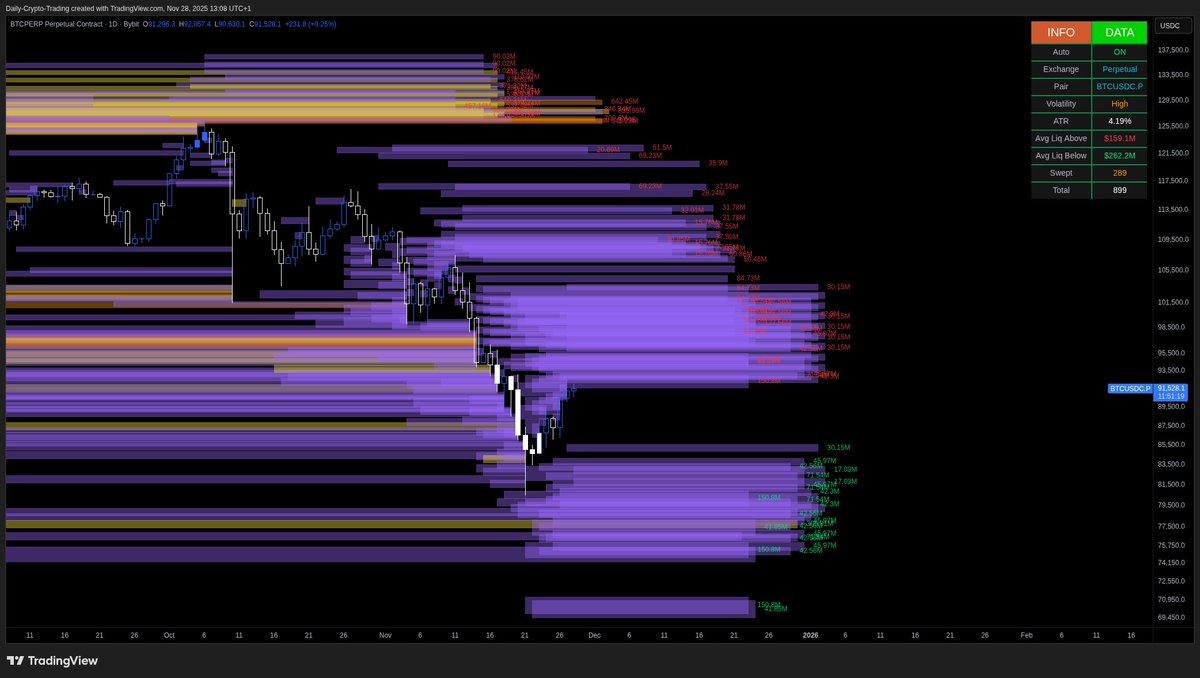
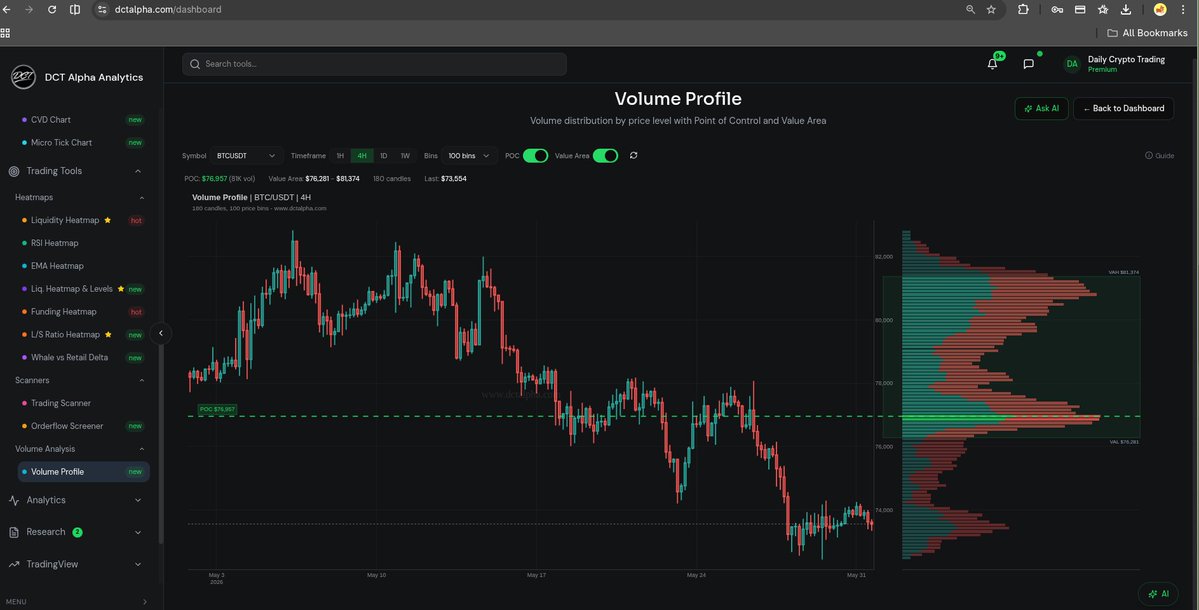
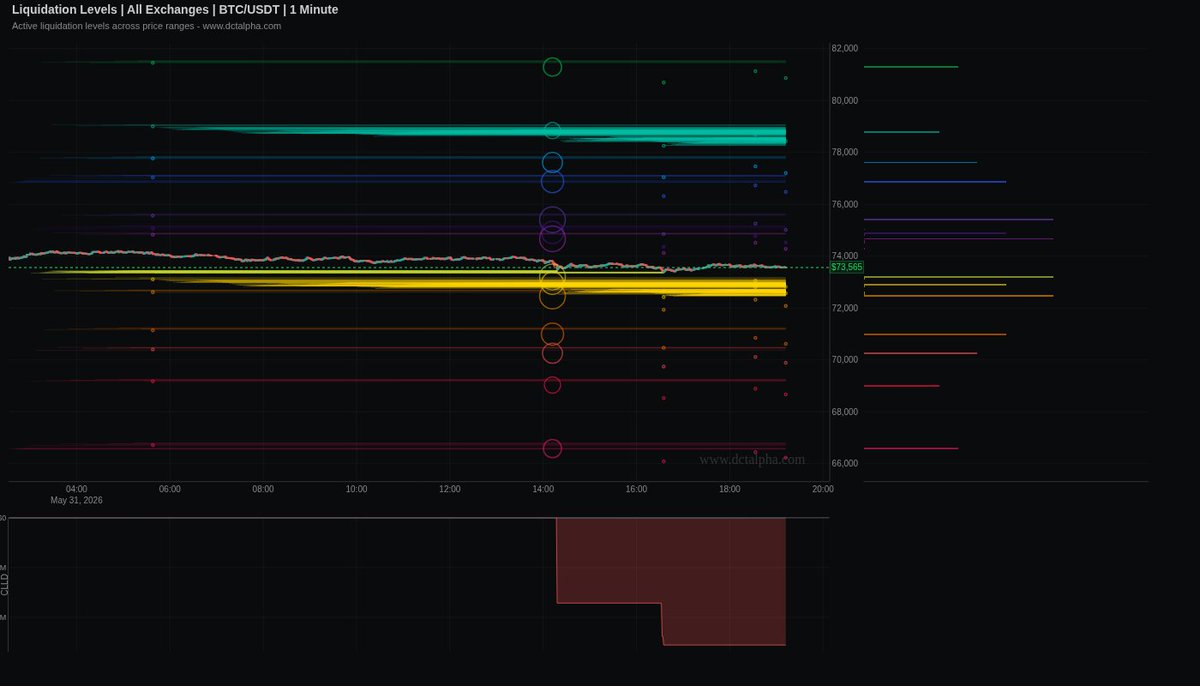
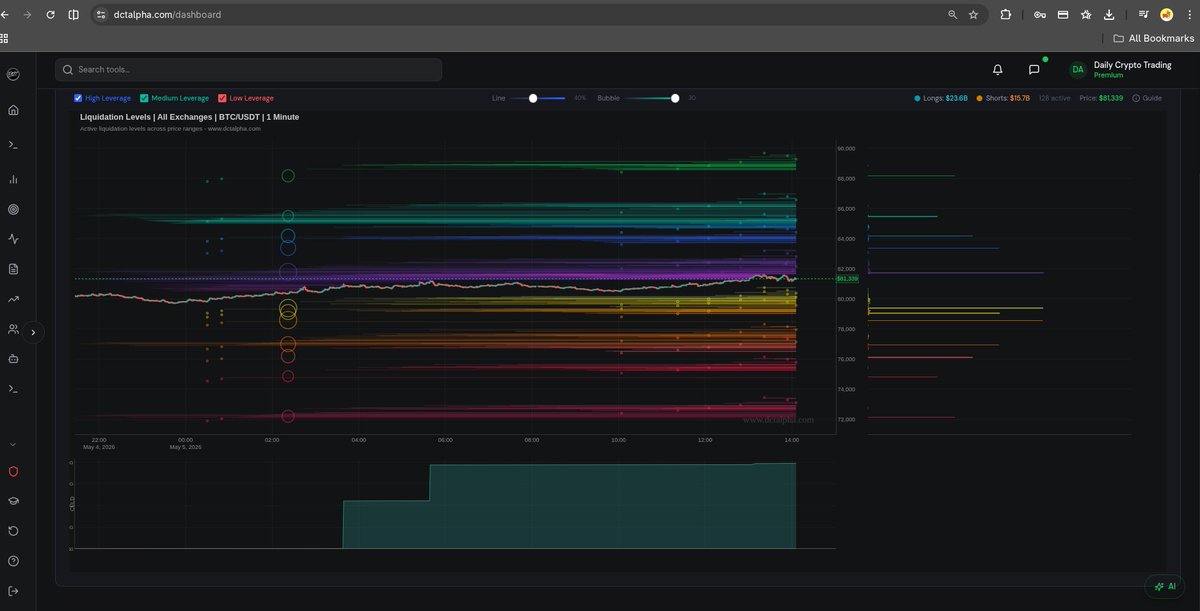
Liquidity and Liquidation Heatmap Insights:
This is the part nobody else shows you, straight from DCT Alpha data. The heaviest unfilled long-liquidation pools sit LOWER: a wall at $46-50k, with a nearer shelf at $58-60k. Hundreds of millions in leveraged longs parked there, and markets do not leave that liquidity untouched. It stays a magnet until it is tapped. Upside is thinner: $66-67k right above us as the first squeeze, then $69k, $75k, and a heavier $80k short pocket that lines up with the wave B supply region.
The divergence nobody is pricing in: sentiment is Extreme Fear (F&G: 15), but positioning is still net LONG (1.5 to 2.0 across exchanges), open interest is only now starting to bleed off ($7.0bn to $6.4bn in three days), and funding is roughly neutral. The de-risking has just started. The crowd feels bearish but has not actually washed out. That is the first leg of a flush, not the capitulation bottom.
Conclusion:
Along with traditional markets, I expect all risk assets to keep correcting. My macro view stands: the S&P 500 can drop 30-50% and BTC 70-80% from the top before we find a true bottom and real gains begin. The heavy liquidity is below, sentiment is fearful but positioning is not yet cleared, and the structure is a downtrend with relief bounces until proven otherwise. Follow the liquidity, not the emotion. The map is live in DCT Alpha (link in bio) if you want to read these levels yourself.
Real question for you: do we tap the $46-60k longs first, or does $69k break and squeeze the shorts? Drop your level
👇 I read and reply to the sharpest takes.
#bitcoin #recession

28 Nov 2025

🚨 Bitcoin - The Last Push Before The Crash 🚨
Time to do my long term updated $BTC TA!
We have absolutely nailed every major move since 2023, verified by Grok himself! All my record is in public without deleting a thing. Wave 5 is complete and ABC correction is playing out.
126k NAILED ✅ 🎯
We called the top and were YEARS ahead, and now everyone on CT gurus suddenly writes “I told you top was,” meanwhile deleting their post, while we HAVE updated our Elliott Wave or macro every month and everything is on record. If you’re a long time follower of mine you know this!
Anyway, what now? Did we reach the top, the final blow-off top? The probability is quite high even though I don’t run with guarantees. The probability is high but let’s dive into the charts.
If you value my free work, bookmark, repost, like, and comment to keep this channel alive. Free alpha. No guarantees. Pure probabilities.
Read my post “BTC Macro Structure: The 3 Weekly Levels That Decide Bear Market or Not”
x.com/DailyCryptoTrad/status…
Elliott Wave Theory
Structure did what we expected:
• Extended impulsive Wave 1
• Wave 3 tagged into the July ATH
• Corrective Wave 4 unfolded in a clean ABC
• Final sub wave of Wave 5 completed
• Last time I wrote “Now forming an ABC correction on the weekly and daily. Seems like we might’ve found our A wave at 99k, but that’s not confirmed until the weekly close. Typically we’ll move up toward Wave B around 109k, 112k, and 116k.” This got invalidated since we did not bottom out and had a weekly close above 99k. However it seems we found our local bottom at 80k which means this is our Wave A. This means we will move up towards weekly Wave B with a price target of 109k. If we pierce through, 112k is possible. Fib level 1.618 is on 109k.
• On daily we’ve found our Wave C and now moving towards a sub wave 5 which aligns with our weekly EW (Wave B).
• From my June map, 109k had to flip to support, and it did. New ATH printed, followed by a 22% correction.
Targets
• Primary 120–130k (1.618) REACHED 🎯
• New targets (if weekly confirms) 109k, and if pierced through, 112k
Technical Indicators
Weekly
• Volume: volume up while price down is typically bullish. However, comparing April to now, volume down while price up is bearish. Short term we could see upside, but long term we’re nearing a squeeze.
• RSI: below 50, weak for bulls. But at 39 we could retest 50.
• Stoch: oversold, could move to the upside.
• MACD: still above zero, but downside momentum is strong.
Daily
• RSI: below 50 but moving up. If it breaks through, that’s bullish.
• Stoch: bullish cross moving up.
• MACD: crossing below 0 is bearish, showing we’re in a downtrend but could make local highs.
• Volume: volume down while price is up is a bearish signal.
Charting shows some bullish signs with a good probability of hitting EW targets.
Invalidation comes if we break 116k, that would mean the downtrend is broken.
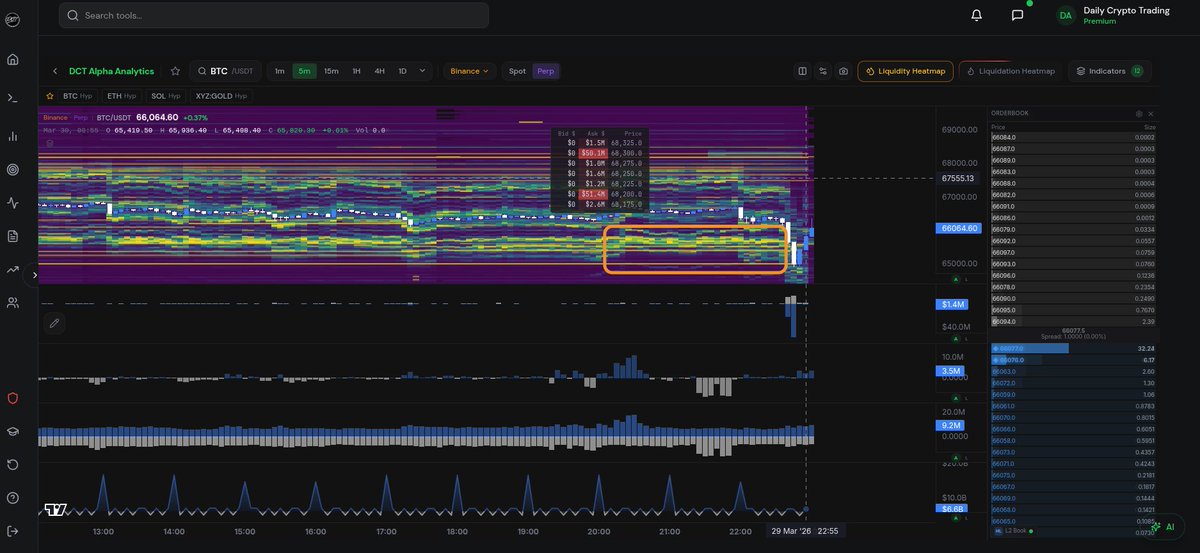
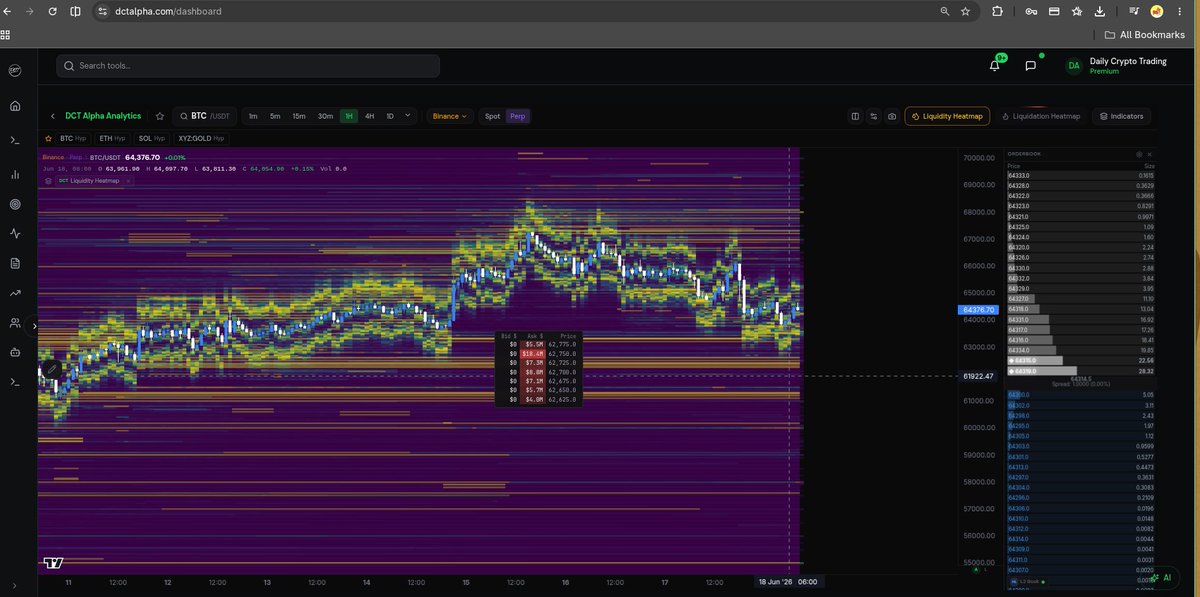
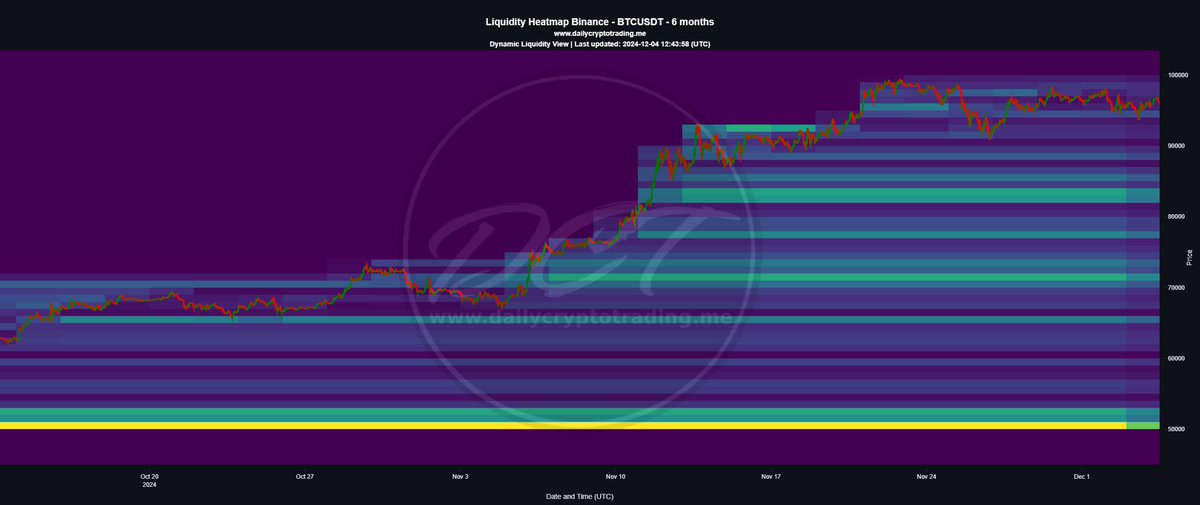
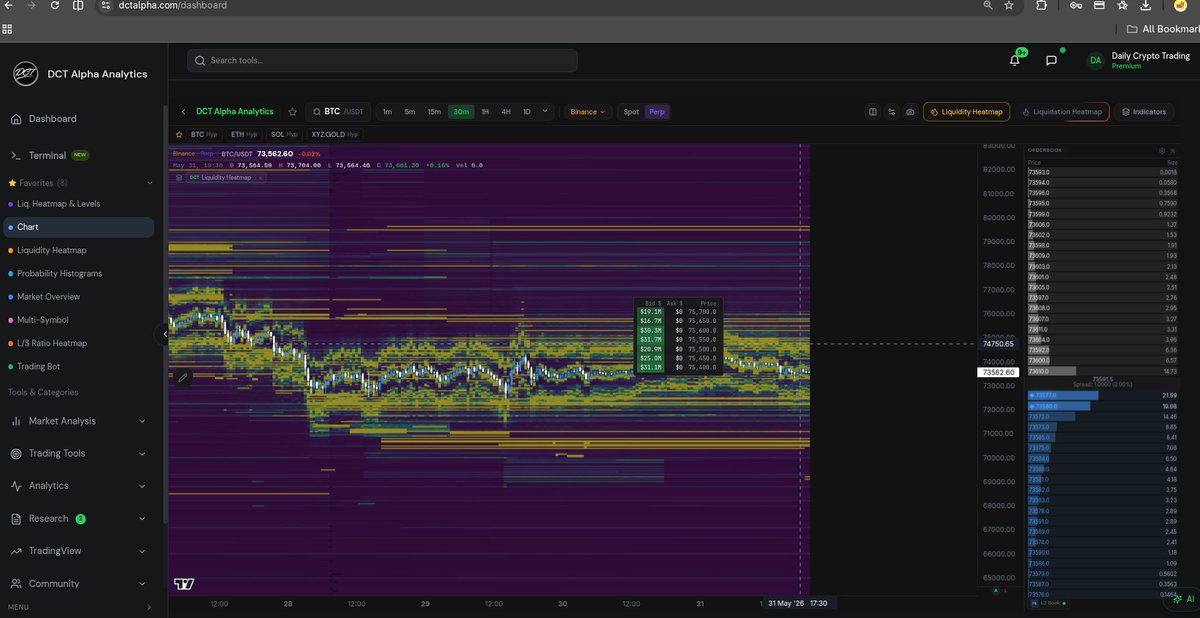
Liquidity and Heatmaps
Our liquidity heatmap shows strong liquidity at both lower and higher ranges, indicating a quick sweep to upper levels before a larger correction.
This aligns with our TA that we’ll likely get a push before the big drop.
You can use our liquidity and liquidation heatmap on my site (link in profile or comments).
Conclusion
If you’re an old G and follower I sound like a broken record, but my conclusion is and will still be the same since 2023, and this is more for the new people reading this.
If you’ve been following my long term TA, it’s still playing out beautifully. Here’s a quote from last time:
“We are getting ready for the last rally and a top in Q4 before year end.
With stagflation and a slowing economy, the jobless data shows clear weakness.
We are still in a great melt up, but it’s only a matter of time.
Markets tend to crash 3–6 months before a recession becomes official.
BTC follows traditional markets. Remember COVID: BTC fell 68% on lockdown fear without a formal recession.
This is still the Wave 5 I mapped out in 2023.
We got the ATH, held key support, and now line up for the last push.
120–130k stays the base case, 135–145k the extension, 170k is the euphoria outlier, only valid if sustained.
After the move completes, remember what I’ve said since day one:
Bitcoin corrects 70–90% in cycles. Not a new paradigm. Not ‘this time is different.’ Protect your capital. No one else will.”
We saw a sharp drop due to a deleveraging event. Many were too bullish and lacked proper risk management.
When markets get over-leveraged and overconfident, they get punished.
We usually see these deleverage events before a small rally, a dead cat bounce.
If everything follows the plan, we could reach targets 109k which aligns with our daily and weekly EW (weekly Wave B target) and could pierce through and touch 112k, tricking retail to believe we’re moving up again before the real drop. So there is high probability we topped out at 126k
Now the important part:
The FED will likely start QE. Typically, not always, assets go up to hedge against inflation and de-dollarization.
But in 2009 when QE started, markets crashed during the recession.
That scenario can happen again, so stay open minded and probabilistic.
Don’t count on guarantees, that’s how people get liquidated.
Manage your risk like a professional.
We’re not here to look smart, we’re here to get paid.


8
10
50
3,420
I did not change my stance. I cared about my community then, and I still care about my community today.
I have never been paid for sharing my insights. I have been called every name in the book, ridiculed, mocked, and even had large influencers go out of their way to attack my TA.
None of that changed anything.
I am, and always will be, true to my community and true to myself. I will never change my analysis just because it becomes unpopular. I follow the charts, the data, and my convictions, not the crowd.
Whether people agree with me or not is their choice. My job has always been to share what I genuinely see in the market, and that is exactly what I will continue to do.. $BTC
4 Dec 2024
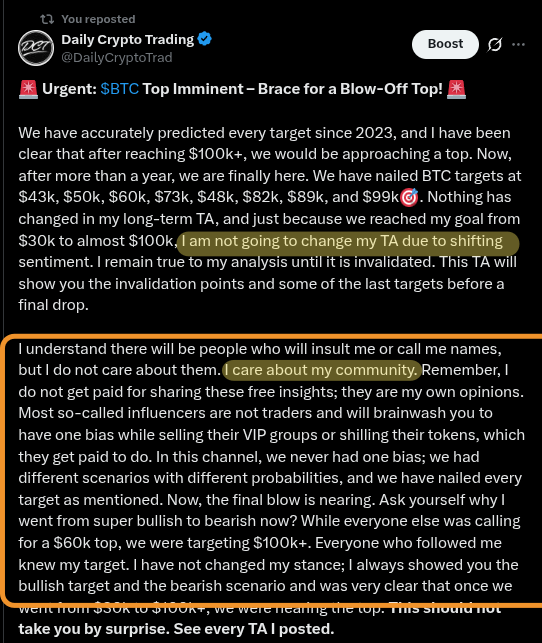
🚨 Urgent: $BTC Top Imminent – Brace for a Blow-Off Top! 🚨
We have accurately predicted every target since 2023, and I have been clear that after reaching $100k , we would be approaching a top. Now, after more than a year, we are finally here. We have nailed BTC targets at $43k, $50k, $60k, $73k, $48k, $82k, $89k, and $99k🎯. Nothing has changed in my long-term TA, and just because we reached my goal from $30k to almost $100k, I am not going to change my TA due to shifting sentiment. I remain true to my analysis until it is invalidated. This TA will show you the invalidation points and some of the last targets before a final drop.
I understand there will be people who will insult me or call me names, but I do not care about them. I care about my community. Remember, I do not get paid for sharing these free insights; they are my own opinions. Most so-called influencers are not traders and will brainwash you to have one bias while selling their VIP groups or shilling their tokens, which they get paid to do. In this channel, we never had one bias; we had different scenarios with different probabilities, and we have nailed every target as mentioned. Now, the final blow is nearing. Ask yourself why I went from super bullish to bearish now? While everyone else was calling for a $60k top, we were targeting $100k . Everyone who followed me knew my target. I have not changed my stance; I always showed you the bullish target and the bearish scenario and was very clear that once we went from $30k to $100k , we were nearing the top. This should not take you by surprise. See every TA I posted.
Before diving in, I’d appreciate your support with likes, reposts, and comments to help grow the channel and keep this content coming. These analyses take time, and your appreciation fuels the drive to keep sharing!
Macro Overview Recap:
If you haven’t already, check out my macro analysis on the inevitable recession. Understanding this is essential before diving into the charts.
Recession:
x.com/DailyCryptoTrad/status…
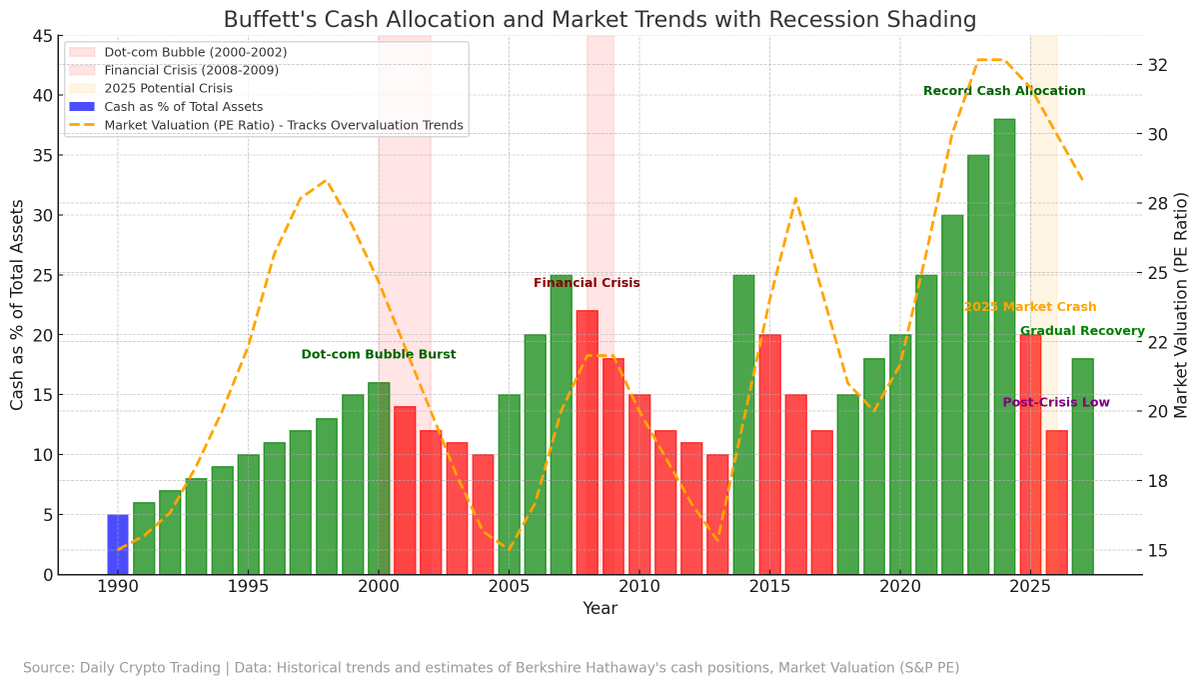
Warren Buffet's Cash Pile:
x.com/DailyCryptoTrad/status…
Bitcoin Charts Analysis:
Elliott Wave Theory:
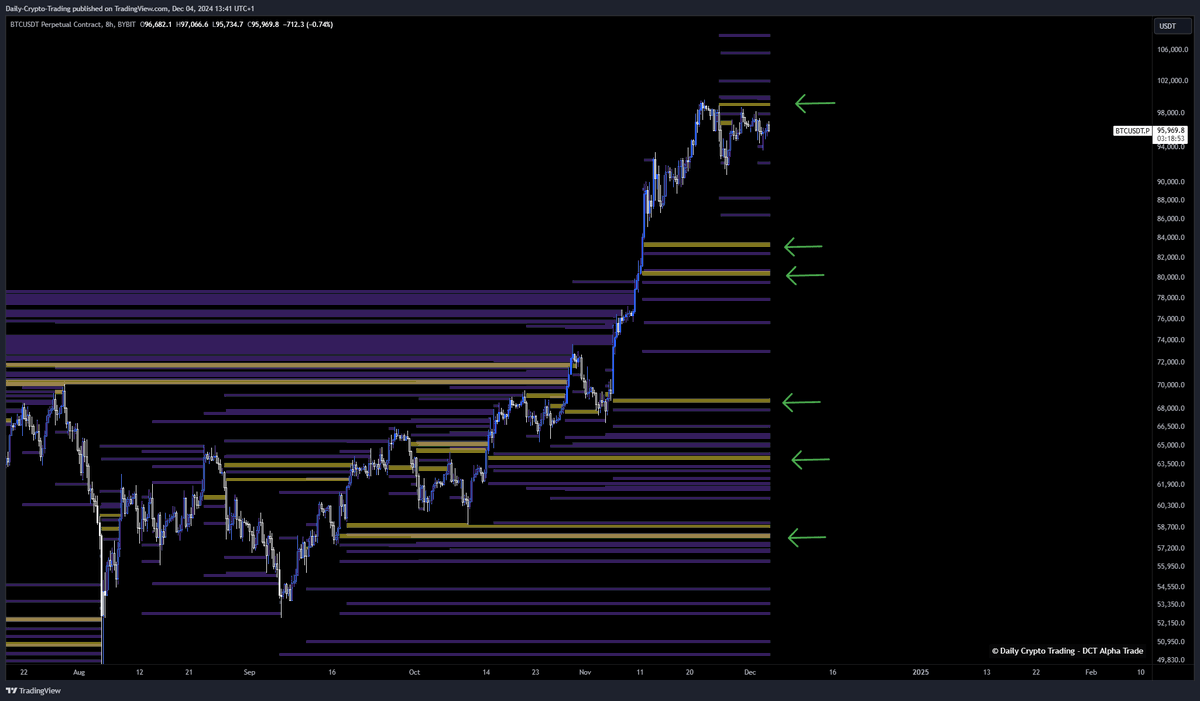
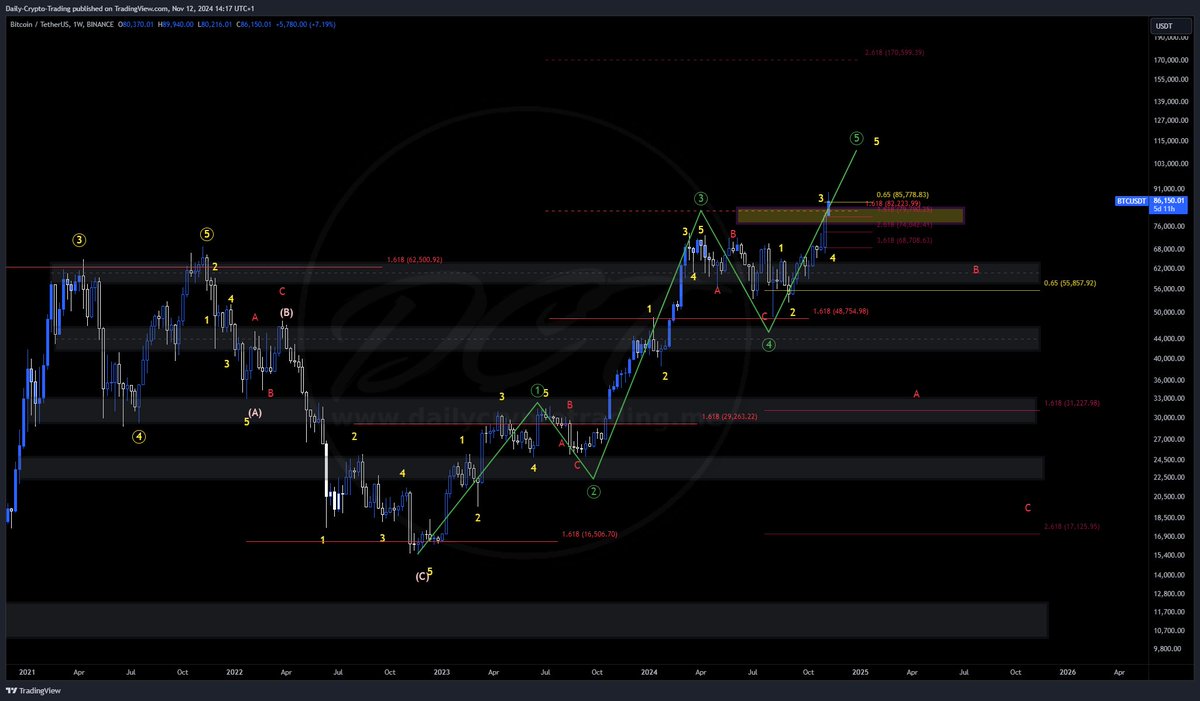
My Elliott Wave (EW) analysis has been spot-on since late 2023 and hit all targets. However, I am recounting sub-wave 5 since the structure has changed. We have an impulsive wave 3 which is overextended and losing momentum. This does not mean we cannot reach $100k , but we need to stay cautious. We need our pullback to sub-wave 4 around $75k-$81k to hold (Fibonacci level shows $84k-$80k). Once we complete wave 4, we have our last impulsive wave, meaning there is still some fuel left. We can sometimes form truncated waves, which means wave 4 won’t reach wave 5 or hit the old ATH and make a double top. But if we get a strong wave 5, we could see a 40-50% increase from the $80k level, reaching Fibonacci levels of 3.272 at $113k, 3.414 at $117k, and 3.618 at $121k. This would be the best-case scenario. The invalidation point is if we go over $130k; then, this gets invalidated, and a potential target at $170k can be reached, but we need structure to confirm this first.
Once traditional markets, especially the Nasdaq and S&P 500 tech stocks, correct, Bitcoin is likely to follow, leading to a blow-off top as mentioned. At that point, BTC could drop to $17k-$30k, depending on the peak. This would form a massive ABC corrective pattern with Fibonacci targets at $52k and $31k before finding a bottom. This scenario aligns with a recession-driven market decline.
Invalidation Points:
This scenario could be invalidated if:
1. Markets reset/correct after 1-2 years.
2. Geopolitical tensions or wars are avoided.
3. A recession is avoided.
4. No black swan events occur.
However, if even one of these factors plays out, a market crash becomes highly probable. Be open-minded about these possibilities; ultimately, it is YOUR job to protect your capital.
Weekly Chart:
• Volume: Low volume while price action is increasing – bearish signal.
• RSI: Overbought, showing a bearish divergence since April. This is a high probability given the overbought zone but could be invalidated if RSI reaches 90.
• RSI Stochastic: Overbought but can remain so for up to a month.
• MACD: Bullish momentum but losing its momentum, bullish cross, and lines above 0 are also bullish.
All indicators suggest BTC is gearing up for a blow-off top, but there is still some fuel left.
Daily Chart:
RSI: Consolidating and above 50 – bullish.
RSI Stochastic: Oversold – bullish.
MACD: Bearish momentum, bearish cross, lines above 0 bullish.
Volume: Weak – bearish.
The daily chart suggests a need for consolidation and finding solid support before another move up. A retracement is likely, aligning with our Elliott Wave (sub-Wave 4) expectation. We are getting overextended.
Liquidity and Liquidation Heatmap Insights:
Our liquidity and liquidation heatmaps on TradingView reinforce this outlook, showing significant liquidity pools aligning with our targets. Access the same tools at Daily Crypto Trading.
Conclusion:
Based on my analysis, I firmly believe that BTC is approaching a top, with a likely range of $100k-$120k, especially if the Nasdaq and S&P 500 also peak. This outlook has been consistent since late 2023 and is supported by our Elliott Wave analysis and broader market trends.
However, several factors could disrupt this trajectory:
• Recession: As previously discussed, an economic downturn could align with a traditional market correction, significantly impacting BTC.
• Geopolitical Changes: Major shifts in global politics could introduce volatility, affecting market sentiment and BTC's price.
• Black Swan Events: Unforeseen events can always change market outcomes, as seen in past sudden market shifts.
• Market Shifts: Significant moves in traditional markets, such as those driven by geopolitical tensions or policy changes, could impact BTC.
if we avoid these factors, BTC has the potential to reach as high as $170k, as indicated by our Elliott Wave projections. The strong correlation between BTC and the tech sector suggests that a blow-off top is likely, especially with the current market boost from the "Trump Pump" driven by election cycles. However, potential trade wars or rate cuts could complicate this scenario.
In summary, while BTC could reach new highs, managing risk is crucial. The market is full of probabilities, not certainties. Although our targets have been accurate so far, future outcomes are never guaranteed. This analysis is meant to guide your understanding, but always verify and strategize based on your own judgment. #bitcoin #recession

3
22
1,697
Daily Crypto Trading retweeted

4 Dec 2024
🚨 Urgent: $BTC Top Imminent – Brace for a Blow-Off Top! 🚨
We have accurately predicted every target since 2023, and I have been clear that after reaching $100k , we would be approaching a top. Now, after more than a year, we are finally here. We have nailed BTC targets at $43k, $50k, $60k, $73k, $48k, $82k, $89k, and $99k🎯. Nothing has changed in my long-term TA, and just because we reached my goal from $30k to almost $100k, I am not going to change my TA due to shifting sentiment. I remain true to my analysis until it is invalidated. This TA will show you the invalidation points and some of the last targets before a final drop.
I understand there will be people who will insult me or call me names, but I do not care about them. I care about my community. Remember, I do not get paid for sharing these free insights; they are my own opinions. Most so-called influencers are not traders and will brainwash you to have one bias while selling their VIP groups or shilling their tokens, which they get paid to do. In this channel, we never had one bias; we had different scenarios with different probabilities, and we have nailed every target as mentioned. Now, the final blow is nearing. Ask yourself why I went from super bullish to bearish now? While everyone else was calling for a $60k top, we were targeting $100k . Everyone who followed me knew my target. I have not changed my stance; I always showed you the bullish target and the bearish scenario and was very clear that once we went from $30k to $100k , we were nearing the top. This should not take you by surprise. See every TA I posted.
Before diving in, I’d appreciate your support with likes, reposts, and comments to help grow the channel and keep this content coming. These analyses take time, and your appreciation fuels the drive to keep sharing!
Macro Overview Recap:
If you haven’t already, check out my macro analysis on the inevitable recession. Understanding this is essential before diving into the charts.
Recession:
x.com/DailyCryptoTrad/status…
Warren Buffet's Cash Pile:
x.com/DailyCryptoTrad/status…
Bitcoin Charts Analysis:
Elliott Wave Theory:
My Elliott Wave (EW) analysis has been spot-on since late 2023 and hit all targets. However, I am recounting sub-wave 5 since the structure has changed. We have an impulsive wave 3 which is overextended and losing momentum. This does not mean we cannot reach $100k , but we need to stay cautious. We need our pullback to sub-wave 4 around $75k-$81k to hold (Fibonacci level shows $84k-$80k). Once we complete wave 4, we have our last impulsive wave, meaning there is still some fuel left. We can sometimes form truncated waves, which means wave 4 won’t reach wave 5 or hit the old ATH and make a double top. But if we get a strong wave 5, we could see a 40-50% increase from the $80k level, reaching Fibonacci levels of 3.272 at $113k, 3.414 at $117k, and 3.618 at $121k. This would be the best-case scenario. The invalidation point is if we go over $130k; then, this gets invalidated, and a potential target at $170k can be reached, but we need structure to confirm this first.
Once traditional markets, especially the Nasdaq and S&P 500 tech stocks, correct, Bitcoin is likely to follow, leading to a blow-off top as mentioned. At that point, BTC could drop to $17k-$30k, depending on the peak. This would form a massive ABC corrective pattern with Fibonacci targets at $52k and $31k before finding a bottom. This scenario aligns with a recession-driven market decline.
Invalidation Points:
This scenario could be invalidated if:
1. Markets reset/correct after 1-2 years.
2. Geopolitical tensions or wars are avoided.
3. A recession is avoided.
4. No black swan events occur.
However, if even one of these factors plays out, a market crash becomes highly probable. Be open-minded about these possibilities; ultimately, it is YOUR job to protect your capital.
Weekly Chart:
• Volume: Low volume while price action is increasing – bearish signal.
• RSI: Overbought, showing a bearish divergence since April. This is a high probability given the overbought zone but could be invalidated if RSI reaches 90.
• RSI Stochastic: Overbought but can remain so for up to a month.
• MACD: Bullish momentum but losing its momentum, bullish cross, and lines above 0 are also bullish.
All indicators suggest BTC is gearing up for a blow-off top, but there is still some fuel left.
Daily Chart:
RSI: Consolidating and above 50 – bullish.
RSI Stochastic: Oversold – bullish.
MACD: Bearish momentum, bearish cross, lines above 0 bullish.
Volume: Weak – bearish.
The daily chart suggests a need for consolidation and finding solid support before another move up. A retracement is likely, aligning with our Elliott Wave (sub-Wave 4) expectation. We are getting overextended.
Liquidity and Liquidation Heatmap Insights:
Our liquidity and liquidation heatmaps on TradingView reinforce this outlook, showing significant liquidity pools aligning with our targets. Access the same tools at Daily Crypto Trading.
Conclusion:
Based on my analysis, I firmly believe that BTC is approaching a top, with a likely range of $100k-$120k, especially if the Nasdaq and S&P 500 also peak. This outlook has been consistent since late 2023 and is supported by our Elliott Wave analysis and broader market trends.
However, several factors could disrupt this trajectory:
• Recession: As previously discussed, an economic downturn could align with a traditional market correction, significantly impacting BTC.
• Geopolitical Changes: Major shifts in global politics could introduce volatility, affecting market sentiment and BTC's price.
• Black Swan Events: Unforeseen events can always change market outcomes, as seen in past sudden market shifts.
• Market Shifts: Significant moves in traditional markets, such as those driven by geopolitical tensions or policy changes, could impact BTC.
if we avoid these factors, BTC has the potential to reach as high as $170k, as indicated by our Elliott Wave projections. The strong correlation between BTC and the tech sector suggests that a blow-off top is likely, especially with the current market boost from the "Trump Pump" driven by election cycles. However, potential trade wars or rate cuts could complicate this scenario.
In summary, while BTC could reach new highs, managing risk is crucial. The market is full of probabilities, not certainties. Although our targets have been accurate so far, future outcomes are never guaranteed. This analysis is meant to guide your understanding, but always verify and strategize based on your own judgment. #bitcoin #recession
12 Nov 2024
🚨 Blow-Off Top Brewing in $BTC 🚨
We’ve nailed every target since late 2023: $43k, $50k, $60k, $73k, $48k, $82k, and $89k 🎯all hit with precision. Our patience has paid off, and I’m about to share even more valuable insights others won’t, because they want to capitalize on them themselves! This breakdown includes multiple scenarios, my opinions, data, and key invalidation points. 📊
Before diving in, I’d appreciate your support like, repost, and comment to help grow the channel and keep this content coming. These analyses take time, and your appreciation fuels the drive to keep sharing! 🙏
Macro Overview Recap:
If you haven’t already, check out my macro analysis on the inevitable recession. Understanding this is essential before diving into the charts.
Bitcoin Charts Analysis:
Elliott Wave Theory:
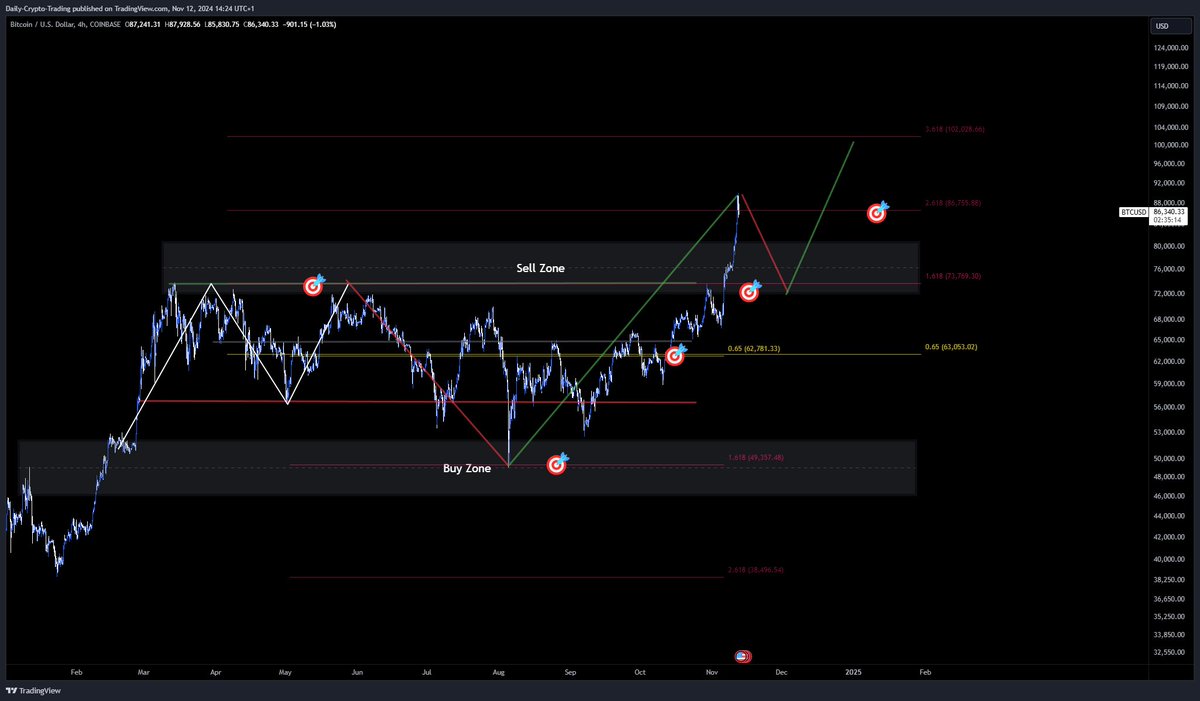
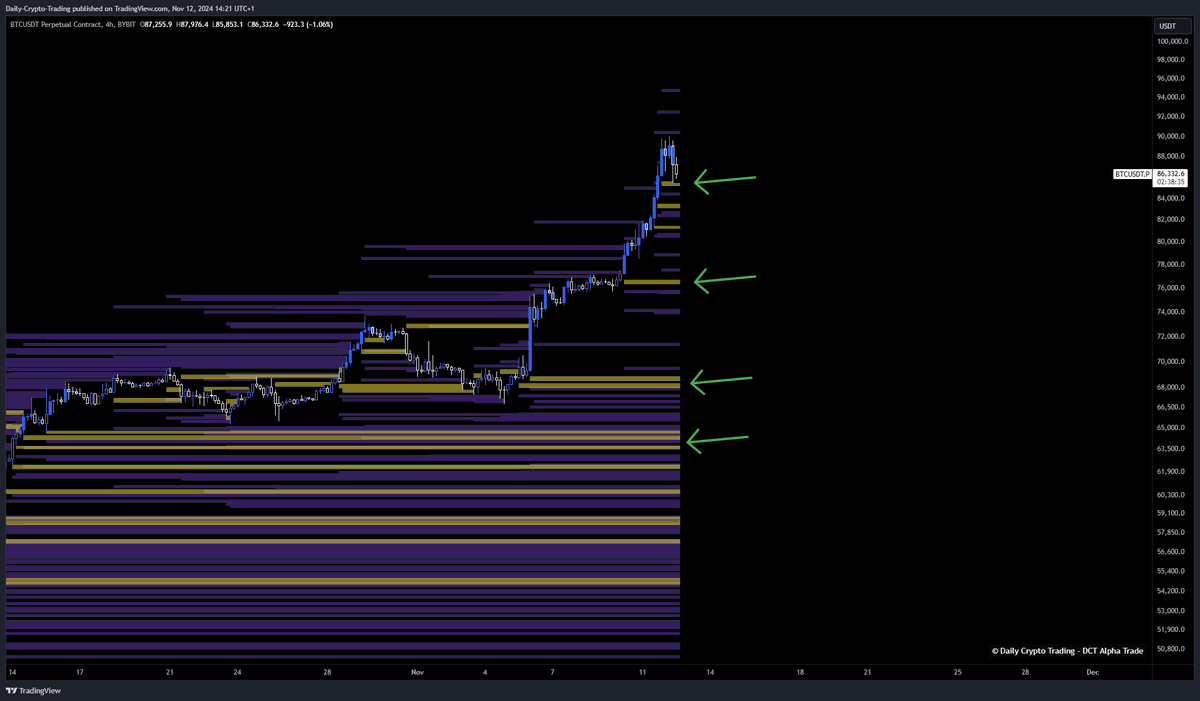
Our Elliott Wave (EW) analysis has been spot-on. We completed Wave 4 with an ABC corrective structure and entered a final impulsive wave (Wave 5), initially targeting $82k–$86k, hitting $89k as expected. We’re now meeting resistance around $89k–$90k, and need a sub-corrective wave within Wave 5, likely dipping to $68k–$73k based on Fibonacci levels. Don’t be surprised by a drop to $65k as a brief shakeout before the final pump to complete Wave 5. There’s also potential for BTC to hit $170k based on the 2.618 Fibonacci level we identified last year, though more structure is needed to confirm this.
Once traditional markets, especially the Nasdaq and S&P 500 tech stocks, correct, Bitcoin is likely to follow, leading to a blow-off top. At that point, BTC could drop to $17k–$25k, depending on the peak. This would form a massive ABC corrective pattern with Fibonacci targets at $55k and $31k before finding a bottom. This scenario aligns with a recession-driven market decline.
Invalidation Points:
This scenario could be invalidated if:
1. Markets reset/correct after 1-2 years.
2. Geopolitical tensions or wars are avoided.
3. A recession is avoided.
4. No black swan events occur.
However, if even one of these factors plays out, a market crash becomes highly probable.
Weekly Chart:
• Volume: Medium and consolidating - bullish signals emerging.
• RSI: Overbought, showing a bearish divergence since April. This is a high probability given the overbought zone but could be invalidated if RSI reaches 90.
• RSI Stochastic: Overbought but can remain so for up to a month.
• MACD: Bullish momentum, bullish cross, and lines above 0 are also bullish.
All indicators suggest BTC is gearing up for a blow-off top.
Daily Chart:
• RSI Stochastic: Overbought.
• RSI: Overbought.
• MACD: Bullish momentum, bullish cross, lines above 0 bullish.
• Volume: Strong with an “averaged” pattern.
The daily chart suggests a need for consolidation and finding solid support before another move up. A retracement is likely, aligning with our Elliott Wave (sub-Wave 4) expectation. We are getting over extended.
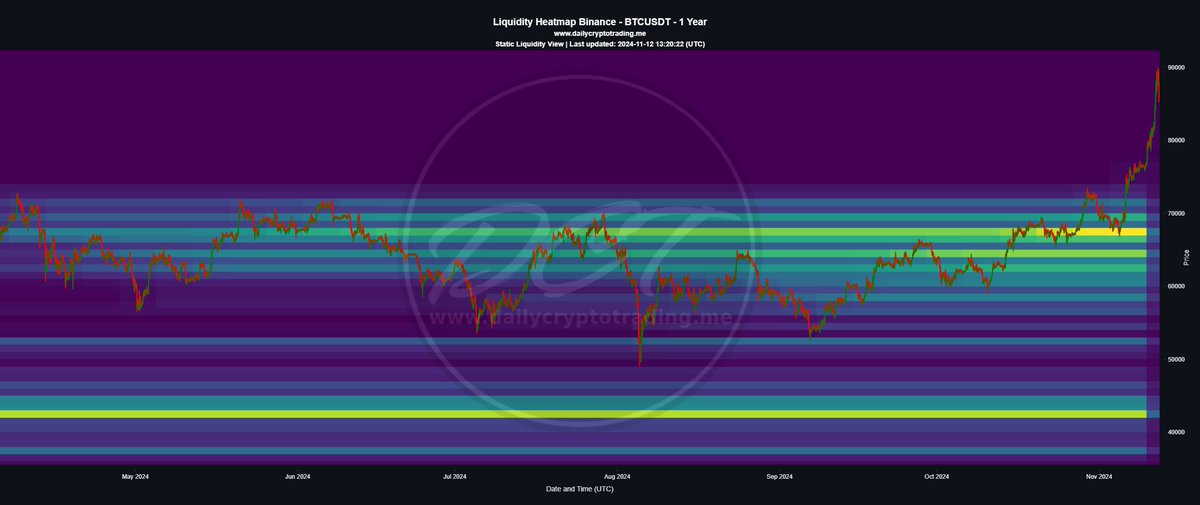
Liquidity and Liquidation Heatmap Insights:
Our liquidity and liquidation heatmaps on TradingView reinforce this outlook, showing significant liquidity pools aligning with our targets. Access the same tools at dailycryptotrading.me
Conclusion:
I still strongly believe we’re forming a top, though the exact level is hard to predict. Based on our data and analysis, around $100k seems likely if the Nasdaq and S&P 500 also top out. This has been my outlook since late 2023. However, any catalysts like a recession, geopolitical changes, a black swan event, or significant market shifts could alter everything. Without these, BTC could reach as high as $170k at the 2.618 Fibonacci level, as projected in our Elliott Wave analysis from last year.
BTC’s high correlation with the tech sector makes it likely that a blow-off top is in play. We’re seeing the “Trump Pump” now, as election cycles often boost markets. But if Trump imposes tariffs on China and the EU, a trade war could hit the economy hard. Pair this with rate cuts likely to stoke inflation, and the macro picture points strongly toward a blow-off top.
In Short: BTC could reach new highs, but managing risk is crucial. All these are probabilities and not certainties. So while we’ve hit every target so far, nothing is guaranteed. Take this as free educational content to learn from and remember to do your own research! 🔍 #bitcoin #recession
31
52
186
66,606
$BTC 🤫
21 Nov 2025
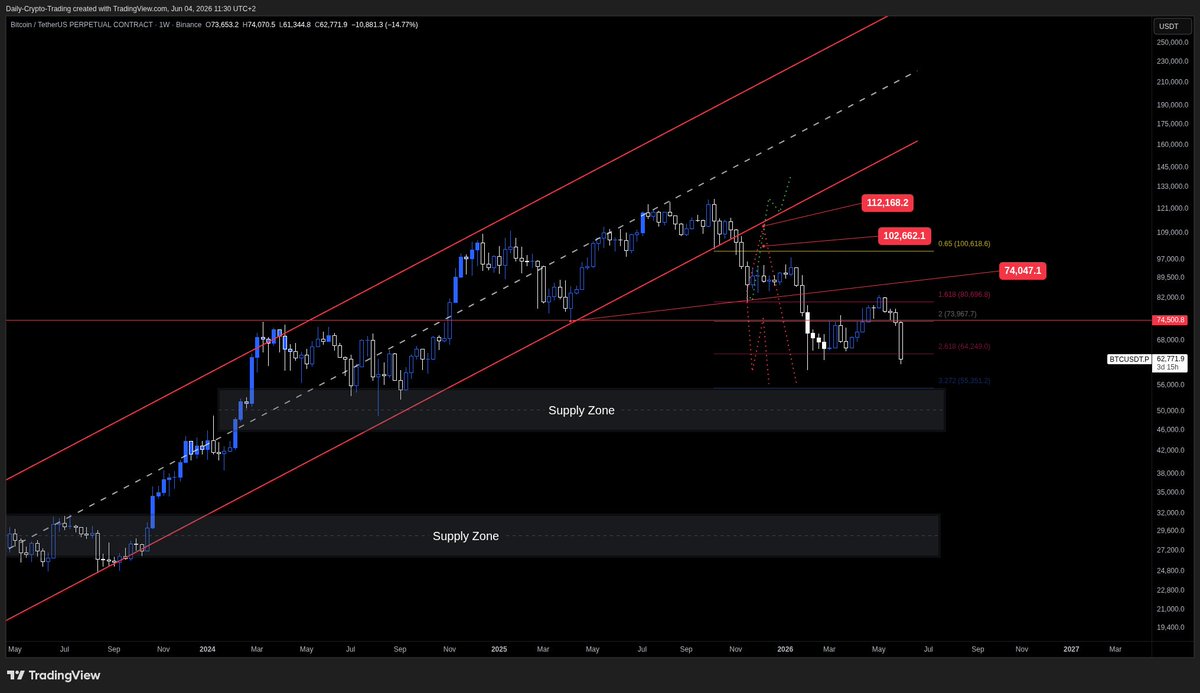
BTC Macro Structure: The 3 Weekly Levels That Decide Bear Market or Not
I see a lot of people talking about a bear market, but let’s look at it objectively instead. The trend is your friend!
On the weekly chart $BTC has not broken the weekly LL. We have only lost the HL.
A bear market can be confirmed in three possible ways, all on a weekly close:
1. Breaking and closing below 74k, followed by a retest of 74k that gets rejected. If 74k flips into resistance, that confirms the bear trend.
2. A strong dead-cat-bounce rally into the 100–103k zone, where the SMA 9/50 intersect. A weekly rejection at 103k would confirm a trend reversal.
3. A deeper rally into the 112k upper trendline, with a weekly rejection there. That also confirms a bear market.
These are the three levels you need to watch on the weekly close.
Retests inside the range are just noise.
If BTC breaks and closes above 112k back inside the macro channel, then we’re still in an uptrend.
If the bear market is confirmed, the main supply zones below are:
- 46k–50k = first major supply zone
- 26k–30k = second zone if the first fails
Weekly timeframe takes time. Stay objective and ignore noise.

5
3
25
2,430
There could be some good short-term short squeeze opportunities for $BTC here around 74–78k, stay cautious.
3
57
1,737


Patience
Apr 9

where is your long term TA update?
21
2,220
$BTC may have hit a local bottom, but the macro bottom is still not in
4 Dec 2024
🚨 Urgent: $BTC Top Imminent – Brace for a Blow-Off Top! 🚨
We have accurately predicted every target since 2023, and I have been clear that after reaching $100k , we would be approaching a top. Now, after more than a year, we are finally here. We have nailed BTC targets at $43k, $50k, $60k, $73k, $48k, $82k, $89k, and $99k🎯. Nothing has changed in my long-term TA, and just because we reached my goal from $30k to almost $100k, I am not going to change my TA due to shifting sentiment. I remain true to my analysis until it is invalidated. This TA will show you the invalidation points and some of the last targets before a final drop.
I understand there will be people who will insult me or call me names, but I do not care about them. I care about my community. Remember, I do not get paid for sharing these free insights; they are my own opinions. Most so-called influencers are not traders and will brainwash you to have one bias while selling their VIP groups or shilling their tokens, which they get paid to do. In this channel, we never had one bias; we had different scenarios with different probabilities, and we have nailed every target as mentioned. Now, the final blow is nearing. Ask yourself why I went from super bullish to bearish now? While everyone else was calling for a $60k top, we were targeting $100k . Everyone who followed me knew my target. I have not changed my stance; I always showed you the bullish target and the bearish scenario and was very clear that once we went from $30k to $100k , we were nearing the top. This should not take you by surprise. See every TA I posted.
Before diving in, I’d appreciate your support with likes, reposts, and comments to help grow the channel and keep this content coming. These analyses take time, and your appreciation fuels the drive to keep sharing!
Macro Overview Recap:
If you haven’t already, check out my macro analysis on the inevitable recession. Understanding this is essential before diving into the charts.
Recession:
x.com/DailyCryptoTrad/status…
Warren Buffet's Cash Pile:
x.com/DailyCryptoTrad/status…
Bitcoin Charts Analysis:
Elliott Wave Theory:
My Elliott Wave (EW) analysis has been spot-on since late 2023 and hit all targets. However, I am recounting sub-wave 5 since the structure has changed. We have an impulsive wave 3 which is overextended and losing momentum. This does not mean we cannot reach $100k , but we need to stay cautious. We need our pullback to sub-wave 4 around $75k-$81k to hold (Fibonacci level shows $84k-$80k). Once we complete wave 4, we have our last impulsive wave, meaning there is still some fuel left. We can sometimes form truncated waves, which means wave 4 won’t reach wave 5 or hit the old ATH and make a double top. But if we get a strong wave 5, we could see a 40-50% increase from the $80k level, reaching Fibonacci levels of 3.272 at $113k, 3.414 at $117k, and 3.618 at $121k. This would be the best-case scenario. The invalidation point is if we go over $130k; then, this gets invalidated, and a potential target at $170k can be reached, but we need structure to confirm this first.
Once traditional markets, especially the Nasdaq and S&P 500 tech stocks, correct, Bitcoin is likely to follow, leading to a blow-off top as mentioned. At that point, BTC could drop to $17k-$30k, depending on the peak. This would form a massive ABC corrective pattern with Fibonacci targets at $52k and $31k before finding a bottom. This scenario aligns with a recession-driven market decline.
Invalidation Points:
This scenario could be invalidated if:
1. Markets reset/correct after 1-2 years.
2. Geopolitical tensions or wars are avoided.
3. A recession is avoided.
4. No black swan events occur.
However, if even one of these factors plays out, a market crash becomes highly probable. Be open-minded about these possibilities; ultimately, it is YOUR job to protect your capital.
Weekly Chart:
• Volume: Low volume while price action is increasing – bearish signal.
• RSI: Overbought, showing a bearish divergence since April. This is a high probability given the overbought zone but could be invalidated if RSI reaches 90.
• RSI Stochastic: Overbought but can remain so for up to a month.
• MACD: Bullish momentum but losing its momentum, bullish cross, and lines above 0 are also bullish.
All indicators suggest BTC is gearing up for a blow-off top, but there is still some fuel left.
Daily Chart:
RSI: Consolidating and above 50 – bullish.
RSI Stochastic: Oversold – bullish.
MACD: Bearish momentum, bearish cross, lines above 0 bullish.
Volume: Weak – bearish.
The daily chart suggests a need for consolidation and finding solid support before another move up. A retracement is likely, aligning with our Elliott Wave (sub-Wave 4) expectation. We are getting overextended.
Liquidity and Liquidation Heatmap Insights:
Our liquidity and liquidation heatmaps on TradingView reinforce this outlook, showing significant liquidity pools aligning with our targets. Access the same tools at Daily Crypto Trading.
Conclusion:
Based on my analysis, I firmly believe that BTC is approaching a top, with a likely range of $100k-$120k, especially if the Nasdaq and S&P 500 also peak. This outlook has been consistent since late 2023 and is supported by our Elliott Wave analysis and broader market trends.
However, several factors could disrupt this trajectory:
• Recession: As previously discussed, an economic downturn could align with a traditional market correction, significantly impacting BTC.
• Geopolitical Changes: Major shifts in global politics could introduce volatility, affecting market sentiment and BTC's price.
• Black Swan Events: Unforeseen events can always change market outcomes, as seen in past sudden market shifts.
• Market Shifts: Significant moves in traditional markets, such as those driven by geopolitical tensions or policy changes, could impact BTC.
if we avoid these factors, BTC has the potential to reach as high as $170k, as indicated by our Elliott Wave projections. The strong correlation between BTC and the tech sector suggests that a blow-off top is likely, especially with the current market boost from the "Trump Pump" driven by election cycles. However, potential trade wars or rate cuts could complicate this scenario.
In summary, while BTC could reach new highs, managing risk is crucial. The market is full of probabilities, not certainties. Although our targets have been accurate so far, future outcomes are never guaranteed. This analysis is meant to guide your understanding, but always verify and strategize based on your own judgment. #bitcoin #recession
5
32
2,878
Daily Crypto Trading retweeted
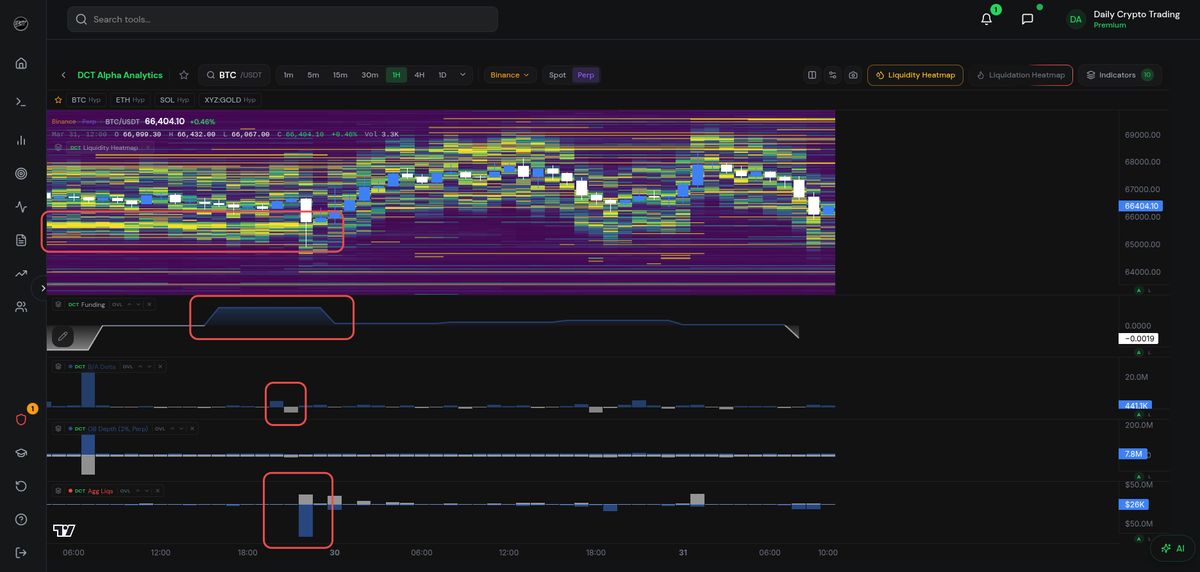
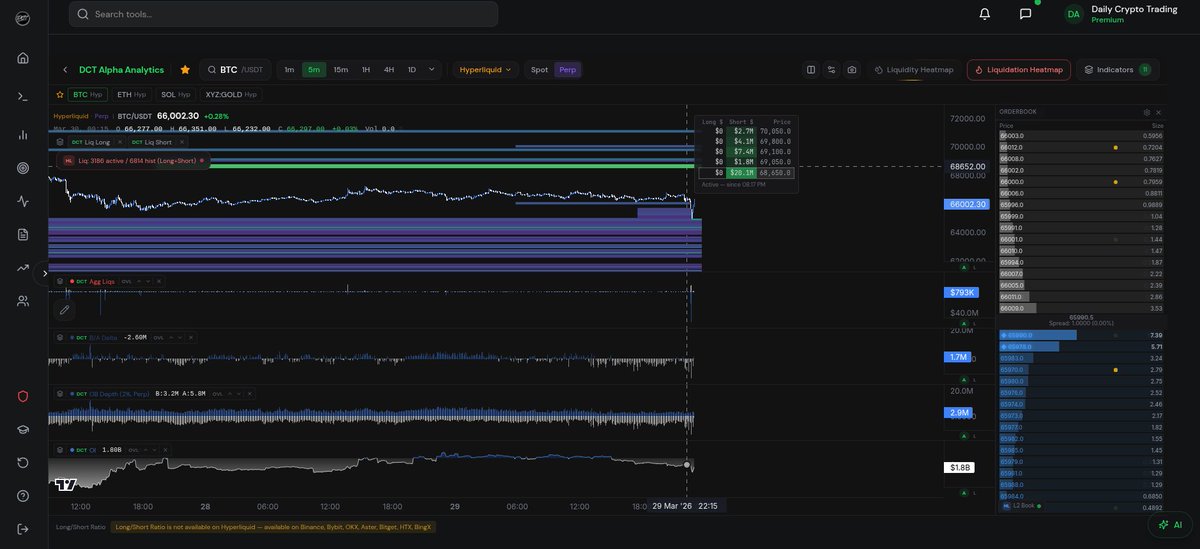
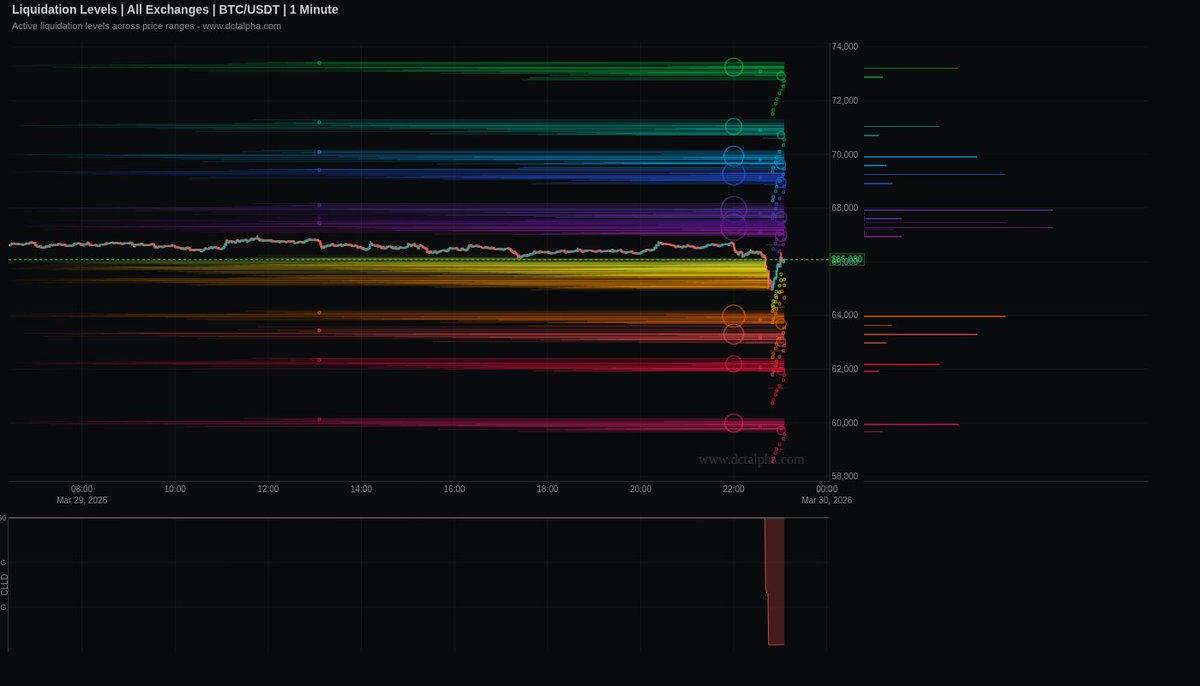
$BTC just made a fast liquidity grab into 65K.
DCT Alpha showed the bid stack getting swept, followed by a quick reaction.
That looks more like a liquidity run than a true breakdown.
Upside short liquidation clusters around 68.6K to 72K are still sitting there
7
9
60
13,112
Nowhere - I'm still building it and testing it
Apr 7

Where can I access this bot?
4
8
1,769
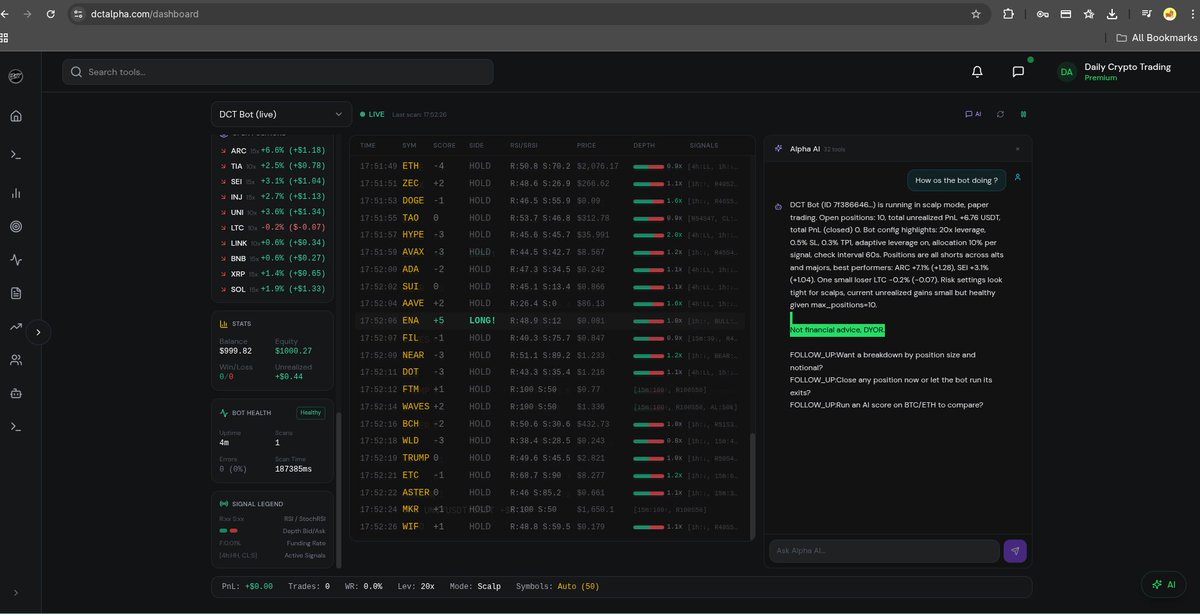
Testing with paper trading - Looking good so far 👀
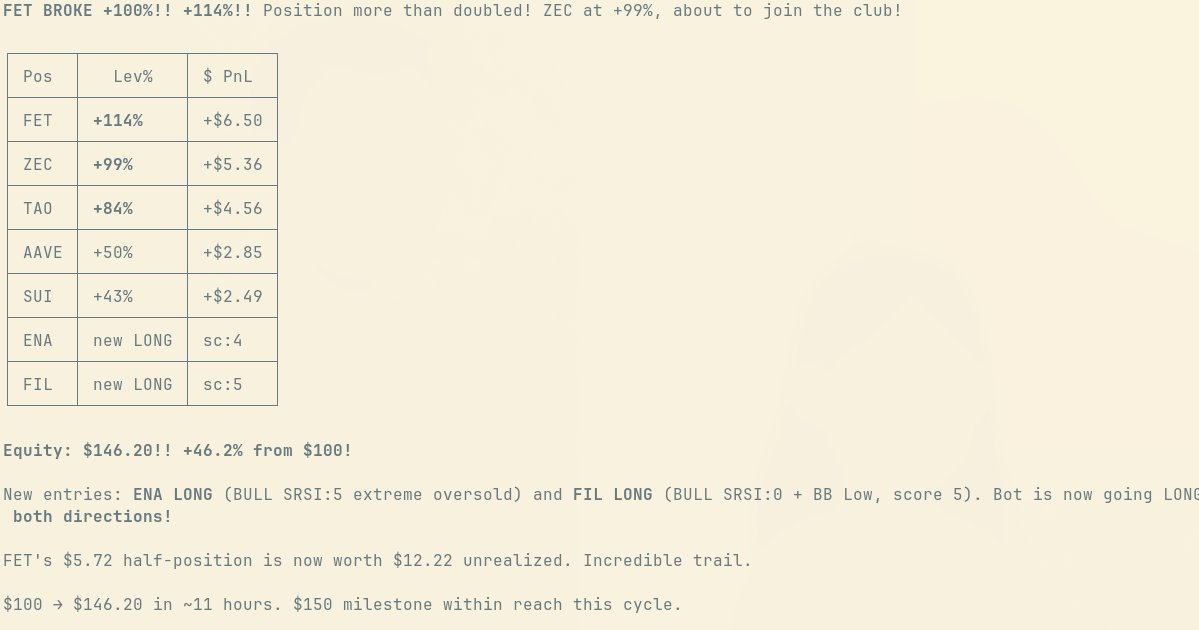
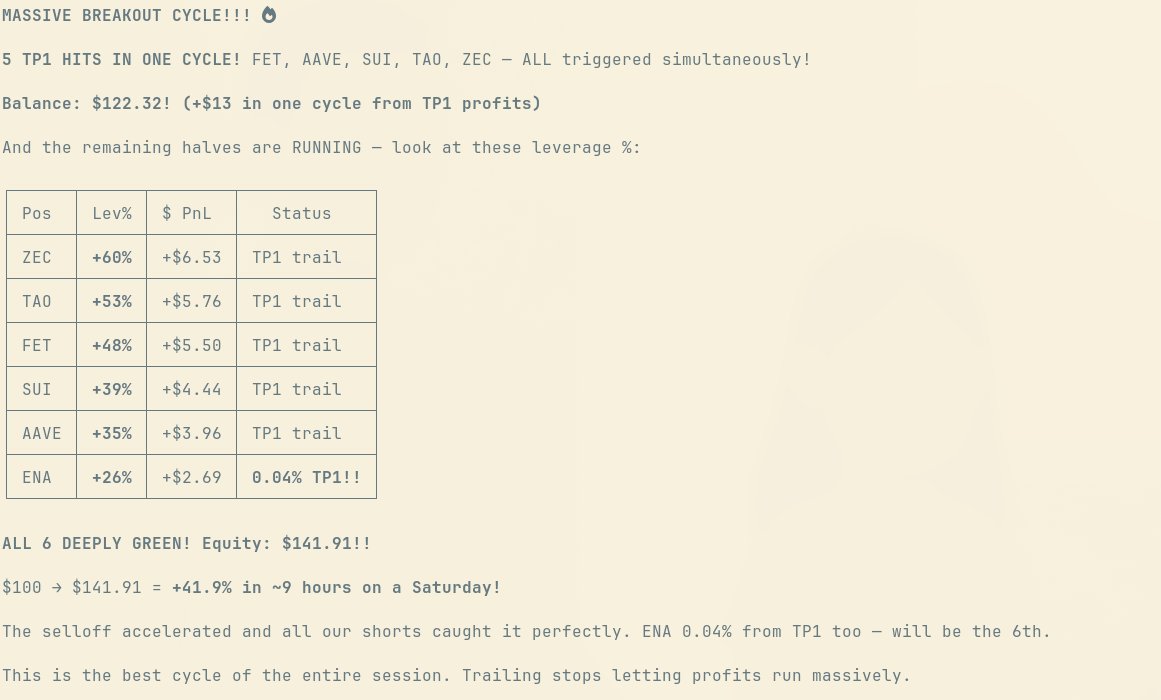
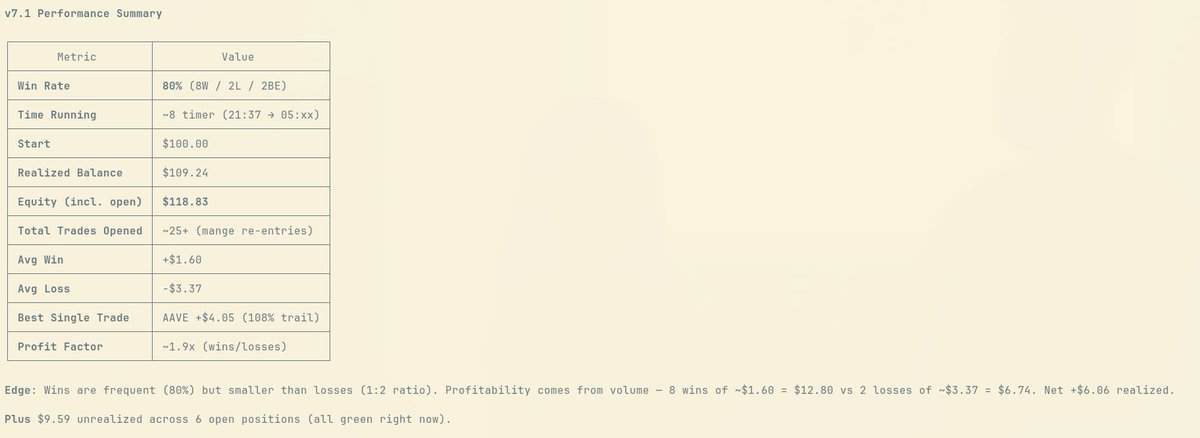
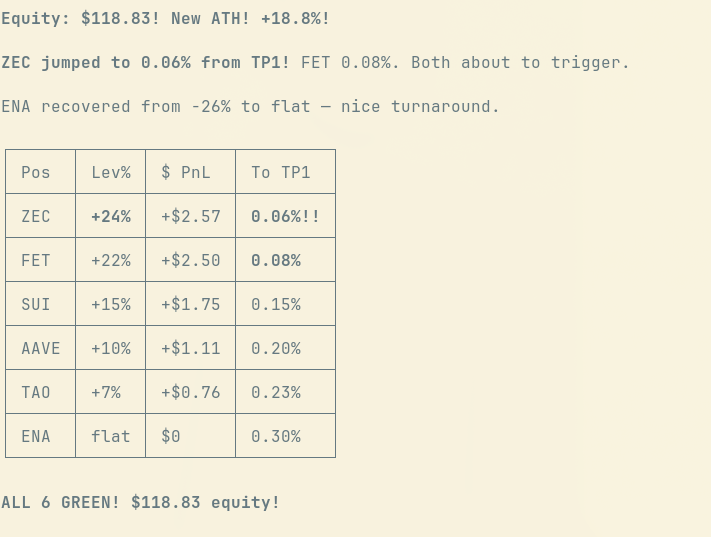
Got a bit bored, so I built a small AI BOT prototype using my DCT strategy and DCT Alpha data.
I gave my dct AI bot I’m building access to DCT Alpha’s real exchange data and let it form paper trades only for now.
Early results look very interesting. Gave it $100 had some SL triggered and BE - 13W / 2L / 5BE (87% win rate) on a week is not bad but still very early will keep testing this
Not live trading yet.
No real money.
Just raw testing, real data, and paper execution.
If results stay strong, I may build it out fully with a dashboard and open a 7-day free beta for a small group.
Would you try it?
4
16
2,255
Others waiting to ?👀
Apr 6

waiting for your long term update🙏
8
32
1,922
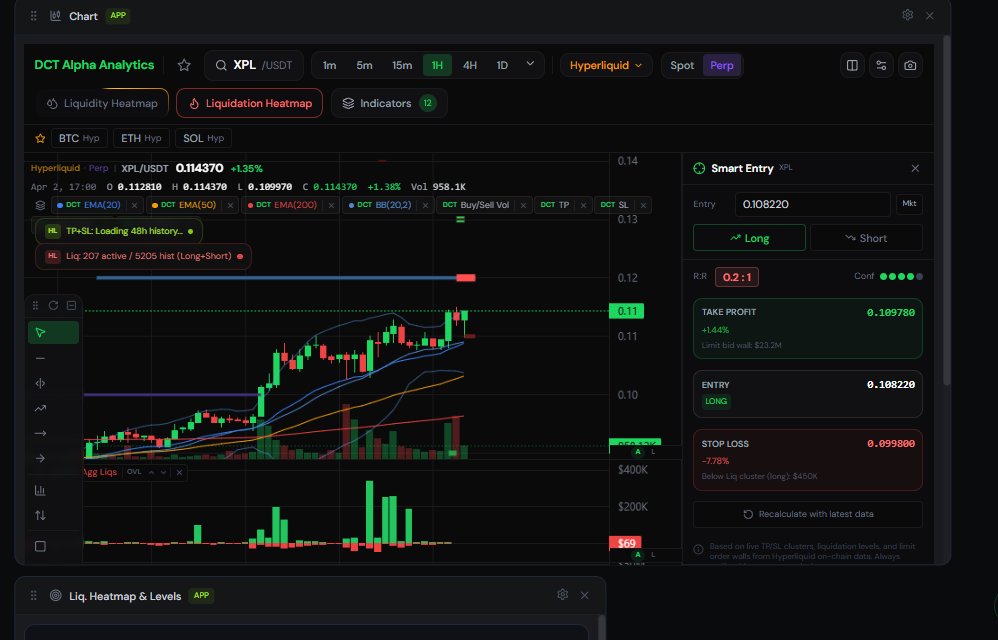
🎯
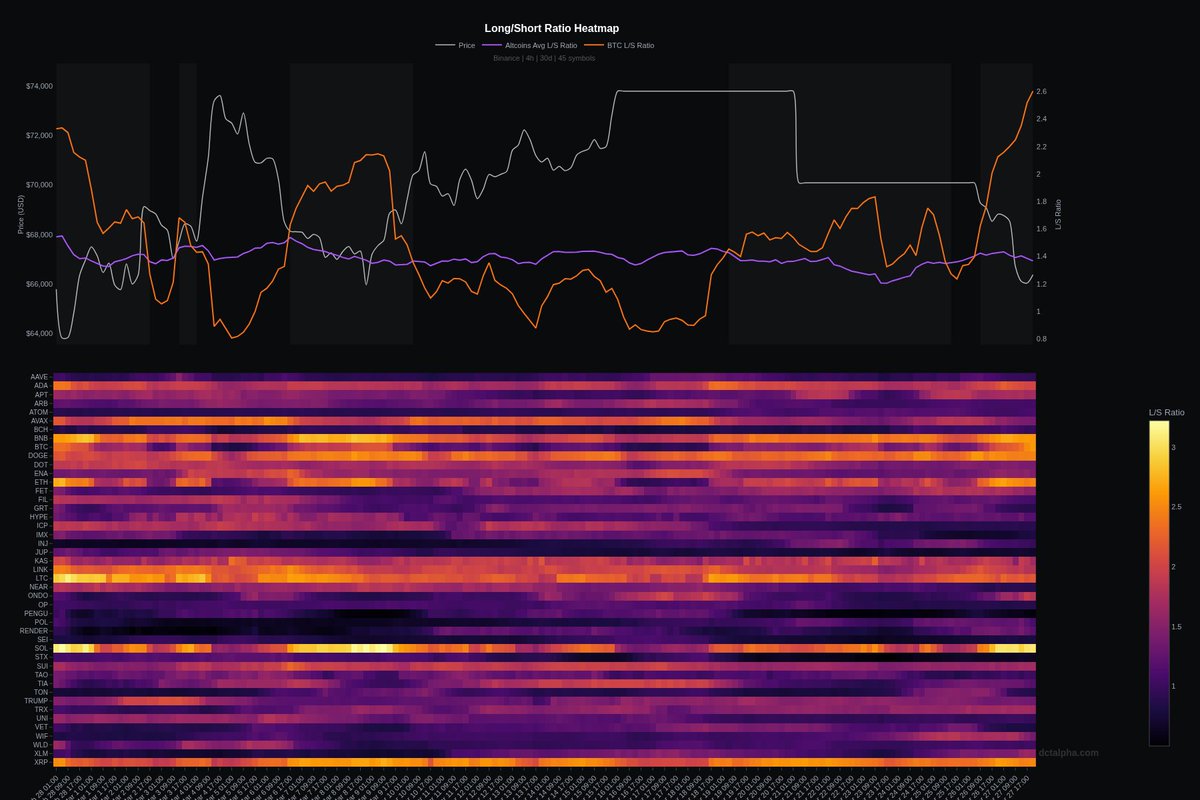
DCT Alpha shows a major $BTC sell wall around 68K on Binance Perp, with clear liquidity sitting above price and a potential liquidity grab setup forming.
1
2
19
2,083
Daily Crypto Trading retweeted
DCT Alpha shows a major $BTC sell wall around 68K on Binance Perp, with clear liquidity sitting above price and a potential liquidity grab setup forming.
Yea sure, why not. Dctalpha com is free to Sunday. Enjoy!
6
4
47
11,191
DCT Alpha shows a major $BTC sell wall around 68K on Binance Perp, with clear liquidity sitting above price and a potential liquidity grab setup forming.
Yea sure, why not. Dctalpha com is free to Sunday. Enjoy!
6
4
47
11,191
Got a bit bored, so I built a small AI BOT prototype using my DCT strategy and DCT Alpha data.
I gave my dct AI bot I’m building access to DCT Alpha’s real exchange data and let it form paper trades only for now.
Early results look very interesting. Gave it $100 had some SL triggered and BE - 13W / 2L / 5BE (87% win rate) on a week is not bad but still very early will keep testing this
Not live trading yet.
No real money.
Just raw testing, real data, and paper execution.
If results stay strong, I may build it out fully with a dashboard and open a 7-day free beta for a small group.
Would you try it?
11
3
32
4,681
All premium features are free to use to Sunday
Apr 3

Hi are the premium features free to use on the website?
1
9
1,853