
Joined January 2021
- Tweets 14,738
- Following 1,211
- Followers 12,049
- Likes 38,497
3,066 Photos and videos


Pinned Tweet

16 Dec 2025
Slow down. Read what real traders are saying:
whop.com/packbootcamp/review…
Our student results speak for themselves — consistent growth, clarity, and full independence.
It’s not your strategy — it’s your ability to align the market environment and volatility condition and turn the right system, measured move and risk profile on.
You’ll learn how to:
• Know when to engage
• Size correctly for volatility
• Match risk profile to measured move expectancy
• Keep your account alive long enough to compound
3 months for $100 includes:
• OHLC Probability Engine – Intraday candle outcome modeling
• HOD/LOD Scenario Tracker – Stat-based market context overlays
• Time-Range Sequencer – Real-time session and volatility structuring
• Monte Carlo Risk Suite – Trade modeling and position sizing engine
• Decision Journal System – Trade review and probabilistic scoring tools
We don’t cherry-pick trades or showcase payouts from one of hundreds of hidden prop accounts. We trade live — show all account, all execution, every day. Wins and losses. No magic. Just process.
Our goal is to give you a complete, independent foundation — so by the end of three months, you no longer rely on anyone but your process, your decision making and your risk management.
Sign up at thedailyprofiler.com
@AC_Trades @Tradesdontlie
1
11
42
19,852
The Daily Profiler retweeted

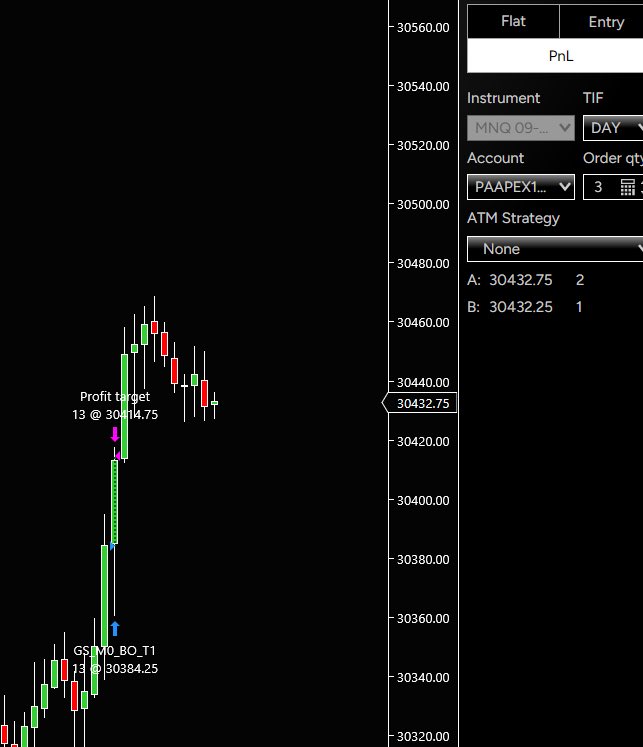
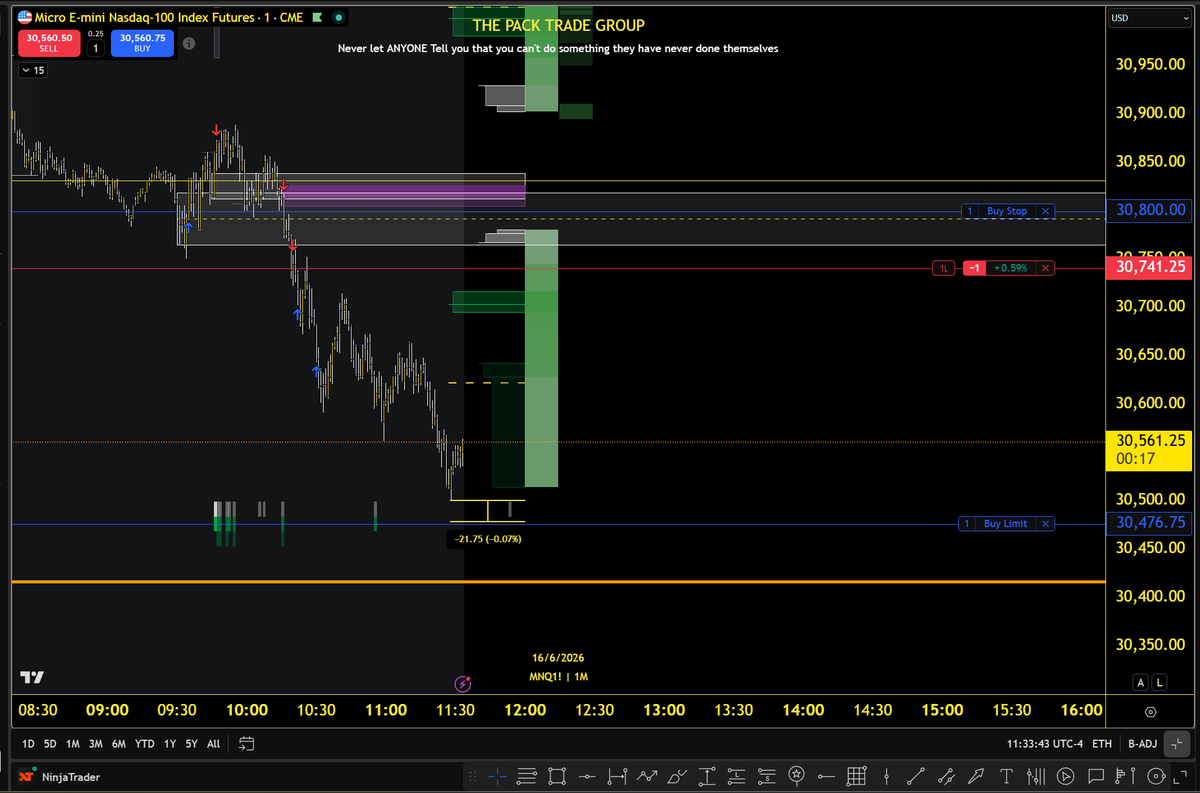
Here is a live trade example of how I manage runners
Because live price and the systems we use within The Pack & Daily Profiler showed continuation signs we still need to exit to make money right?
So how can I effectively scale out of a runer without worrying if I am leaving more on the table or not?
I don't and foroget all sense of being perfect. I am a slave to my SYSTEM.
My SYSTEM tells me that bearish hourly candles form new lows in Q3/Q4 of the hour
Currently as typing this we made a low on the 1128 candle meaning Q2. For BEARISH CONTINUATION candles we make lows in Q3/Q4.
So because my entire analysis gave a bearish RTH am session like I say:
Live price tells us WHERE
Statistics tells us WHERE TO
Live price told me bearish RTH am trend
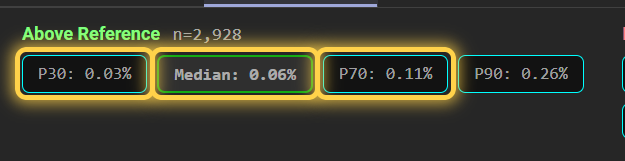
Statistics tells me at a minimum 0.1% off the Q2 lows in a 3 hour line using the 11am hourly candle.
Monthly open is at 30,415 which is a natural higher timeframe checkpoint on a OHLC environment that I put myself in everyday
How can I make money being wrong about a monthly open retest for a bearish directional day locking in exponential gain?
0.07% off the Q2 low.
Done.
1
5
532
The Daily Profiler retweeted
1
14
1,698
The Daily Profiler retweeted
18
5,539
The Daily Profiler retweeted
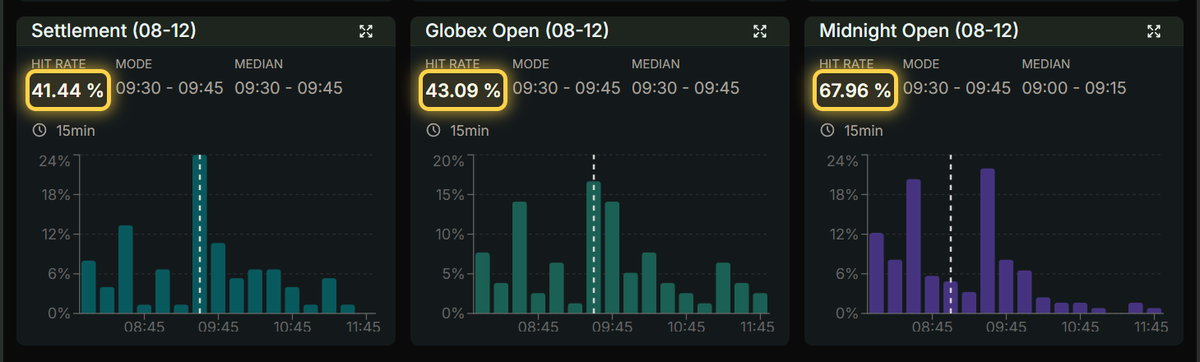
Strategy is the least important part of trading. Decision-making is everything: reading live price and lining it up with data. Most traders freeze the moment a candle is forming live. Today's Bottom Line Up Front: a proactive framework built on fixed levels that show up at the same time every single hour. No guessing. Watch.
Educational only. Figures shown are historical/simulated. CFTC 4.41: simulated results have inherent limitations and are not indicative of future results. Futures trading carries a substantial risk of loss.
2
14
1,310
There is one number most traders skip, and it decides whether you survive or blow up: how much to risk per trade. Today's Bottom Line Up Front: your risk per trade is not a guess. It comes straight from your own model's math, and it is built for survivability. Watch.
Educational only. Figures shown are historical/simulated. CFTC 4.41: simulated results have inherent limitations and are not indicative of future results. Futures trading carries a substantial risk of loss.
5
304
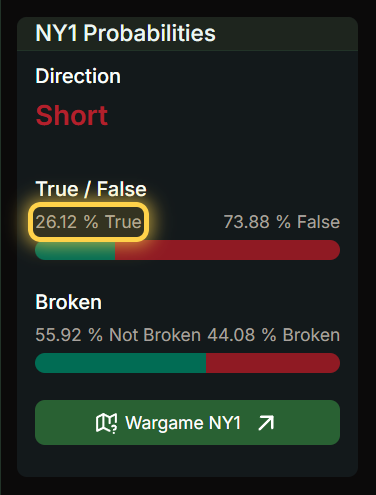
Daily Wargaming $NQ's Highest Probable Move (6/16/2026) x.com/i/broadcasts/1nxeLLVjQ…
5
178
The Daily Profiler retweeted

Aprender a leer el precio de verdad me ha cambiado la forma de operar.
De mirar el gráfico sin entender nada a tener un plan con probabilidades detrás. Eso se lo debo al sistema del bootcamp de Mick (@DailyProfilerCo) y Austin (@AC_Trades).
Os debo mucho, muchachos. Gracias por enseñar de verdad.
1
1
8
486
The Daily Profiler retweeted
1
4
604
Why do some traders survive while others blow up? It isn't strategy.
Your journal isn't a diary, it's your risk department. That's the system we built into The Daily Profiler: log your exposure, audit it, operate like an institution.
Process over prediction. Link in bio.
4
367
The Daily Profiler retweeted
A green candle swallows the red one before it. Every book calls this a bullish engulfing buy.
The data has a different story.
The data says.
1
1
7
745
The Daily Profiler retweeted
Ryan joined the bootcamp last October and graduated in January. The part that stuck: the structure and the business plan did not just change his trading. The psychology bled into his personal life and helped him cut what was not contributing to his success. His words, unscripted.
Individual member experience. Not typical and not a promise of results. Futures trading carries a substantial risk of loss.
1
11
686
The Daily Profiler retweeted
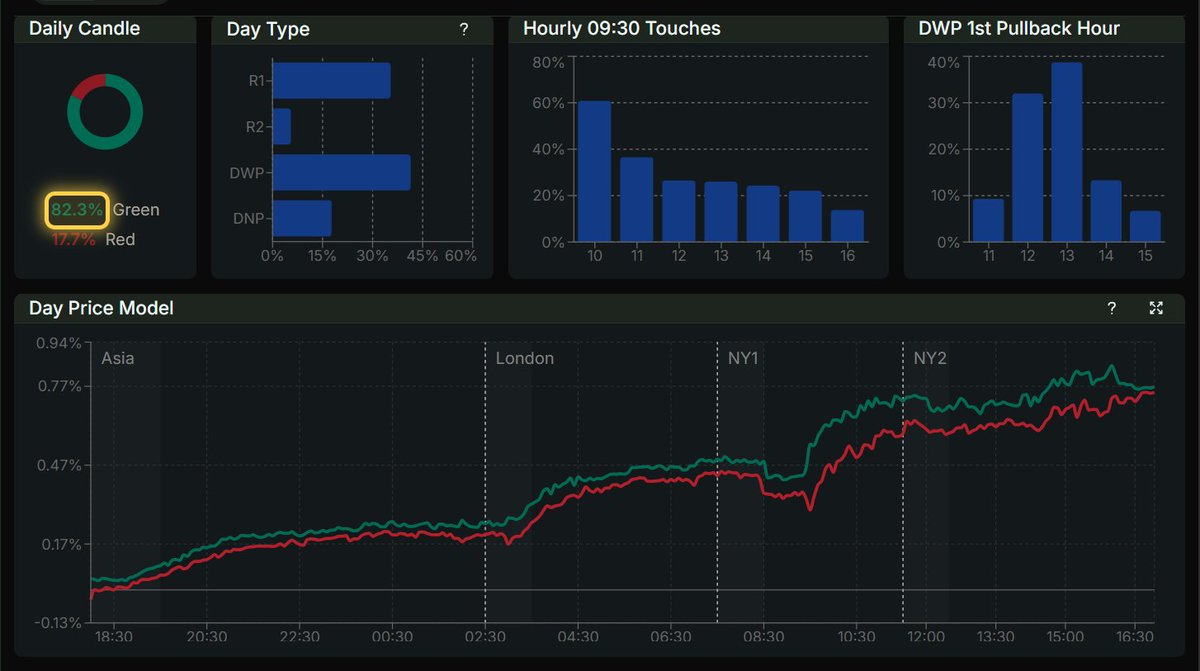
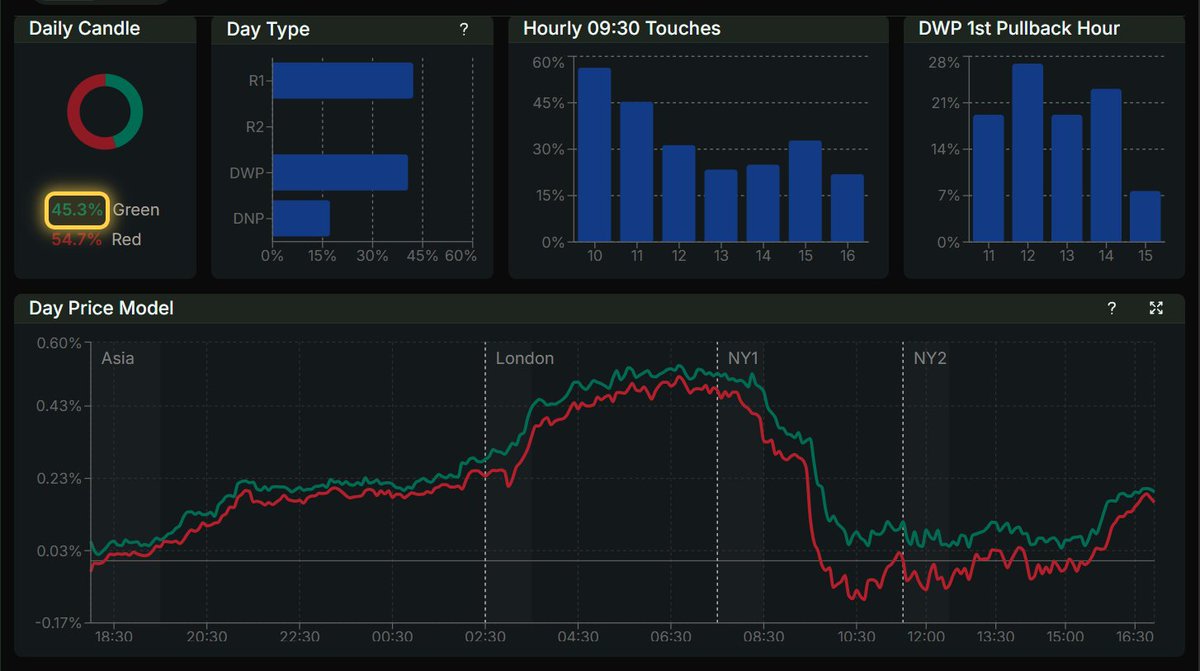
Buyers won Asia. Buyers won London. The whole overnight says up.
Then New York opens and breaks down.
That is the fight, and you plan both sides before 9:30.
The data says.
1
1
7
1,152
After a green candle engulfs the red before it, the next candle takes out the prior high 66.2% of the time, vs 47.7% for any candle.
On the surface, a clean edge. 4,420 1-hour candles.
1
1
384
Every famous pattern, run against real NQ data, both timeframes. The full toolkit, plus how to time it, is the bootcamp. $100 for 3 months. thedailyprofiler.com
1
2
264
No signals. No Lambos. No easy buttons.
Just the data, the sample size, and a process you can repeat.
1
248
A green candle swallows the red one before it. Every book calls this a bullish engulfing buy.
The data has a different story.
The data says.
1
1
7
745
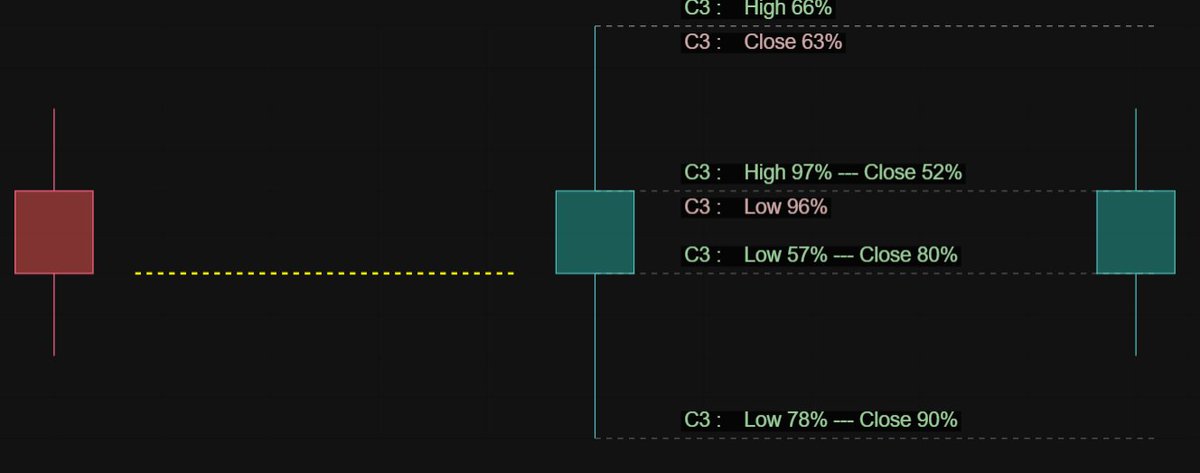
Here's the exact setting, no cherry-picking.
We filter every candle in 20 years of data where this setup forms, then ask what the next one does.
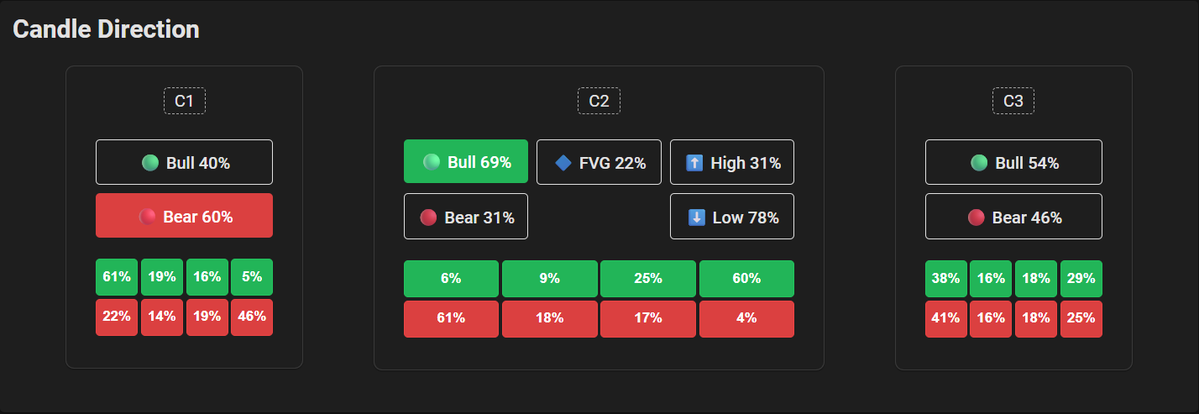
The green and red cells under each candle are the lower-timeframe fractions: which quarter (or third) it closed in.
1
3
258