
Director Applied AI Lab & Perry Professor at UC, Author, Podcaster, Tableau Visionary Hall of Fame DataPlusScience.com●BigBookofDashboards.com●ChartChat.live
Joined January 2012
- Tweets 10,534
- Following 1,798
- Followers 35,130
- Likes 25,641
1,685 Photos and videos


Jeffrey Shaffer retweeted

This fantasy league had its loser trick or treat in June until he got 10 pieces of candy from houses.
Elite punishment.
152
1,132
28,200
2,720,664
Jeffrey Shaffer retweeted

Apr 9
𝐓𝐡𝐞 𝐃𝐚𝐭𝐚 𝐕𝐢𝐬𝐮𝐚𝐥𝐢𝐳𝐚𝐭𝐢𝐨𝐧 𝐒𝐭𝐲𝐥𝐞 𝐆𝐮𝐢𝐝𝐞 𝐁𝐮𝐢𝐥𝐝𝐞𝐫
You can build a custom dataviz style guide for your organization, complete with color palettes, chart examples, and sections on accessibility and best practices.
policyviz.com/2026/04/09/bui…

17
105
6,444
Jeffrey Shaffer retweeted

Mar 24
Forget the Golden Globes, the Emmys and The Oscars, the ONLY award that really matters is the 2026 @Tableau Community Awards, yes folks its time for the 2026 Vizzies! Be the first to cast your votes for the 11th Annual Awards! #tableau #datafam
bit.ly/thevizzies
4
19
47
17,256
Jeffrey Shaffer retweeted

Mar 11
🎂 How to know if the caller is an AI, just ask for a cupcake recipe!
lol …
747
7,479
47,473
2,373,188
Here's another vibe-coded webapp. This one is a live tracker of the NYC Subway trains. I have it set to refresh every 30 seconds using an API, which requires Python (or Node.js), but this is another example of something written entirely by Claude.
This was 10 total prompts. A one-shot instructional prompt launched on my phone. Then 9 follow up prompts to correct various errors over the course of 30 minutes (while doing other things).
I might try a few prompt iterations on this to better show the bread crumbs (maybe lines), and visualizing the current location vs. the next stop vs. future stops.
13
1,249
Jeffrey Shaffer retweeted

Feb 26
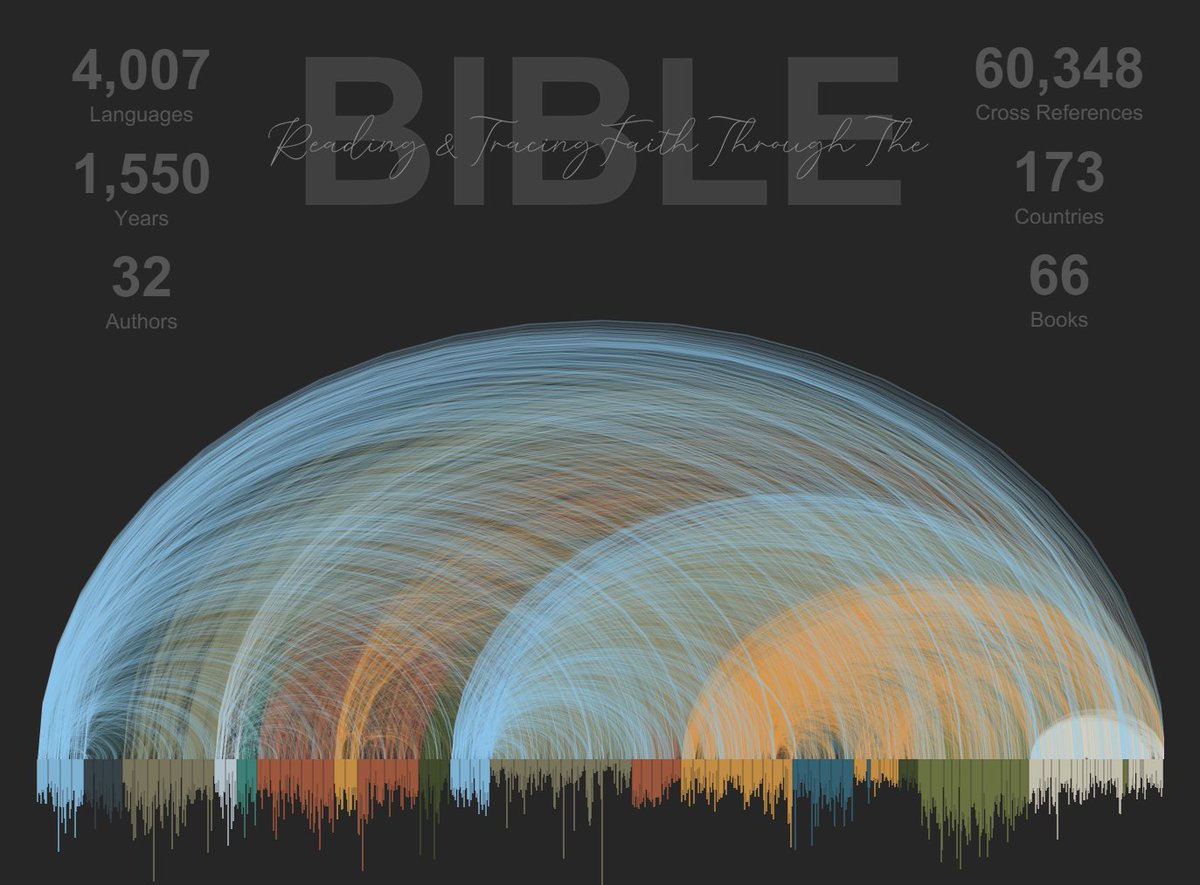
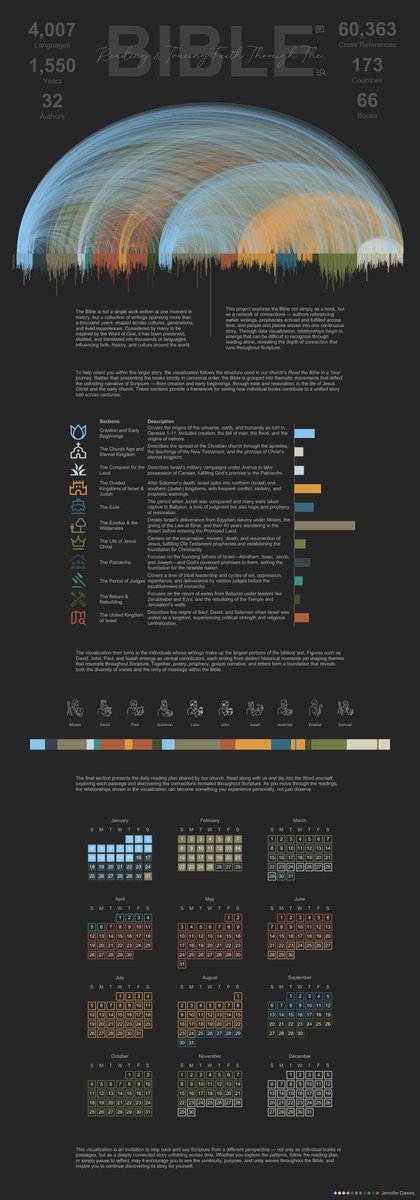
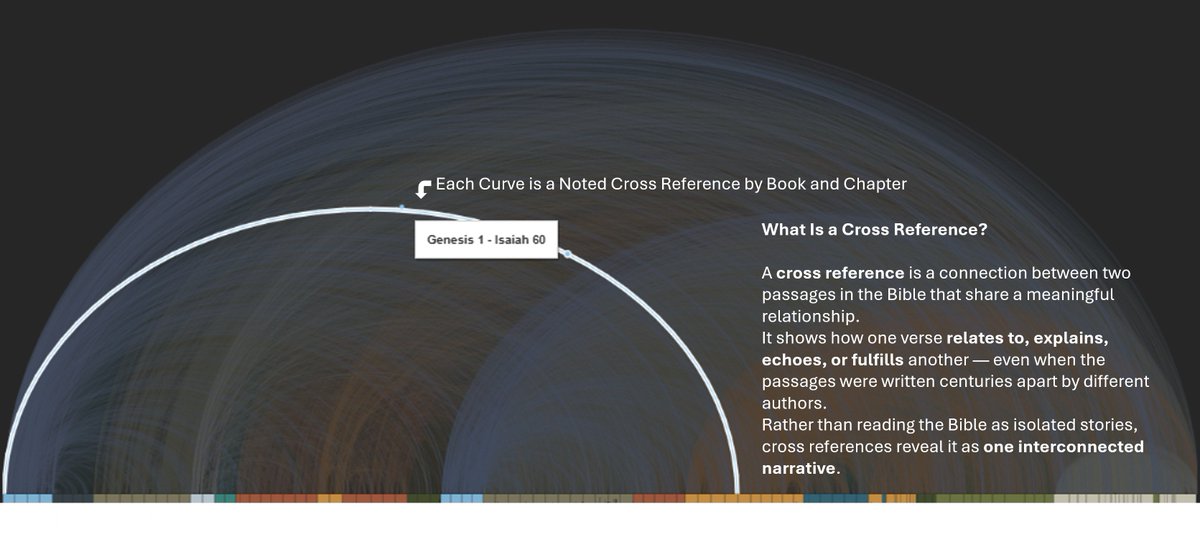
This year, I’ve been tracing faith through the Bible — studying Scripture, exploring historical context, and connecting themes across time. Reading & Tracing Faith Through the Bible is part reflection, part study, and I’ll keep building on it all year. #datafam #tableau @tableaupublic
Viz: lnkd.in/eu5vdvuP
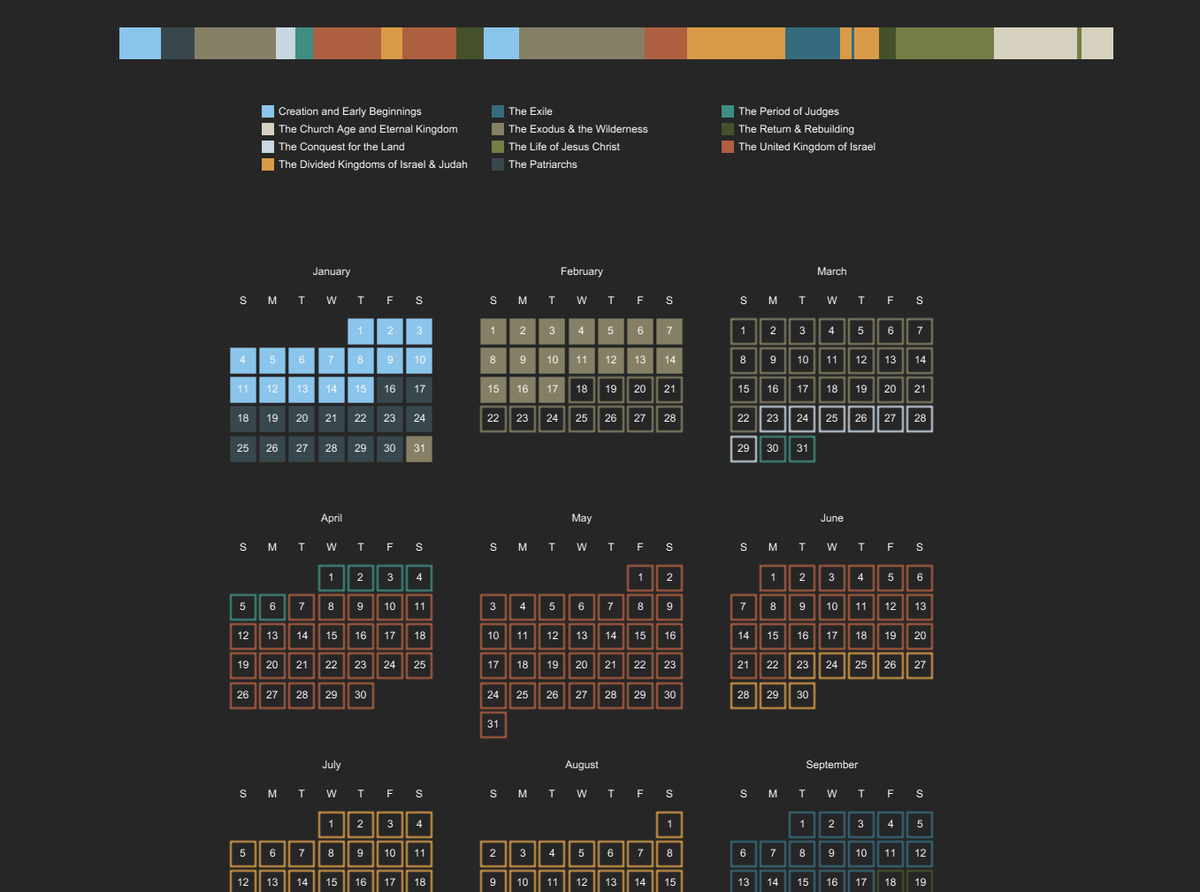
Plan: lnkd.in/eqRVqgTJ
1
4
16
826

Feb 22
Yesterday this application didn’t exist. Today it does.
This was 100% vibe-coded. I didn’t write or edit a single line of code.
Before you watch the video, here’s what you’re about to see.
Nothing is sped up. The app is genuinely this fast.
It pulls real-time traffic data for 30 U.S. cities using the HERE API and maps it on a Mapbox map.
The "jam factor" is calculated live and displayed in the "jam bars" and directly on the map.
Then I add five more cities. Each time, the data is instantly added, the bars automatically re-sort, and new points appear on the map.
Across the top, BANs show the average jam factor, the most congested city, the least congested city, and the last update time. All updating dynamically.
Then I pick the custom colors based on the jam factor, customize the color ramp scale, and even modify the bounding box (the area used to calculate traffic conditions) from rural to dense urban settings, or manually define the geography.
How is this done? Knowing what to ask for and iterating with GenAI. I started building this app while I was grading assignments, and just checking back in on the progress!
From zero to a real-time, interactive, API-powered dashboard. That’s where we are.
Insights this morning: Indianapolis had a number of car accidents slowing down traffic, briefly popping it to the top of the list over NYC. But at the moment Miami, FL has the heaviest traffic.
7
20
169
19,870
Jeffrey Shaffer retweeted

Jan 11
What kind of change will AI bring in the next few years?
@uofcincy Applied AI Lab Director, Jeff Shaffer @DataPlusScience joins me and Donna D next...listen 2:07p 700wlw.com/listen
1
1
1
665
Jeffrey Shaffer retweeted

Jan 11
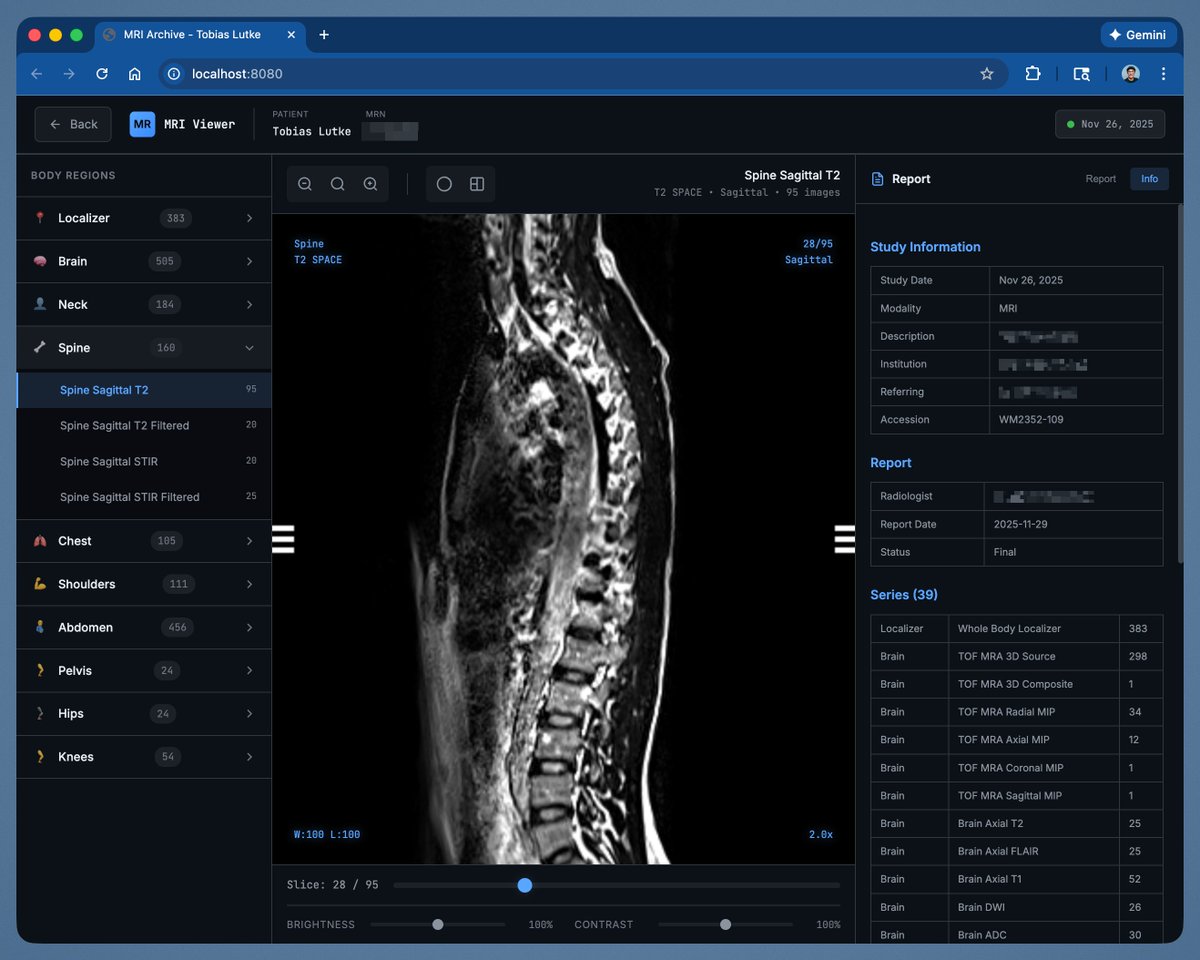
My annual MRI scan gives me a USB stick with the data, but you need this commercial windows software to open it.
Ran Claude on the stick and asked it to make me a html based viewer tool. This looks... way better.
1,010
1,756
32,983
7,538,629
Jeffrey Shaffer retweeted

Jan 4
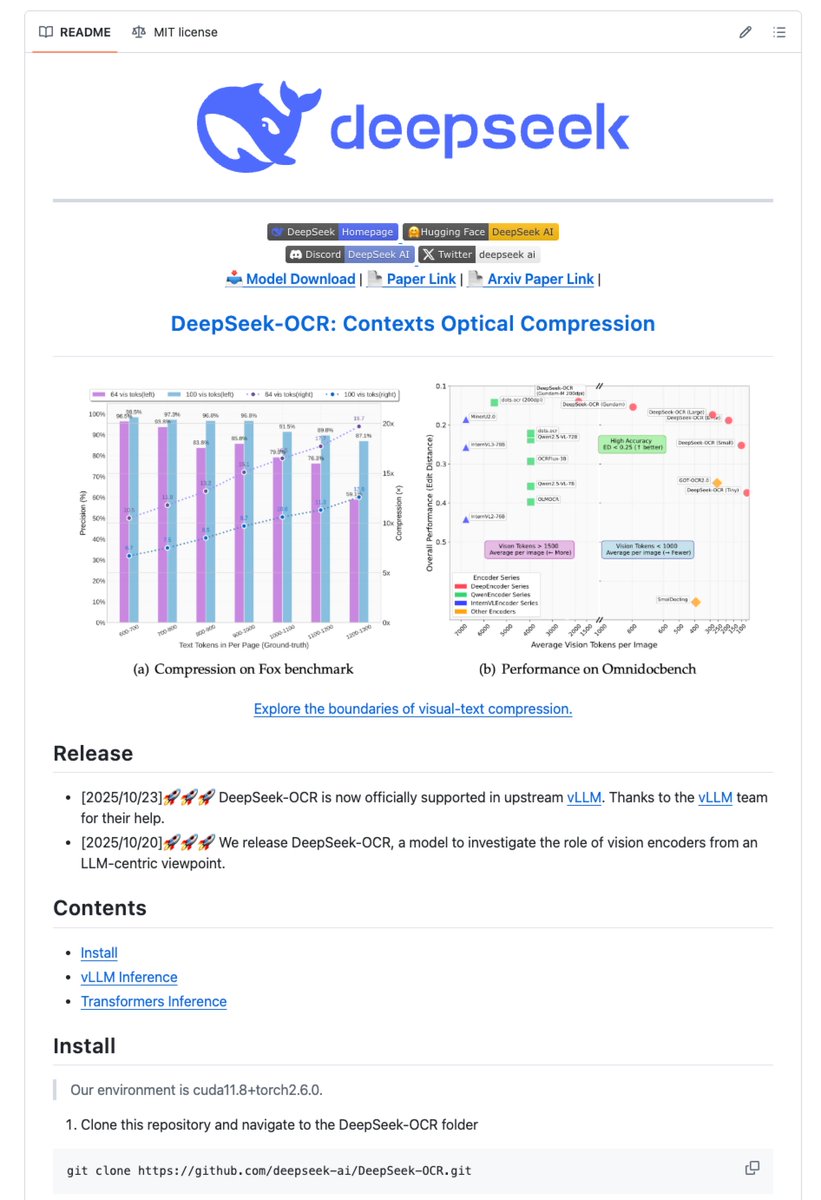
ICYMI DeepSeek has just unveiled an OCR monster 🤯
DeepSeek-OCR is a 3B-parameter model that redefines document intelligence. It reaches 97% character-level accuracy with 10× input compression, preserving every detail.
Most OCR systems require over 6,000 tokens per page.
DeepSeek-OCR achieves the same with about 100 tokens.
No fidelity loss.
Adaptive modes:
✓ Tiny – simple layouts (≈64 tokens)
✓ Small – standard reports (≈100 tokens)
✓ Database – structured or multi-column docs (≈256 tokens)
✓ Gundam – high-complexity pages (n×100 256 tokens)
It scales effortlessly: 200K pages/day on a single NVIDIA A100 GPU.
Its dual-stage design combines a vision encoder for optical compression with a Mixture-of-Experts decoder for structured reconstruction. The outcome is near-perfect precision and zero information loss.
In practice:
➤ 10× lower token costs
➤ Runs on standard hardware
➤ Outputs clean HTML, SMILES, or JSON
While traditional OCRs focus on raw pixel-to-text conversion, DeepSeek-OCR just introduces intelligent semantic parsing 🔥
Open source and free to use.
Repo in 🧵↓
55
262
1,670
99,667
Jeffrey Shaffer retweeted

19 Dec 2025
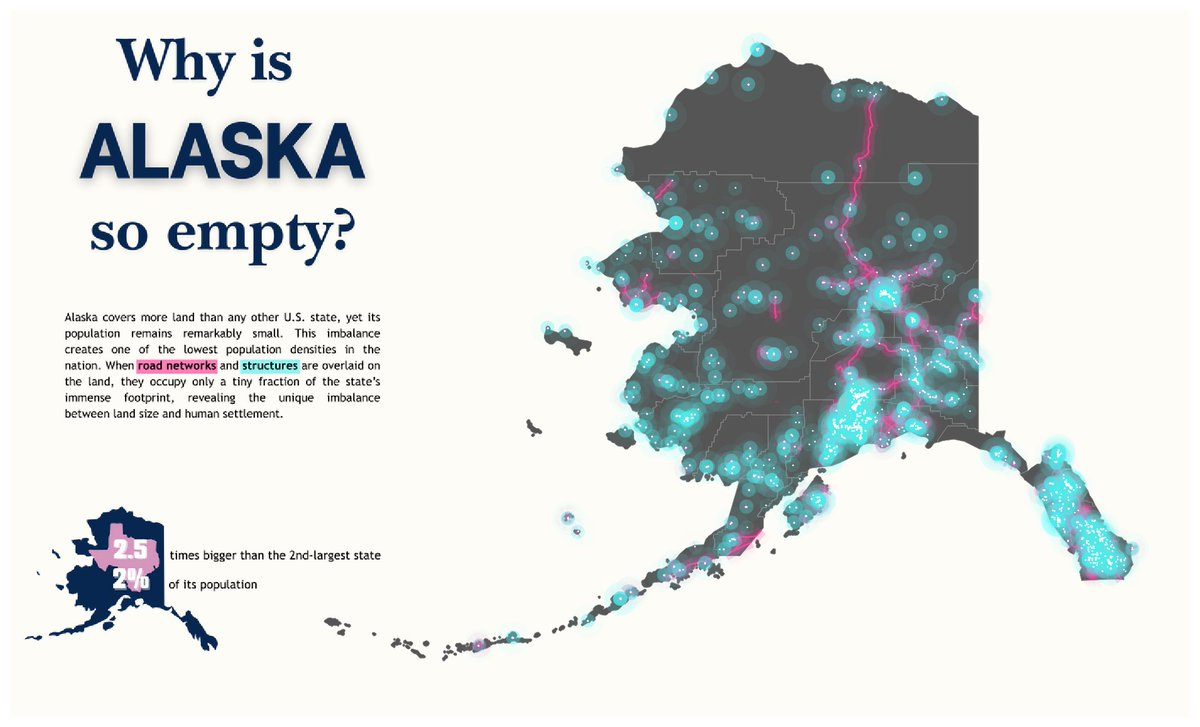
This #VizOfTheDay by Anindita Mitra utilizes high-contrast geospatial mapping to visualize the imbalance between Alaska’s land mass, and its human footprint—the largest of any U.S. state.
Explore the viz. tabsoft.co/48J6HQI
2
30
1,510
Jeffrey Shaffer retweeted
19 Dec 2025
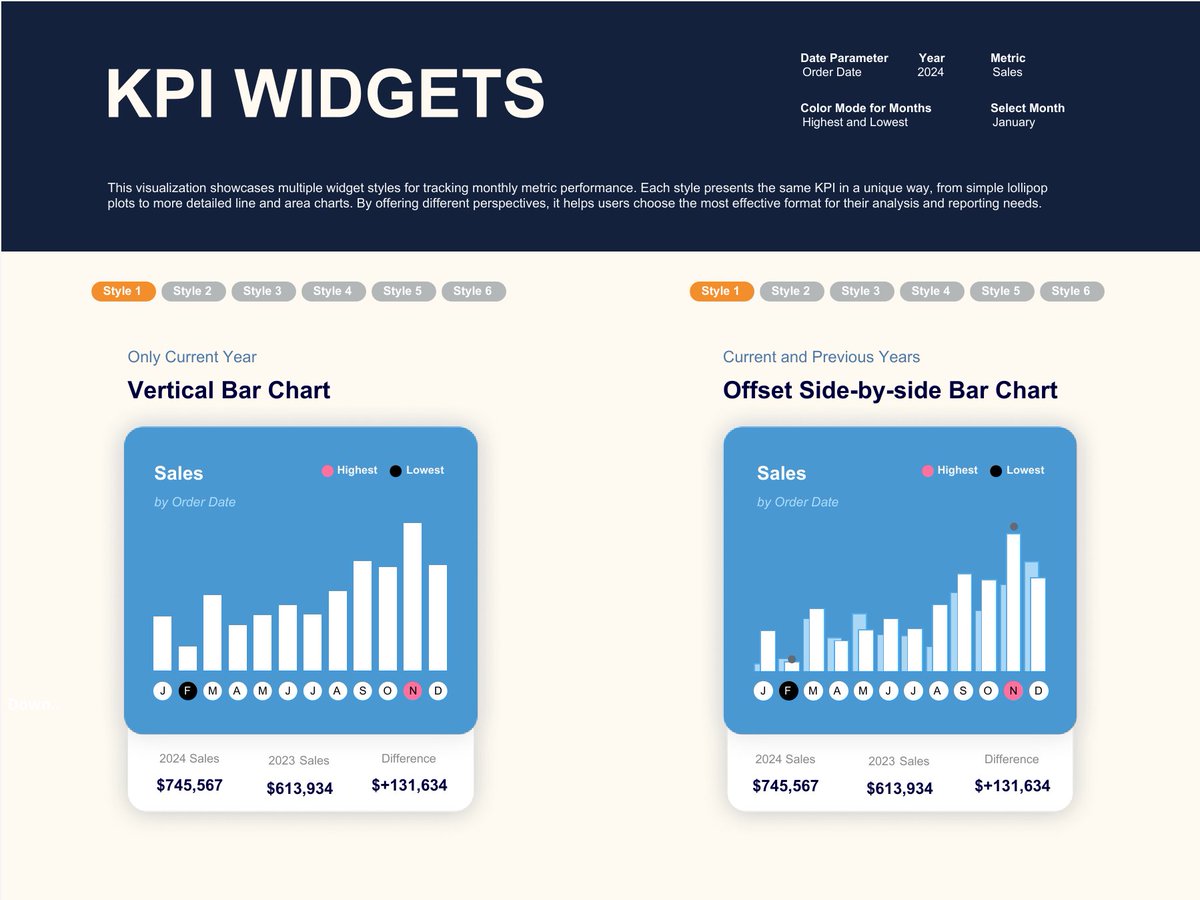
In this #VizOfTheDay, @Babajide_Tobi showcases 12 widget styles for tracking monthly performance, from lollipop plots to area charts. Explore the viz to see how you can customize your KPI widget.
tabsoft.co/44DuhMi
11
53
2,398
Jeffrey Shaffer retweeted

18 Dec 2025
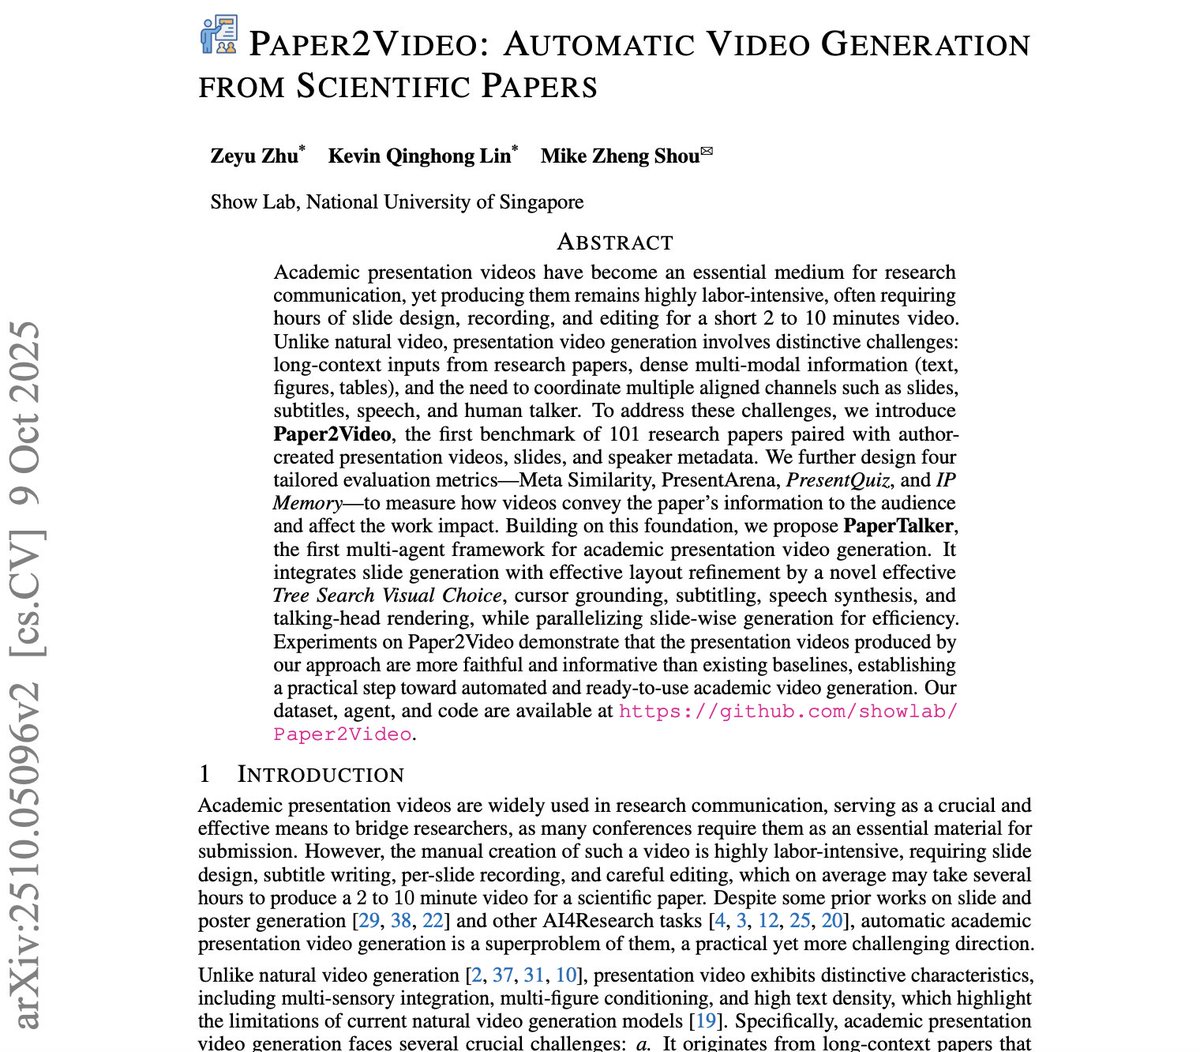
This is insane 🤯
A new system called Paper2Video can read a scientific paper and automatically create a full presentation video slides, narration, subtitles, even a talking head of the author.
It’s called PaperTalker, and it beat human-made videos in comprehension tests.
Hours of academic video editing... gone.
AI now explains your research better than you do.
👉 github. com/showlab/Paper2Video
99
711
3,248
207,225
Jeffrey Shaffer retweeted

4 Dec 2025
basketball AI YouTube tutorial is finally live
over 1000 hours of work compressed into 37 minutes
link below; like and comments please
95
264
3,225
709,990
18 Nov 2025
Check out the latest article in my newsletter: My AI Diary: One day at a time with AI.
#19 The Human-In-The-Loop Paradox
linkedin.com/pulse/my-ai-dia…
1
317
1 Nov 2025
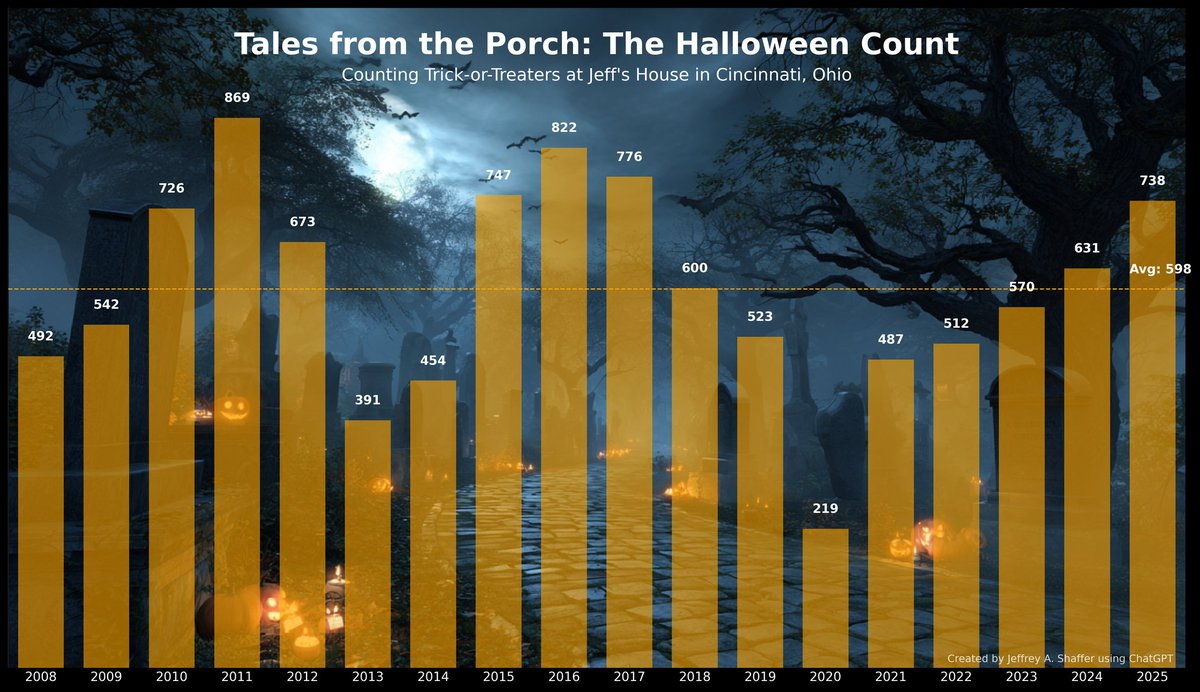
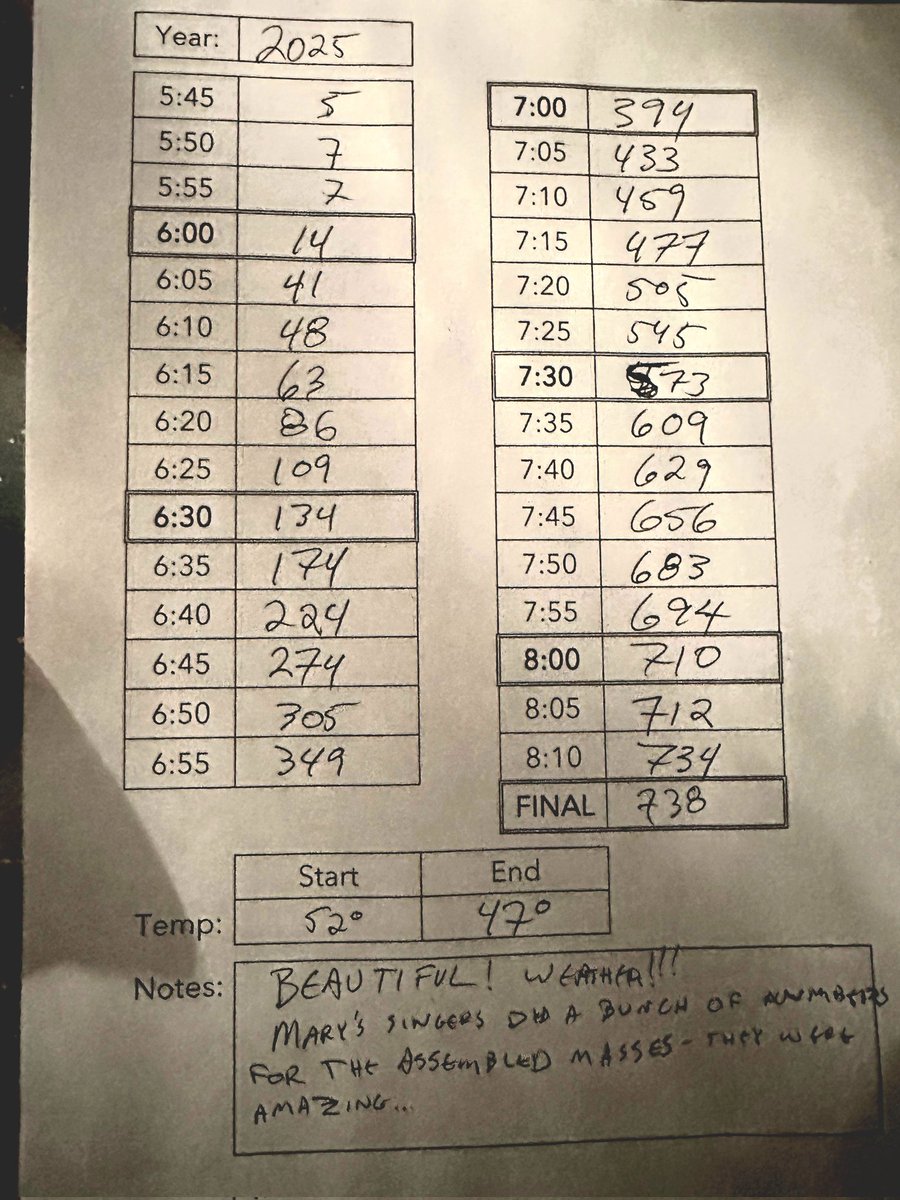
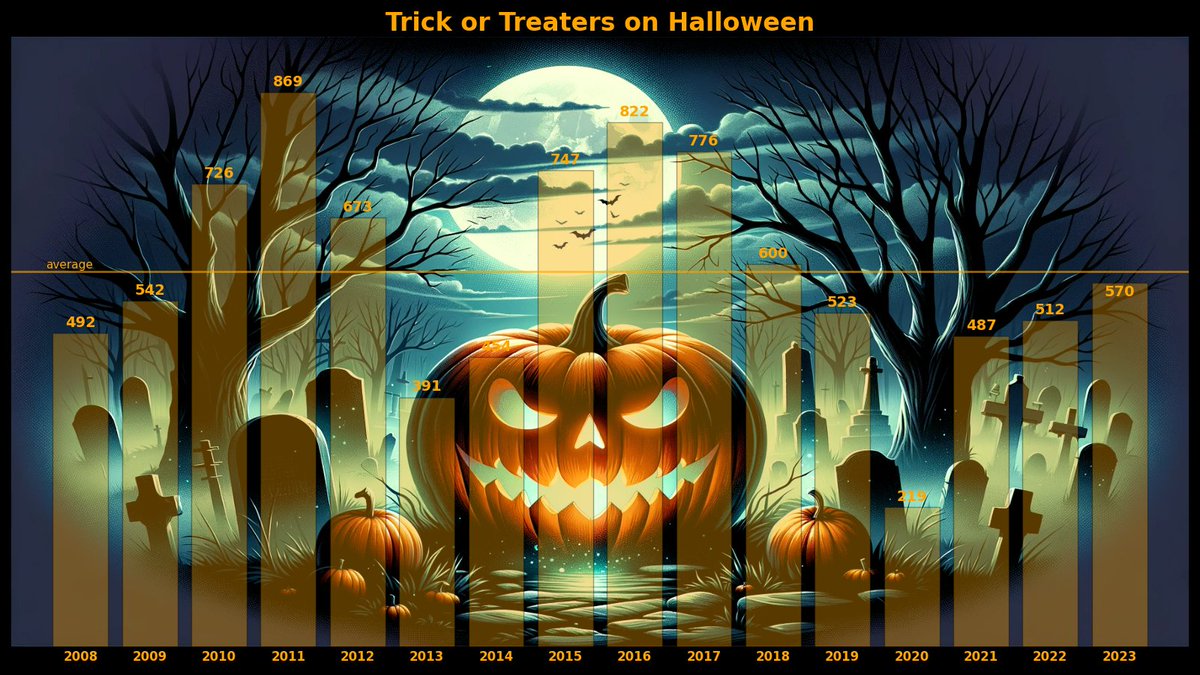
The final count of trick-or-treaters for our 2025 Halloween was 738. Door prizes included Skyline Chili, Rightguard deodorant, Tupperware, a pack of pencils, and a brand new copy of Dashboards That Deliver (unsigned). We also had a private concert from some of Mary's music theater students.
1
2
927
1 Nov 2025
I filled a 4.5 cubic foot Gorilla Yard cart with 3,223 pieces of candy, then refilled a bag numerous times through the evening to pass it out. Used approx. 3,000 pieces.
1
2
315
1 Nov 2025
It's now 18 years of tracking my Halloween trick-or-treaters. Last year I used ChatGPT to visualize it, so here's a new one. Entirely GenAI created using ChatGPT and Midjourney.
9
715
15 Sep 2025
Something arrived in the mail over the weekend! The unboxing of my second book, Dashboards that Deliver! Available 9/23/2025 with pre-order on Amazon. With my co-authors @acotgreave , @abmakulec and Steve Wexler.
3
5
361