
Joined April 2024
- Tweets 310
- Following 8
- Followers 2
- Likes 17
137 Photos and videos


10 Feb 2025
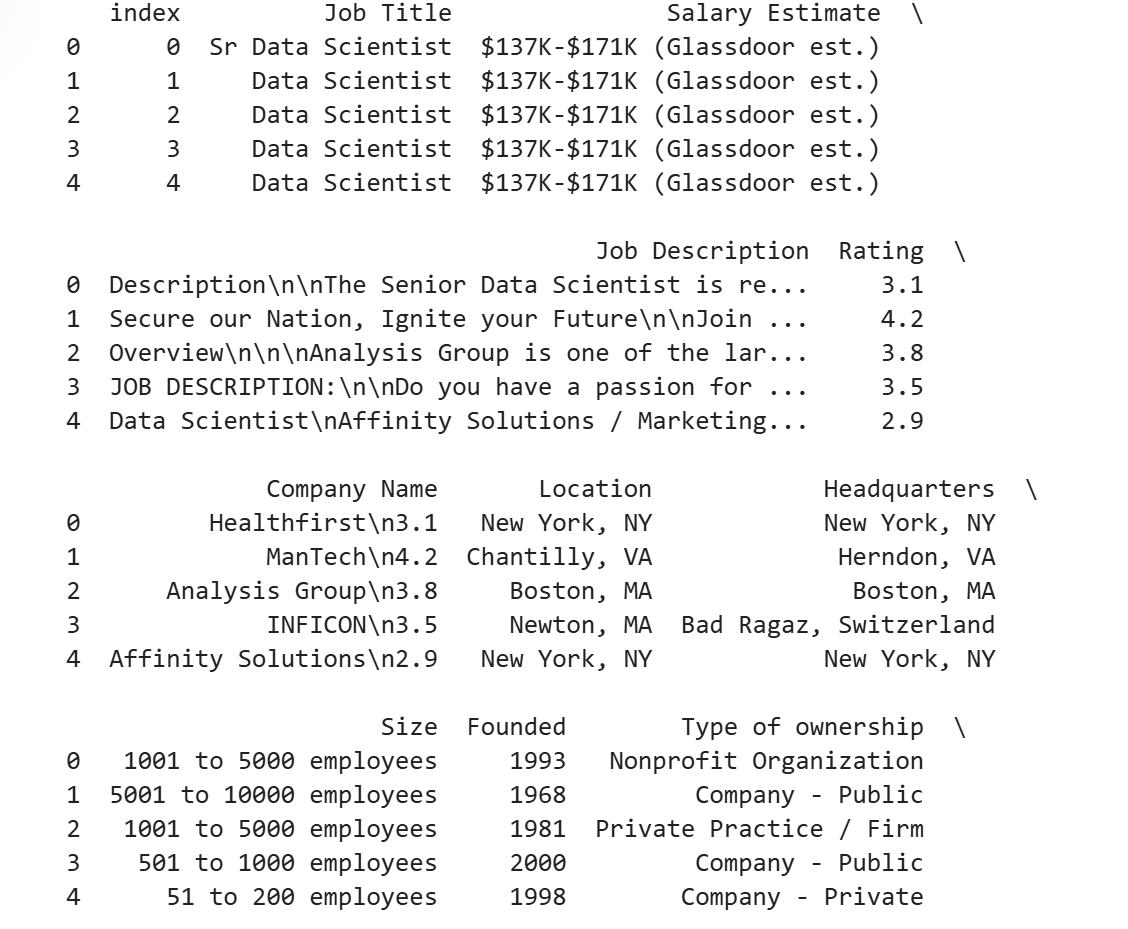
🚀 Week 6 was all about Exploratory Data Analysis (EDA) & Visualization!
I cleaned, analyzed, and visualized an uncleaned dataset of Data Science jobs using Pandas, Matplotlib & Seaborn. Let's break it down! 🧵
@TDataImmersed
#TDI
@DabereNnamani
5
12
10 Feb 2025
✅ Cleaned messy data
✅ Uncovered job trends
✅ Created powerful visuals
EDA & Visualization are 🔑 for Data Science!
Want to see everything? Check out my notebook:
🌐 anaconda.cloud/share/noteboo…
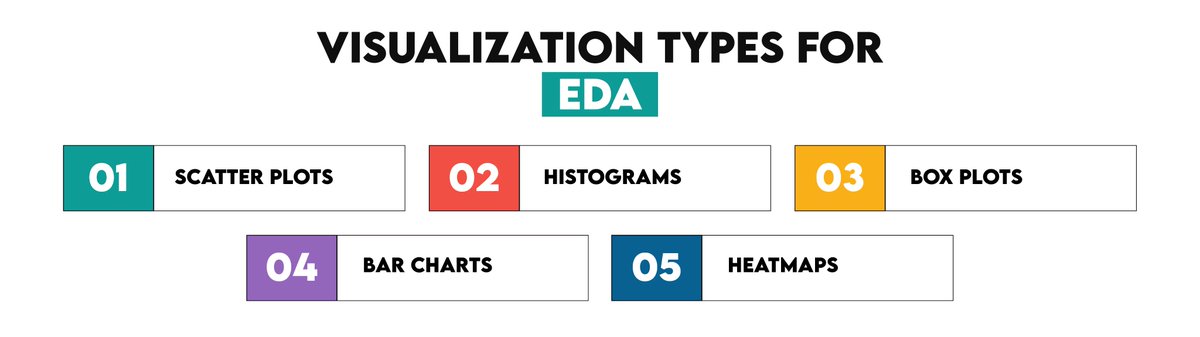
Which visualization do you use most? Let’s discuss! 🚀🐍
10 Feb 2025
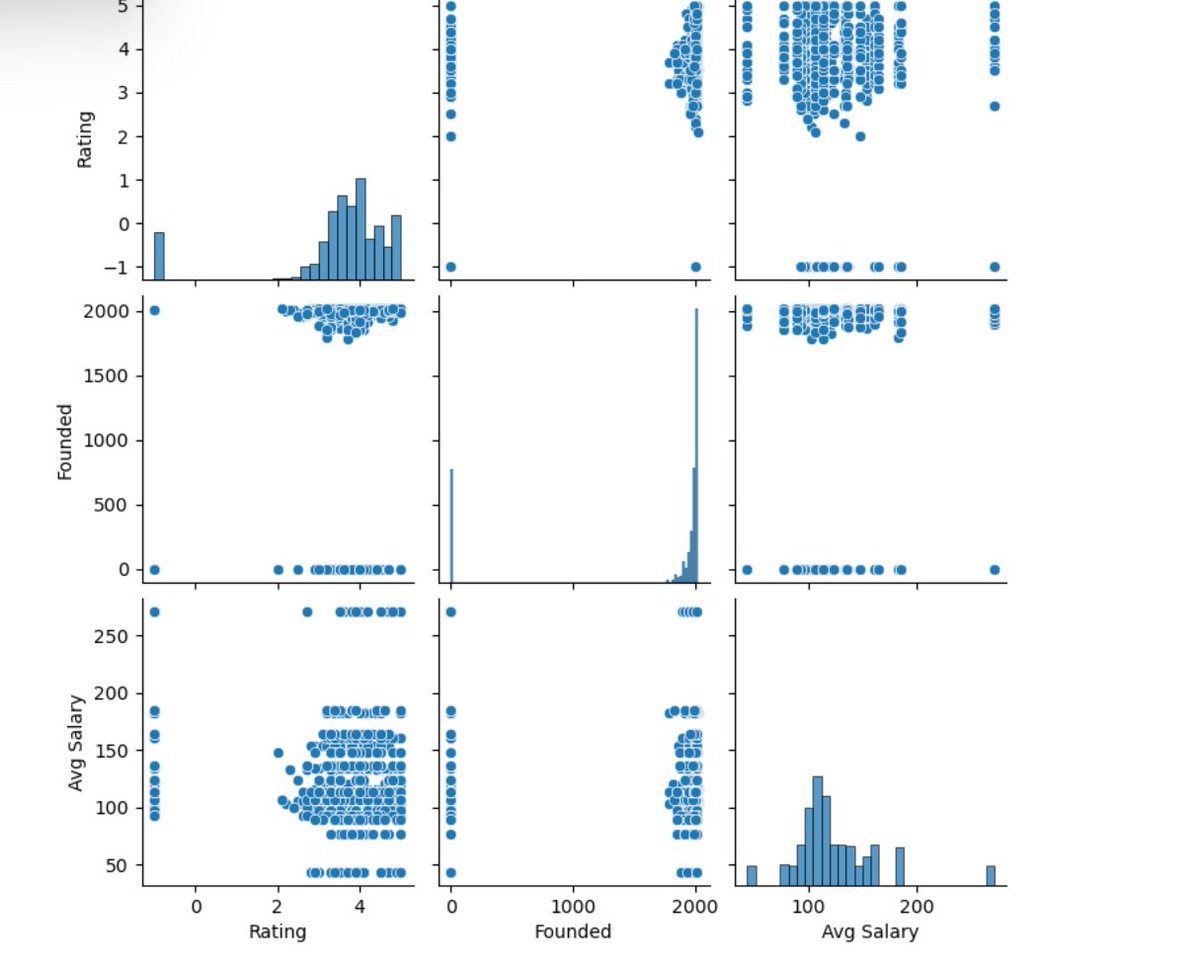
🔥 Seaborn for Advanced Plots
Heatmap: Correlation between key variables 🔥
Box Plot: Job title vs company ratings 🎭
Pair Plot: Relationships between salary, rating & founding year
Aesthetics Insights = 💡

3
10 Feb 2025
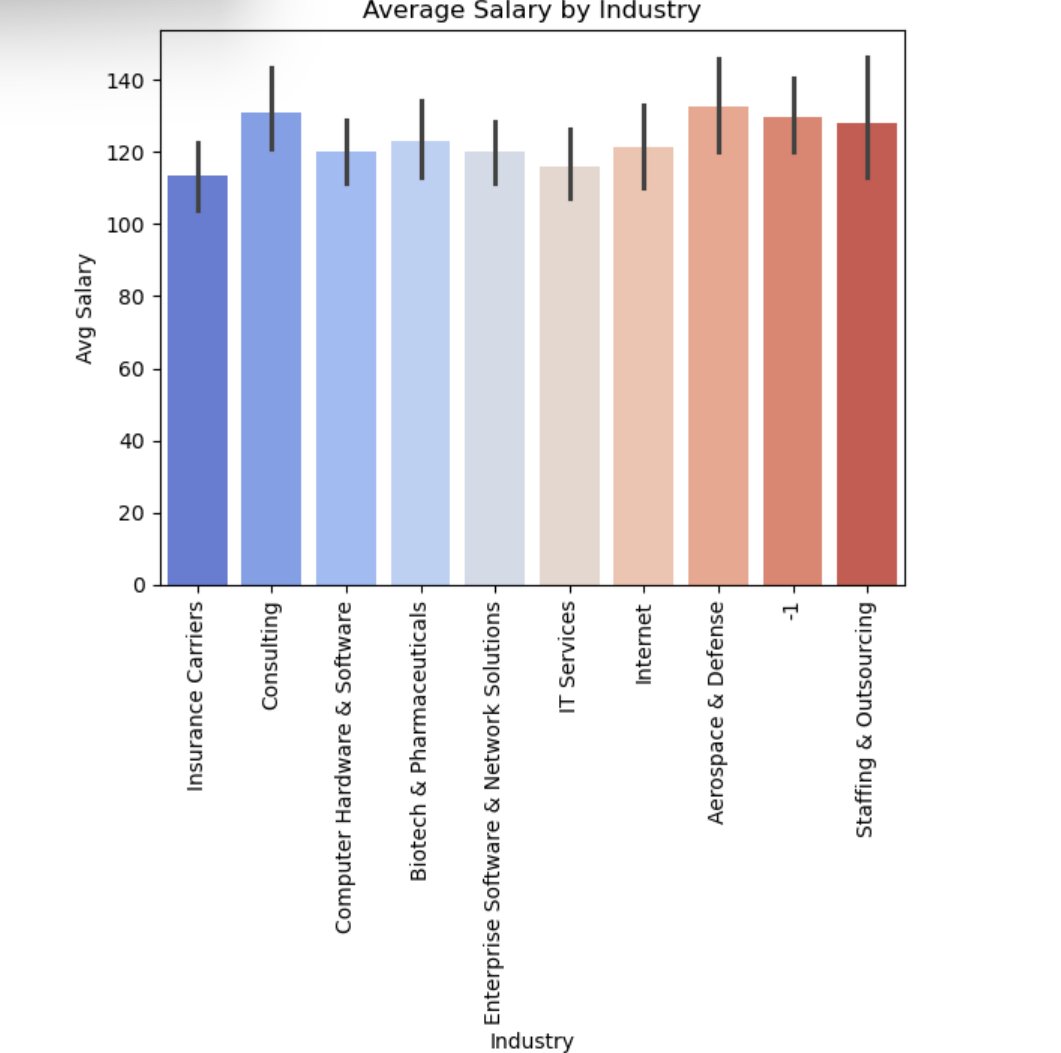
📉 Matplotlib for EDA
Histogram: Salary distribution 💰
Bar Chart: Top locations for Data Science jobs 🗺️
Line Plot: Salary trends by company size 🏢
Visualizing data brings numbers to life! 🔥


6
10 Feb 2025
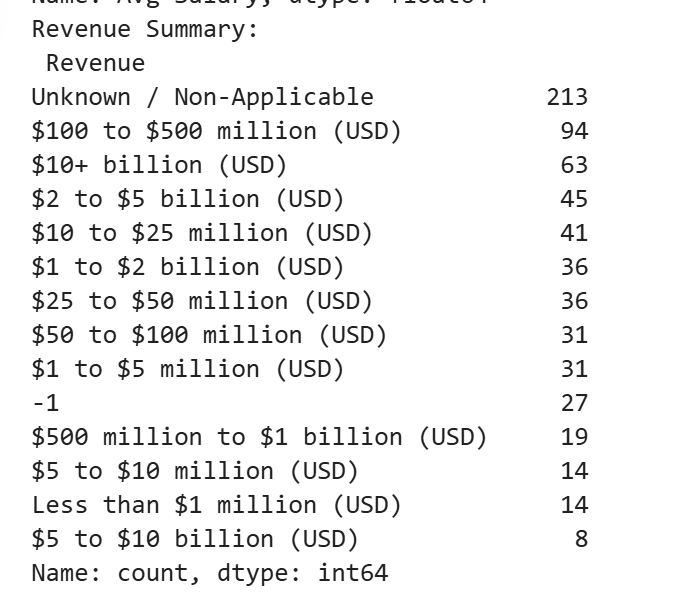
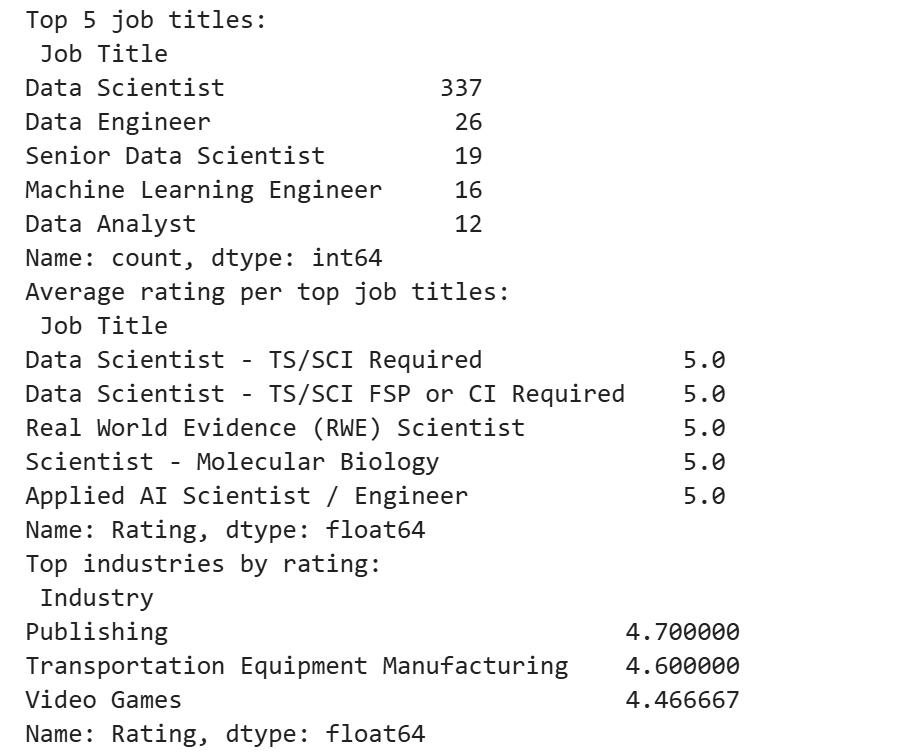
📊 EDA = Knowing Your Data
Summary stats for Rating, Salary, and Revenue
Identified top job titles & their average ratings
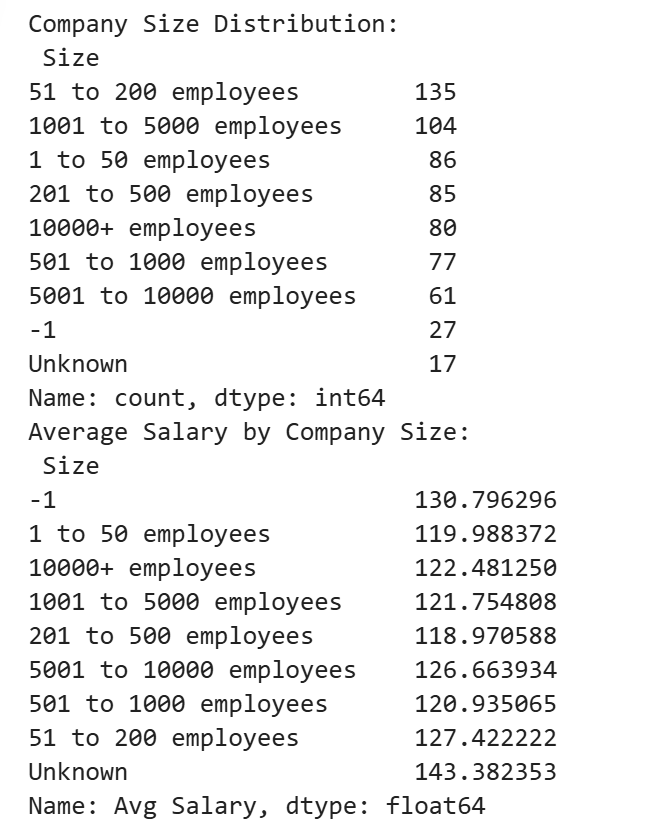
Analyzed salary trends by company size
EDA helps spot patterns & anomalies fast! 🚀
3
10 Feb 2025
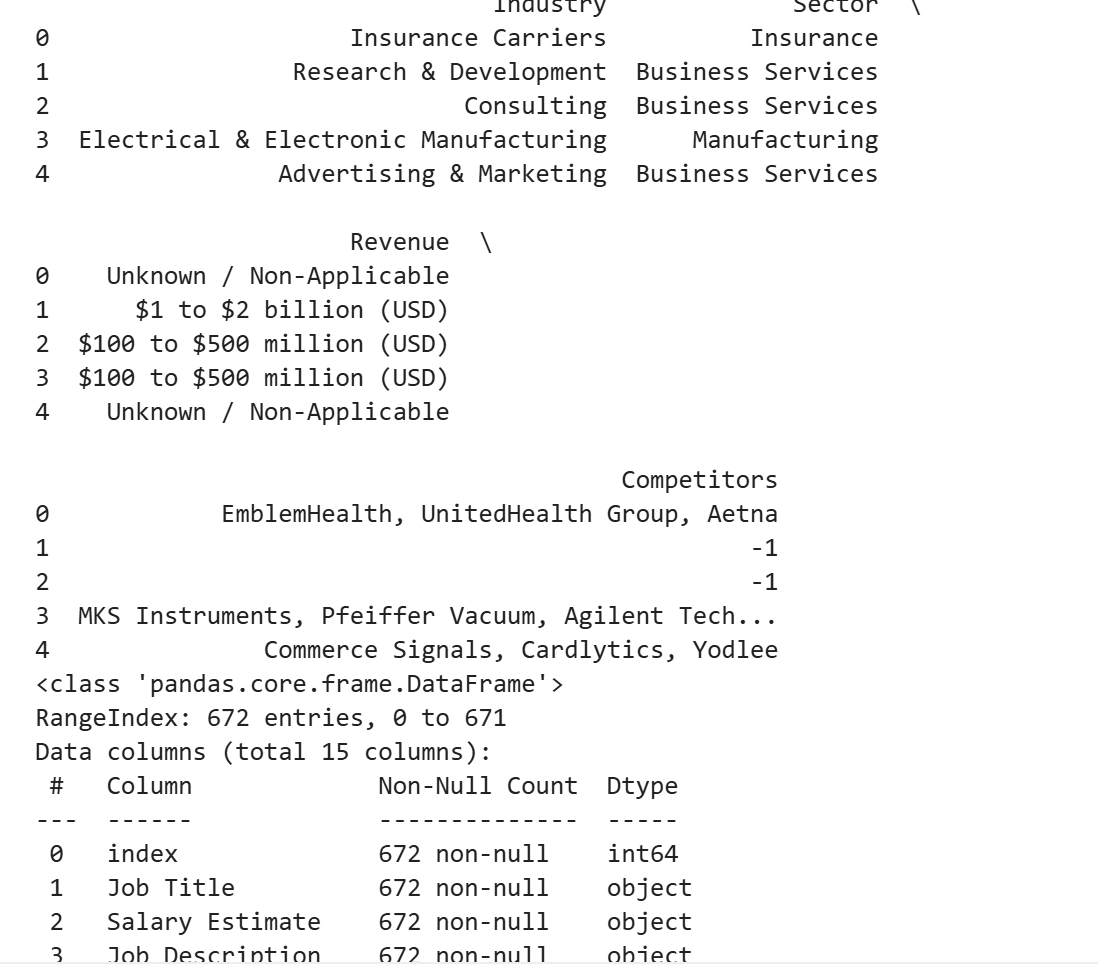
🧼 Data Cleaning is the foundation of good analysis!
Handled missing values 🕵️
Extracted & cleaned Salary Estimate 💰
Standardized Company Names & Locations 📍
Data cleaning = better insights! ✅
2
2 Feb 2025
🚀 Week 5 was all about Data Cleaning & Transformation with Pandas!
From handling missing values to merging DataFrames, this was a deep dive into real-world data prep. Let’s break it down! 🧵👇
11
4
2 Feb 2025
Wrap-Up & Full Notebook
✅ Data cleaned
✅ New features created
✅ Data merged
✅ Insights uncovered
This was real-world data prep at its finest! Check out my full notebook here:
🌐 hhttps://anaconda.cloud/share/notebooks/bab3f1ea-092c-4be5-ac0d-4b16fad8224e/overview
6
2 Feb 2025
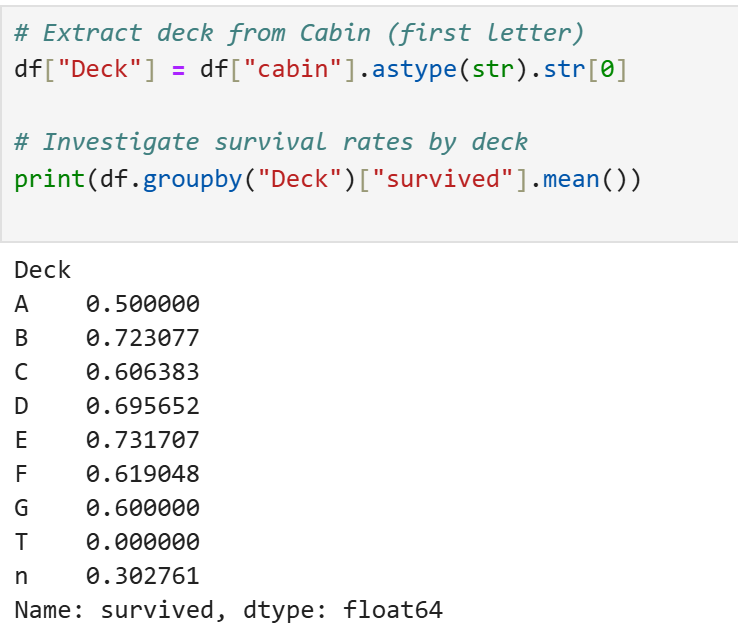
String Cleaning & Deck Extraction
🔡 Text manipulation in Pandas
I extracted the deck from the Cabin column to analyze survival rates by deck.
📷 Question ➡️ 📷 My Solution
Text data isn’t always clean—Pandas makes it easy!
7
2 Feb 2025
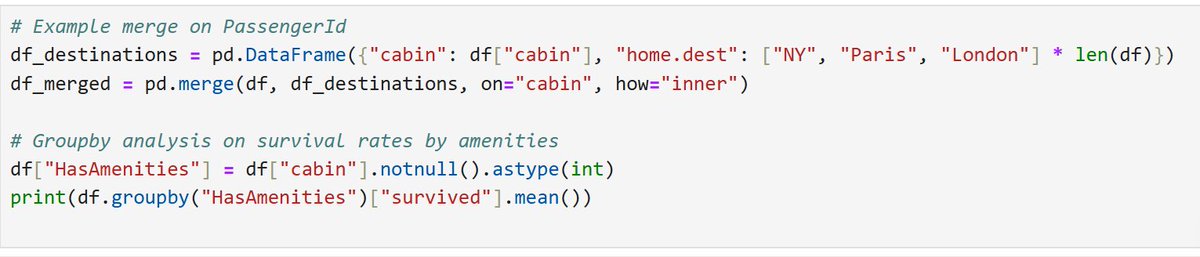
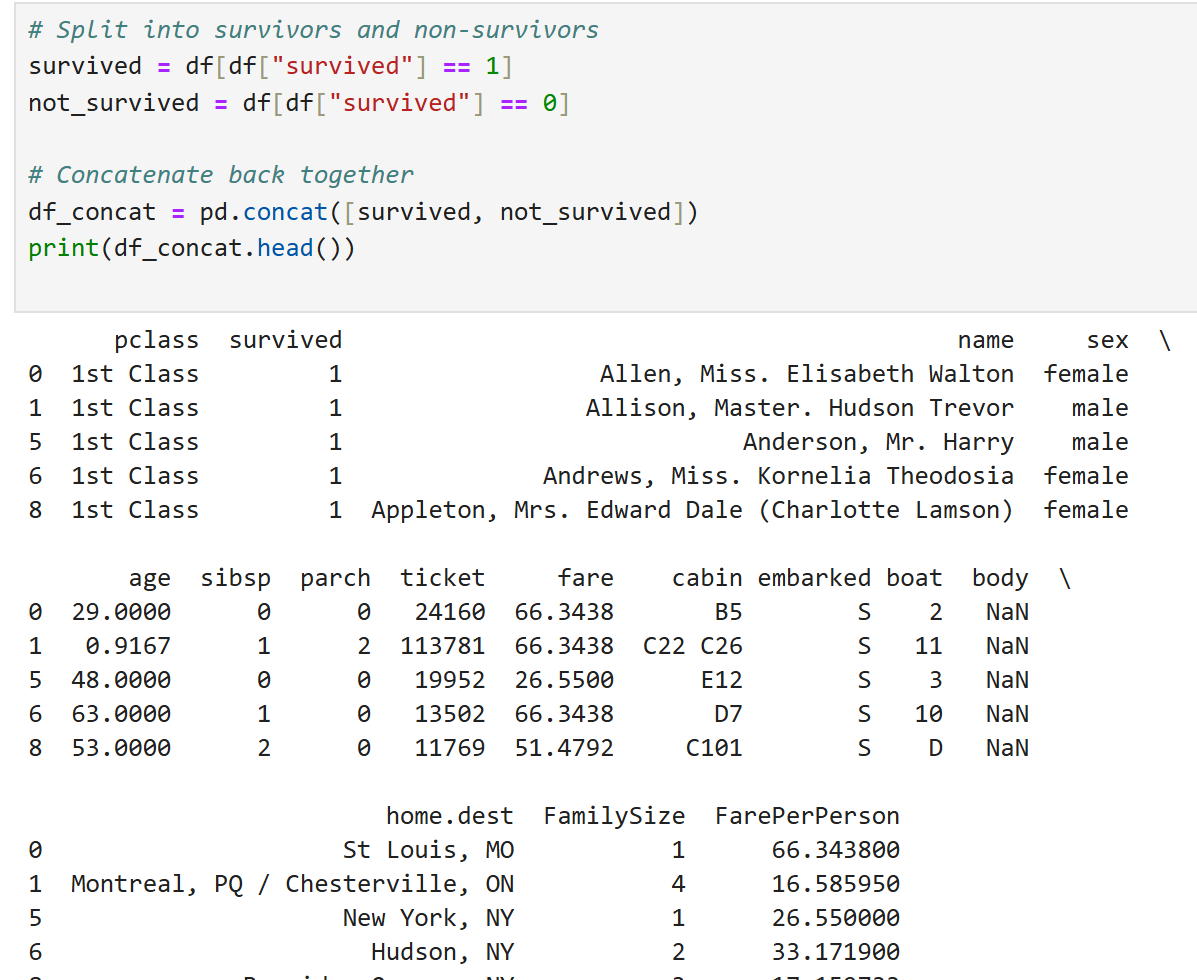
🔄 Merge vs. Concatenate?
merge() = Joins datasets on a key (like PassengerId)
concat() = Stacks datasets (vertically or horizontally)
📷 Question ➡️ 📷 My Solution
These techniques help when dealing with multiple data sources!
5
2 Feb 2025
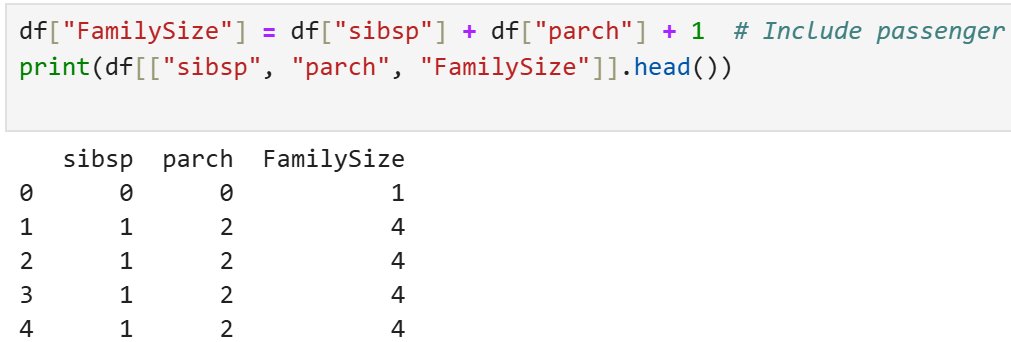
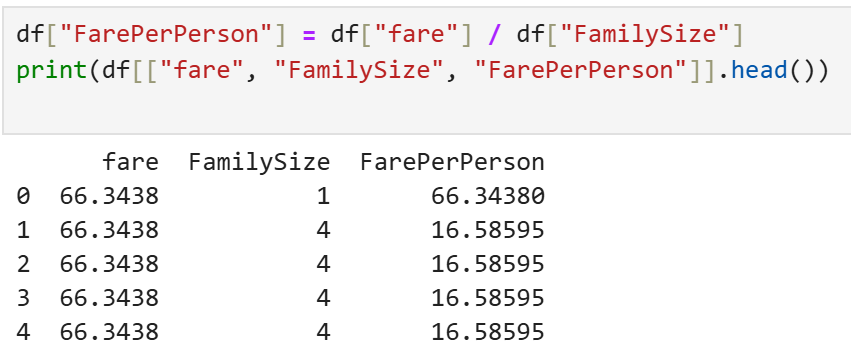
Creating New Features
🛠️ Feature Engineering
I added:
✅ FamilySize = (sibsp parch 1)
✅ FarePerPerson = Fare ÷ FamilySize
📷 Question ➡️ 📷 My Solution
Why? These features give new insights into passengers’ social & economic backgrounds!
7
2 Feb 2025
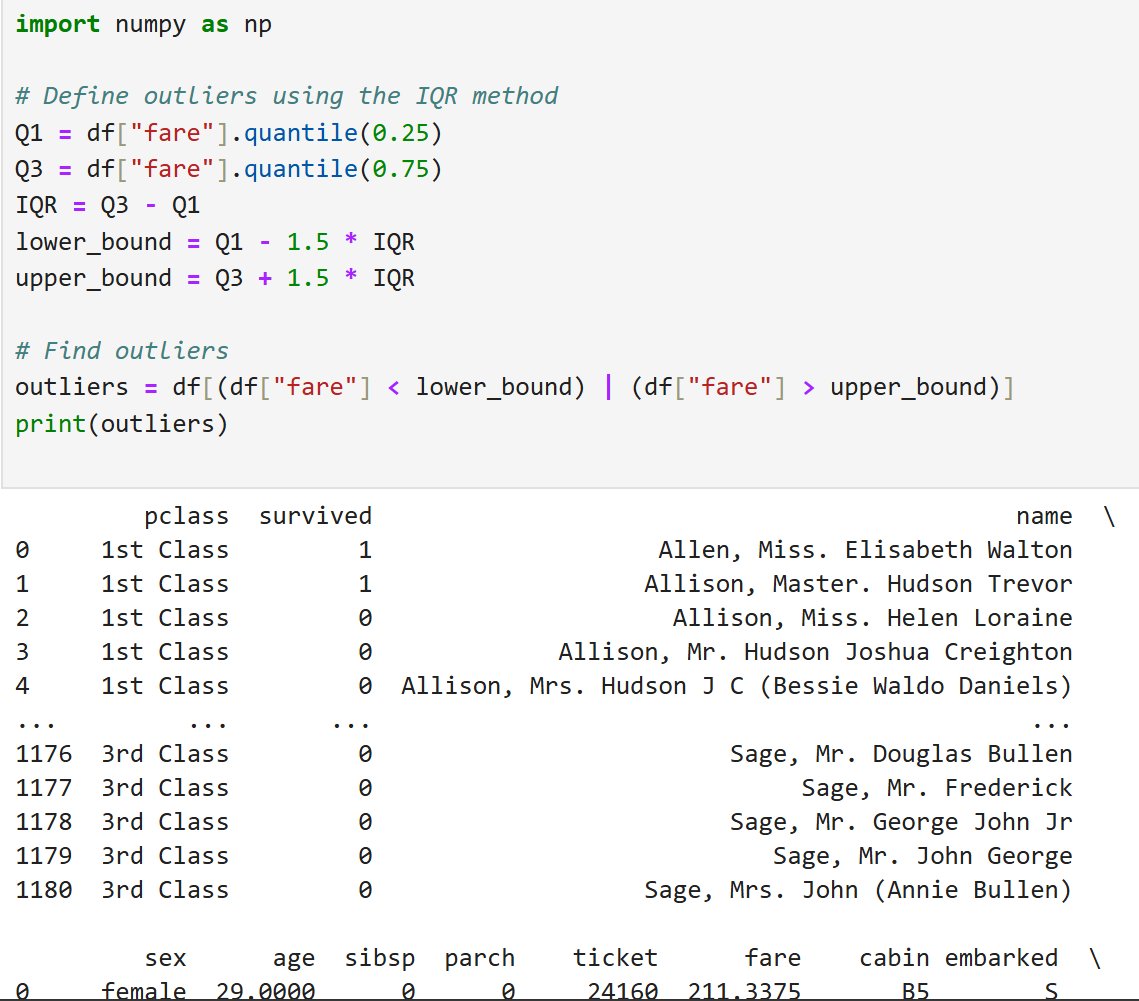
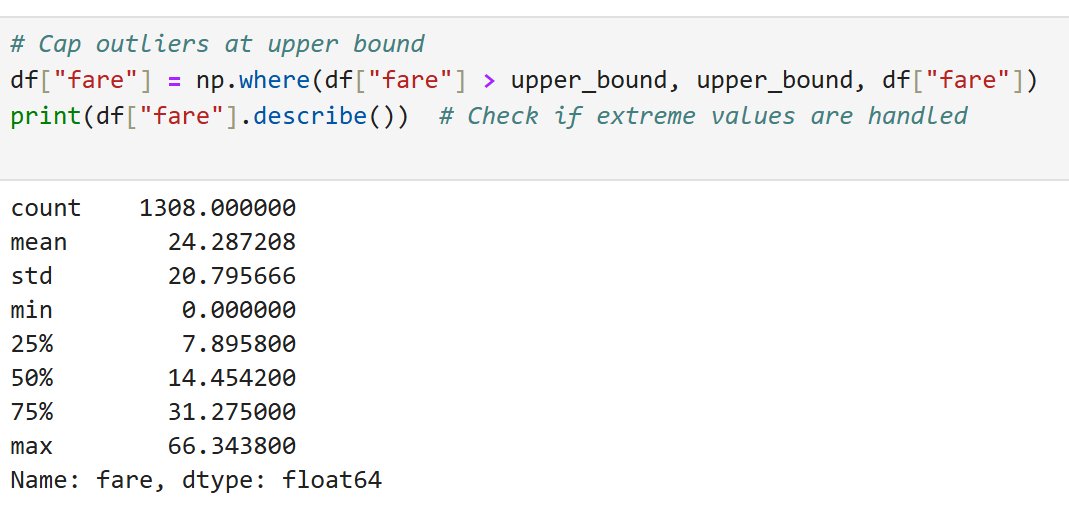
💰 Outliers distort averages!
I detected extreme fare prices using the IQR method and capped them instead of removing.
📷 Question ➡️ 📷 My Solution
Capping ensures we keep all data while limiting extreme values! 🛳️
4
2 Feb 2025
👀 Data transformation step!
Instead of 1, 2, 3, I converted Pclass into "1st Class", "2nd Class", "3rd Class" for better readability.
📷 Question ➡️ 📷 My Solution
Why? Clear labels improve data storytelling! 📊
3
2 Feb 2025
🔁 Duplicate records skew analysis!
Using drop_duplicates(), I checked and removed any duplicates in Titanic data.
📷 Question ➡️ 📷 My Solution
Have you ever encountered duplicate headaches? 🤯
2
2 Feb 2025
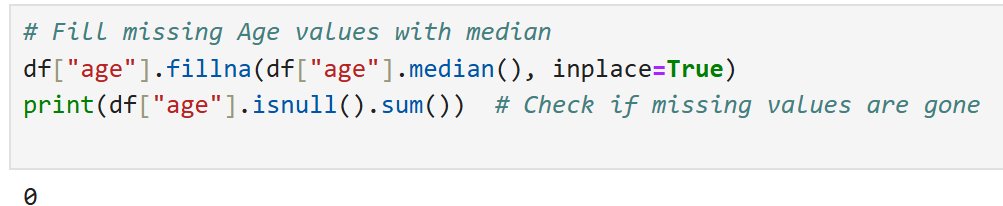
You may not know what to do with missing values...
🤔 Drop or Fill?
dropna() – Remove missing data (good if there’s little missing)
fillna() – Replace missing values (mean, median, etc.)
I used the median for Age to avoid outliers! 📷
3
2 Feb 2025
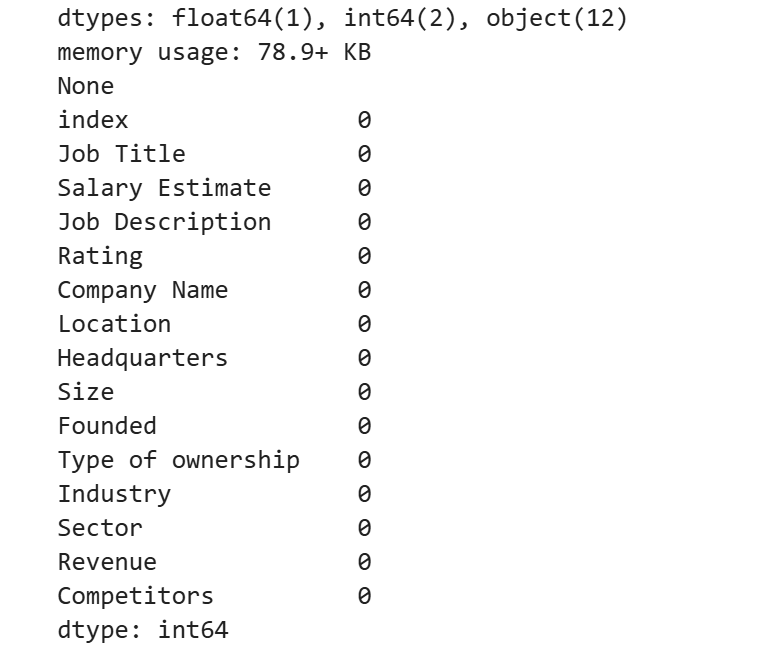
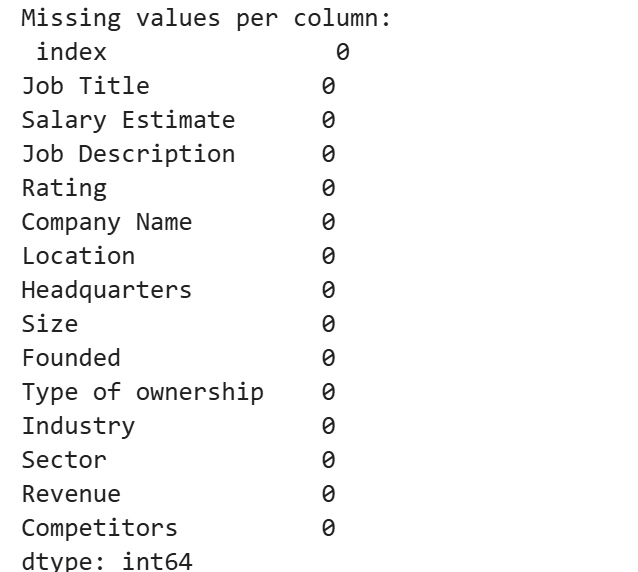
Finding Missing Data
🔍 Identifying missing values in the Titanic dataset using Pandas:
📷 Question ➡️ 📷 My Solution
Missing values can break analysis—step 1 is always detection!
3
2 Feb 2025
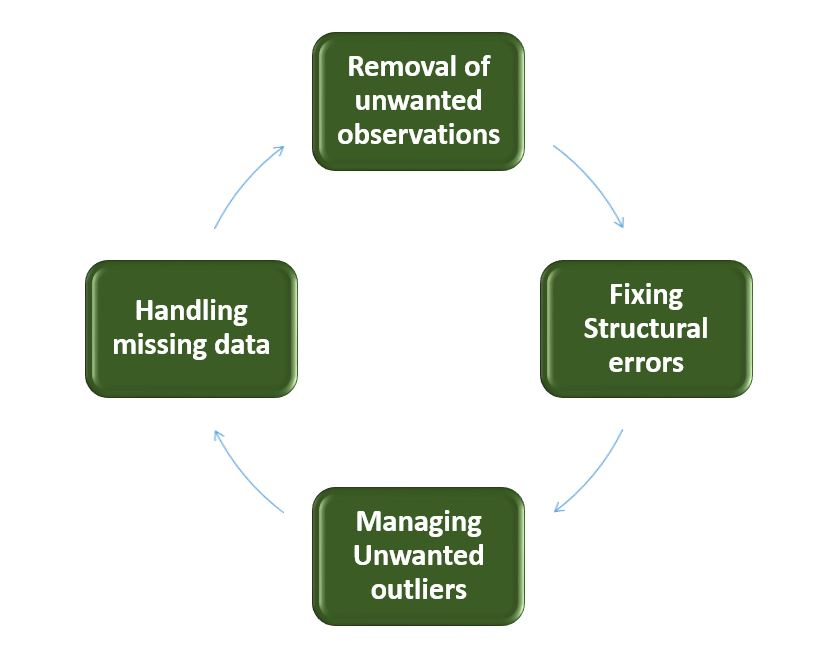
🧼 Why is data cleaning important?
Missing values can bias analysis 📉
Duplicates distort insights 🔄
Outliers skew statistics 📊
A clean dataset = better decisions! ✅
9
19 Jan 2025
🌟 Week 3 of my Python journey was all about diving into File Handling, CSVs, and NumPy! 🚀
From reading Titanic data to exploring arrays with NumPy, this week was packed with exciting tasks. Let’s break it down: 🧵
@DabereNnamani @TDataImmersed @JacobAjala #TDI

2
18
19 Jan 2025
That wraps up my Week 3 highlights! 🐍 Want to explore the complete code and dive into more details?
Check it out here:
🌐 anaconda.cloud/share/noteboo…
What was your favorite part? Let’s discuss! ✨
4
19 Jan 2025
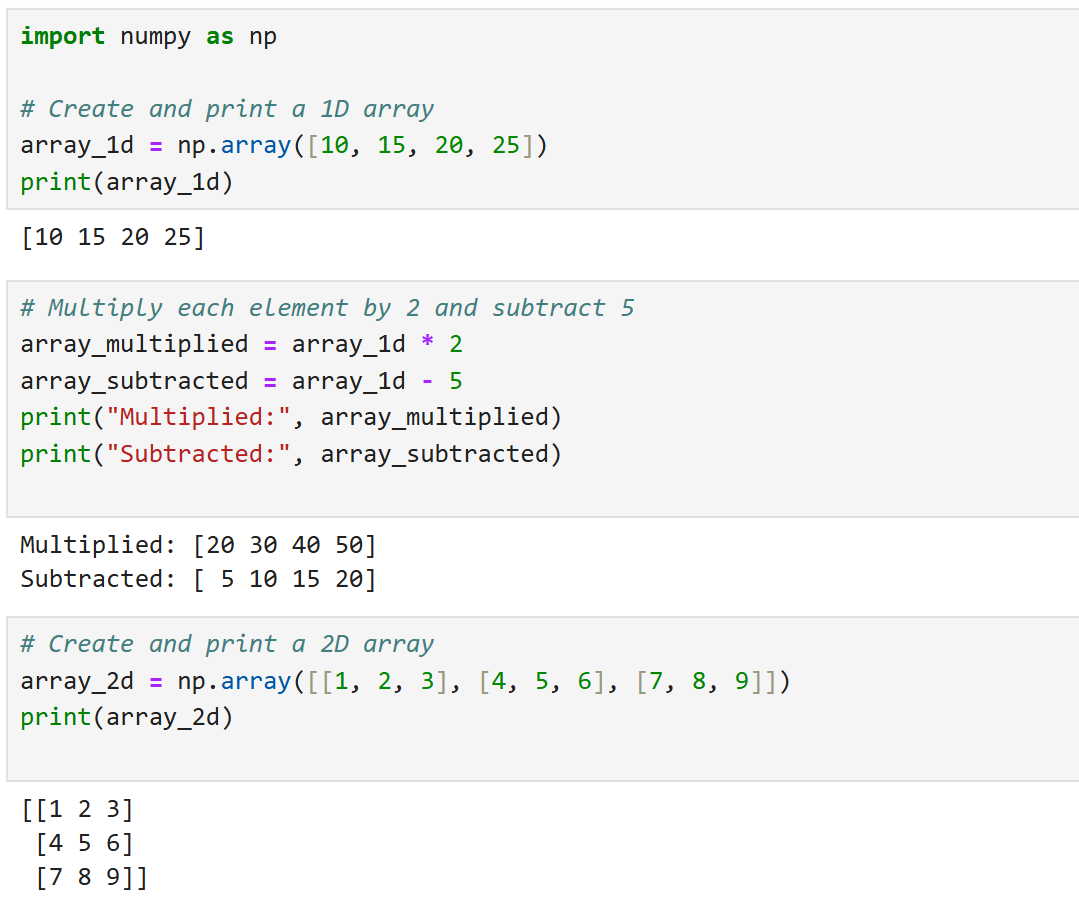
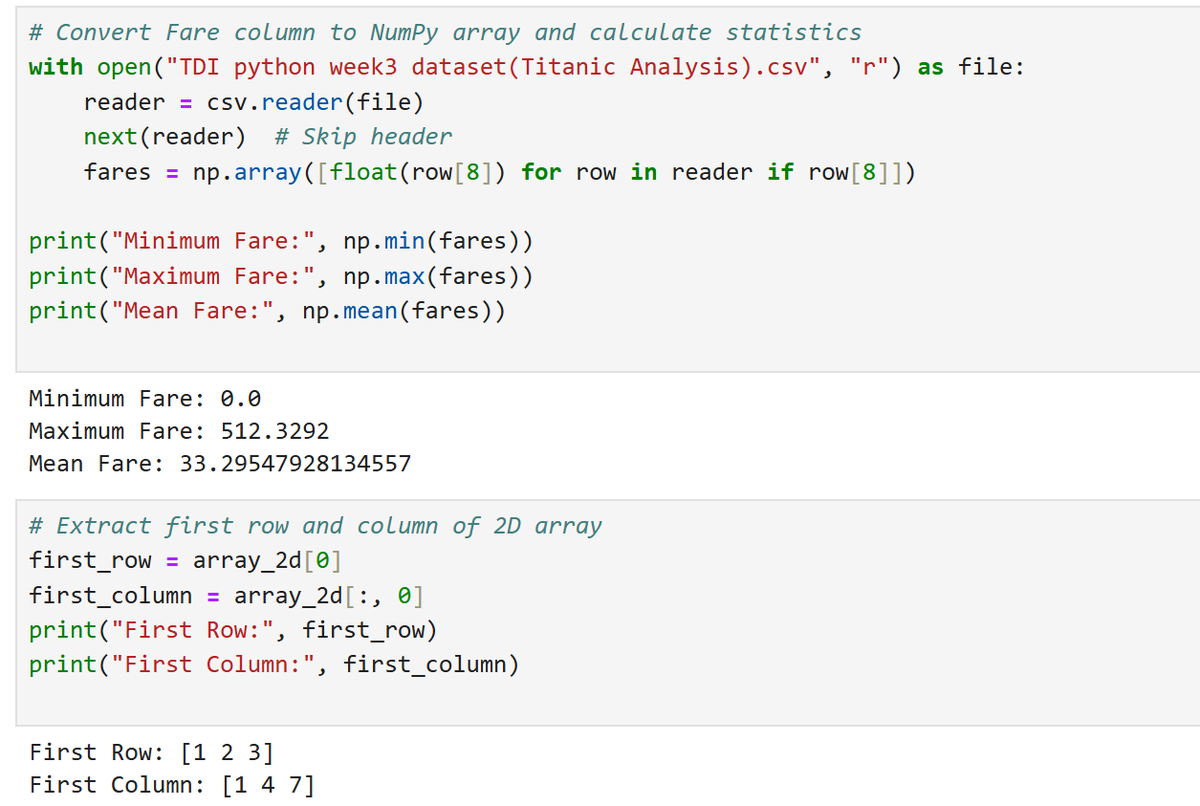
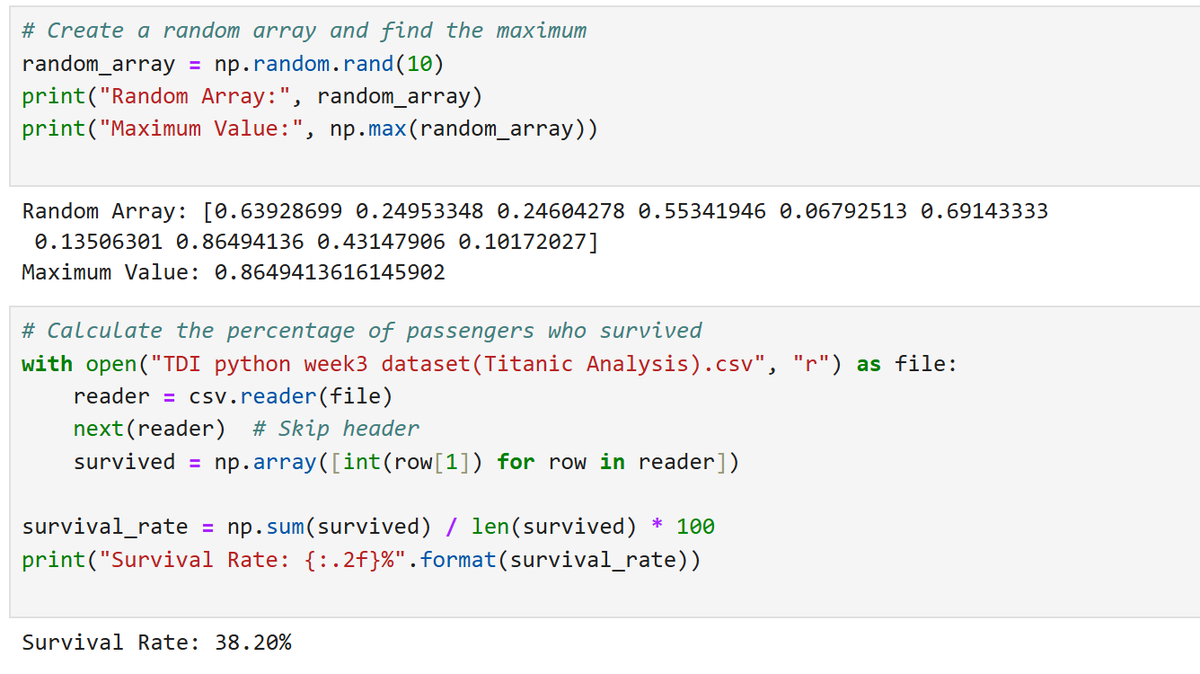
📊 NumPy Adventures
NumPy made math magical! I:
Built and manipulated 1D/2D arrays
Found fare stats (min, max, mean) for Titanic data
Explored indexing and random arrays 🎲✨
📷 Questions ➡️ 📷 My Solutions
How do YOU use NumPy? Let me know! 🐍
10