
Your daily dose of data visualization. Tweeting static and dynamic maps, charts and dataart. Please check the source provided with every tweet.
Joined January 2013
- Tweets 11,911
- Following 60
- Followers 1,324
- Likes 91
7,615 Photos and videos


14 Apr 2023
Animation showing how commercial farming is encroaching on migratory routes of Kenyan elephants
🗺 v.redd.it/nno2q34pwtta1 #map
215
14 Apr 2023
End of Nuclear power in Germany this week. Energy production from 2000 until today.
📈 reddit.com/r/dataisbeautiful… #dataviz
136
14 Apr 2023
A polarized media landscape: MSNBC vs Fox News - What stories are they highlighting or omitting over the last week (April 7 to April 13)? What are the focal points between the left and right on divided topics?
📈 reddit.com/gallery/12ksjpa #dataviz
140
14 Apr 2023
How big the sun and moon(s) appear to an observer on each planet - to scale!
📈 reddit.com/r/dataisbeautiful… #dataviz
158
13 Apr 2023
Admission times from Emergency Department to Ward in NHS England.
📈 reddit.com/r/dataisbeautiful… #dataviz
108
12 Apr 2023
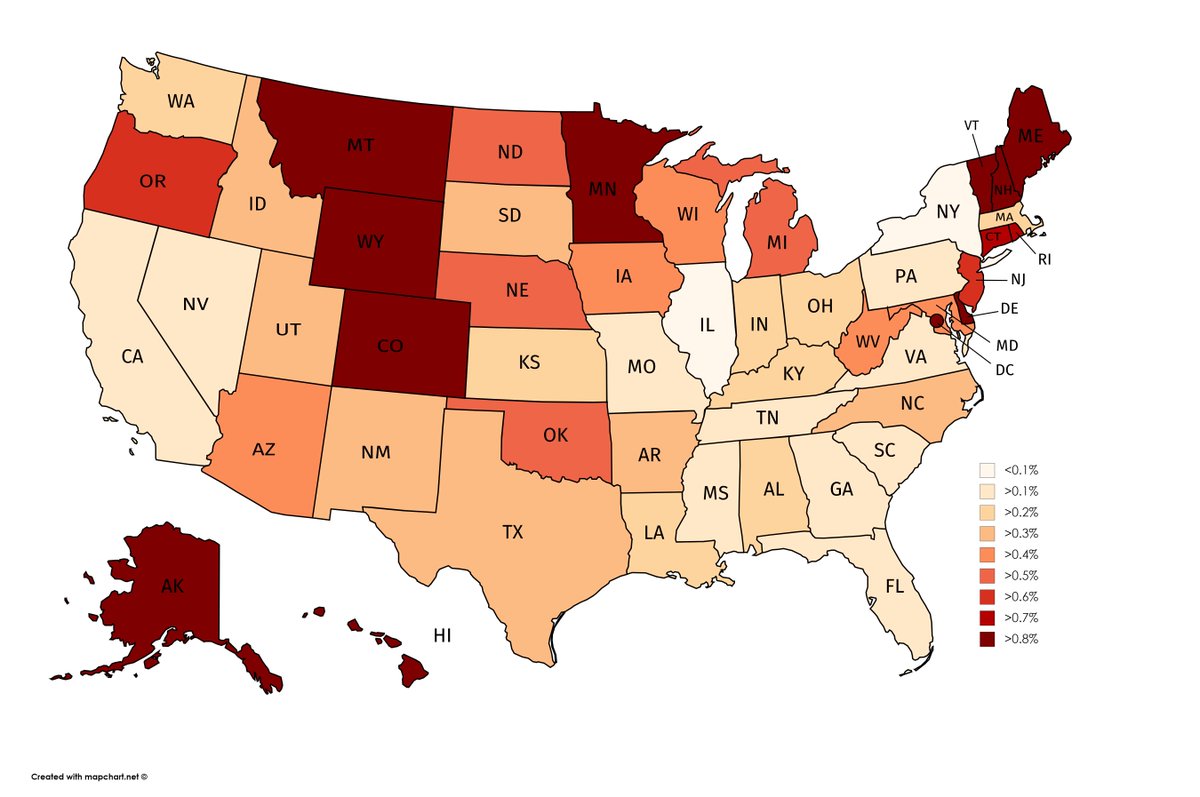
Drug Overdose Deaths per 100,000 Residents in America
📈 reddit.com/r/dataisbeautiful… #dataviz
103
12 Apr 2023
Every Pokemon Visualized — Analyze, Filter, Compare, And Find Similarities Across 9 Generations In Just A Few Clicks!
📈 v.redd.it/gekyssi8k9ta1 #dataviz
105
11 Apr 2023
Share of people who have never used the Internet in Europe (2010 – 2022)
📈 reddit.com/r/dataisbeautiful… #dataviz
92
6 Apr 2023
Visualising the Banking Crisis by looking at stock dispersion in the U.S.
📈 v.redd.it/tpu9lzmju8sa1 #dataviz
67
6 Apr 2023
Border Shared Between NATO and Russia Over Time
📈 reddit.com/r/dataisbeautiful… #dataviz
1
99
5 Apr 2023
Mountains in the Contiguous U.S. by Rise Above Surroundings / Jut
📈 reddit.com/r/dataisbeautiful… #dataviz
82
4 Apr 2023
The economic evolution of Europe - from 1870 to 2023
🗺 reddit.com/gallery/12bioh7 #map
79