
Connect to EUMeTrain and get informed on case studies, training modules, upcoming courses and interesting weather.
Joined August 2010
- Tweets 410
- Following 15
- Followers 587
- Likes 15
248 Photos and videos


Jun 12
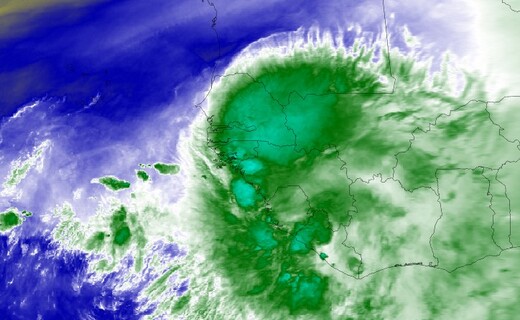
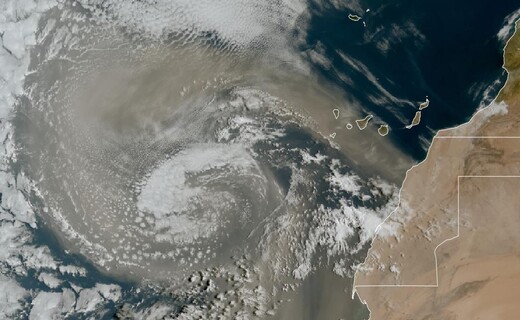
6.2 µm WV (color enhanced) – 12 June, 2026, 06:20 UTC – A strong easterly wave situated over West Africa is evident in this water vapor image, seen near the eastern limb of GOES-East’s view. The expanding cirrus canopy marks vigorous deep convection within the tropical wave. 1/2
1
1
78
Jun 12
These disturbances are monitored during the hurricane season as they can travel across the Atlantic and lead to the formation of tropical cyclones. According to the National Hurricane Center, about 85% of major hurricanes (category 3 or more) can be traced to tropical waves. 2/2
74
Jun 8
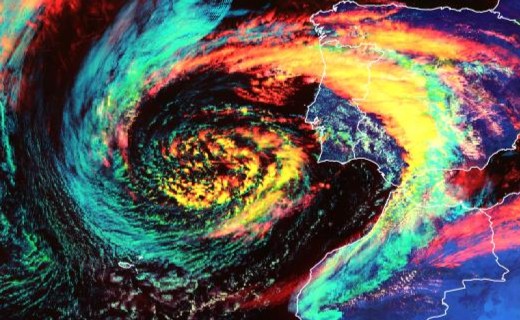
GOES EAST Airmass RGB 300z – 4 June 2026, 06:10 UTC - A low-pressure system has formed near the southern tip of South America, and the airmass product clearly reveals an upper-level PV anomaly in the upper layers, depicted in reddish tones. 1/2
1
1
91
Jun 8
An upper-level trough is also visible in the 300-hPa geopotential field. High-level, thick ice clouds are shown in white, while warmer air masses with low upper-tropospheric humidity are shown in dark green. 2/2
65
May 29
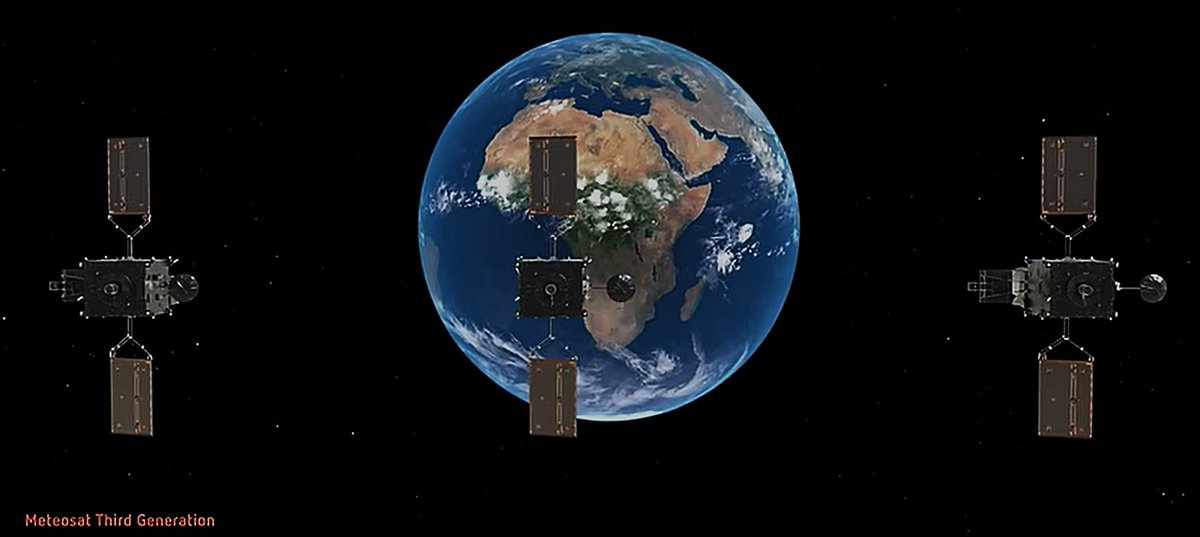
True Colour RGB - 25 May, 10 UTC - MTG satellite imagery shows mostly cloud-free conditions across large parts of Europe. The absence of cloud cover is consistent with stable anticyclonic conditions and subsidence, which suppress cloud development and favour strong heating. 1/2
1
4
248
May 29
Such a synoptic pattern contributed to the development of a heatwave across Europe, with the UK breaking its highest May temperature record. The MTG True Colour RGB combines red, green, and blue visible channels to create realistic colours as perceived by the human eye. 2/2
1
105
May 22
FCI 10 min IR Sandwich - 20 May 2026, 15 UTC - Between Finland and Russia, a cold front initiates convection in a warm and moist airmass. This convective multicell system was quite long-lived, with active convection starting at 10 UTC and lightning prevailing until nighttime. 1/2
1
3
118
May 22
The Sandwich product is very good at distinguishing deep convection during the day, and it shows the cloud top features well, for example, an overshooting top in the middle in orange. The more the colour leans red, the colder the cloud top. 2/2
48
May 22
The recording of the May weather briefing, presented by Andreas Wirth and Liliane Hofer from GeoSphere Austria, is now available online:
youtu.be/2eom1I2pqrQ
1
155
May 18
High Rate SEVIRI WV6.2 μm and Blended SEVIRI/LEO MW Precipitation and Morphologic Information – 11 May 2026, 18:30 UTC – Over central Europe, a precipitation area associated with a cold front can be seen, with locally enhanced precipitation within the frontal cloud band. 1/3
2
1
69
May 18
The product uses geostationary (GEO) IR images “calibrated” by precipitation measurements from MW images on Low Earth Orbit (LEO) satellites, making it useful for estimating rainfall rates at high temporal frequency. 3/3
1
64
May 18
High Rate SEVIRI WV6.2 μm focuses on the water vapour absorption band, by showing the area of high humidity with white tones. The highest precipitation amounts are visible in shades of blue in the Blended SEVIRI/LEO MW Precipitation and Morphologic Information product. 2/3
88
May 13
🛰️Advanced Satellite Course 2026🛰️
Deepen your specialist knowledge in satellite meteorology through a course designed for experienced forecasters in aviation and general meteorology.
Register by 26 June: forms.cloud.microsoft/e/VqKH…
Invitation letter: shorturl.at/A8LoR
1
129
May 6
🔥The registrations for the Forest fire event week are open. 🔥
Save the dates between 1st and 3rd June 2026 and register here:
docs.google.com/forms/d/e/1F…
Check out the agenda here:
resources.eumetrain.org/even…
1,275
May 6
Himawari Severe Storms RGB – 6 May 2026, 05:40 UTC – Tropical Storm 05W (FIVE) is located around 700 km south‑southeast of Guam and is currently moving west‑southwestward under the steering influence of a subtropical ridge to the northeast. 1/3
2
3
112
May 6
The low‑level circulation is exposed, with limited deep convection over the center. This structure reflects wind shear and the intrusion of drier air, which are inhibiting further organization. The Severe Storms RGB is useful for assessing convective severity and development. 3/3
1
46
May 6
In the Severe Storms RGB, deep convection appears in yellow to red colors with small ice crystals present at the cloud top level. The strongest convective activity is displaced to the western side of the circulation, where the strongest wind shear is also present. 2/3
44
Apr 29
The EUMeTrain Consortium is meeting in Helsinki at FMI from 28-30 April to discuss about the past & future training materials, courses and other project activites related to satellite meteorology.
🛰️⛈️🌨️
50
Apr 28
April weather briefing recording, presented by Zsófia Kocsis from HungaroMet, is now available online:
youtube.com/watch?v=u7enzDcK…
1
202
Apr 23
GeoColour RGB and LI Accumulated Flash Area – 19 April 2026, 16:30 UTC – A severe storm is pictured over northern Italy in the GeoColour RGB product and in its composite with the LI Level 2 Accumulated Flash Area (AFA) visualisation product. 1/2
1
1
91
Apr 23
In EUMETView, AFA shows the 5-minute flash count within the accumulated flash area by combining 10 half-minute AFA products. An overshooting top of the cumulonimbus can be seen overlapping with the area of the highest flash count, indicating the most active convective core. 2/2
63