In 2025, only 19.5% of ICT specialists in employment in the EU were women. 👩💻
Lowest shares:
🇨🇿 Czechia (12.9%)
🇭🇺 Hungary (15.0%)
🇸🇰 Slovakia (15.5%)
Highest shares:
🇷🇴 Romania (27.8%)
🇱🇻 Latvia (25.9%)
🇧🇬 Bulgaria (25.0%)
More👉 link.europa.eu/MXmfnb
ALT Eurostat bar graph showing Distribution of ICT specialists by sex, %, in EU countries and EFTA countries with available data, 2025.
In 2025, 63.6% of enterprises in the EU with 10 or more employees used any type of social media. 💬📱
Highest shares in:
🇲🇹Malta (88.2%)
🇫🇮Finland (87.6%)
Lowest shares in:
🇧🇬Bulgaria (41.5%)
🇭🇷Croatia (46.0%)
Read more 👉link.europa.eu/qrmk6K
ALT Enterprises using social media, 2025
(% of enterprises), EU and EFTA countries
In Q1 2026, labour market slack stood at 10.9% of the extended labour force aged 20-64, down from 11.0% in the Q4 2025. 💼
ℹ️ Labour market slack refers to all persons who have an unmet need for employment, including unemployed people.
More data ➡️ link.europa.eu/v6YDxr
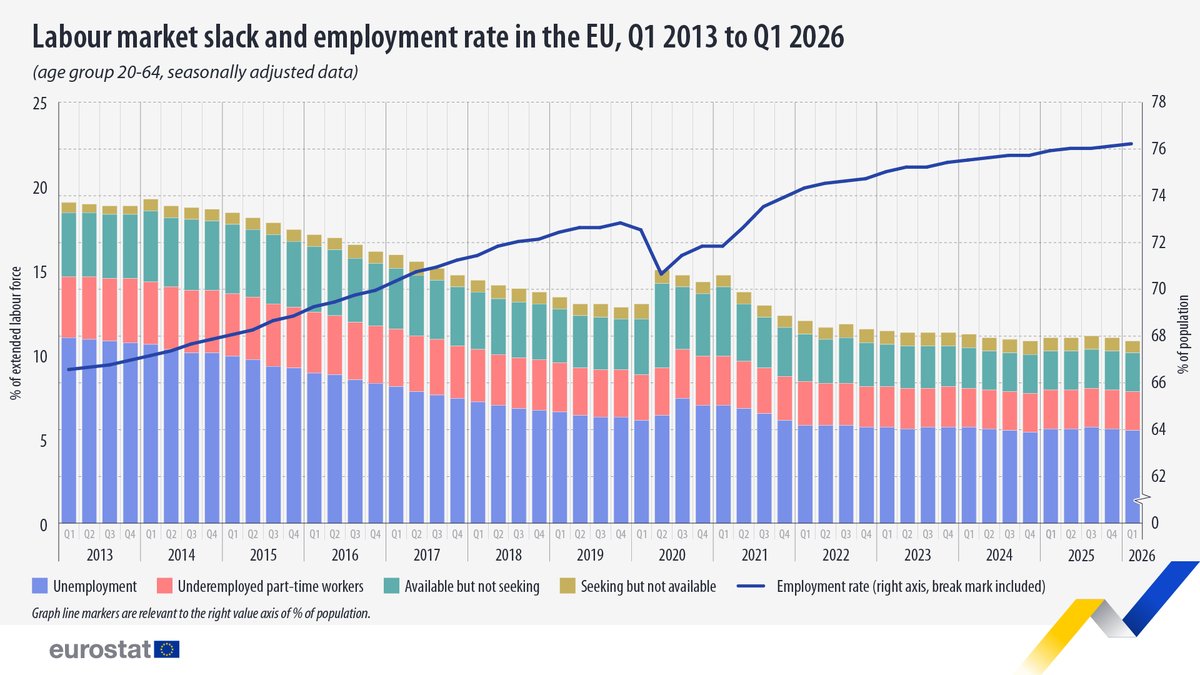
ALT Eurostat bar graph showing Labour market slack and employment rate in the EU, Q1 2013 to Q1 2026, age group 20-64, seasonally adjusted data.
In the first quarter of 2026, the employment rate of people aged 20-64 in the EU stood at 76.3%, up from 76.2% in the fourth quarter of 2025.
Highest increase:
🇮🇹 Italy ( 0.5 percentage points)
Highest decrease:
🇱🇻 Latvia (-0.8 pp)
More data ➡️ link.europa.eu/v6YDxr
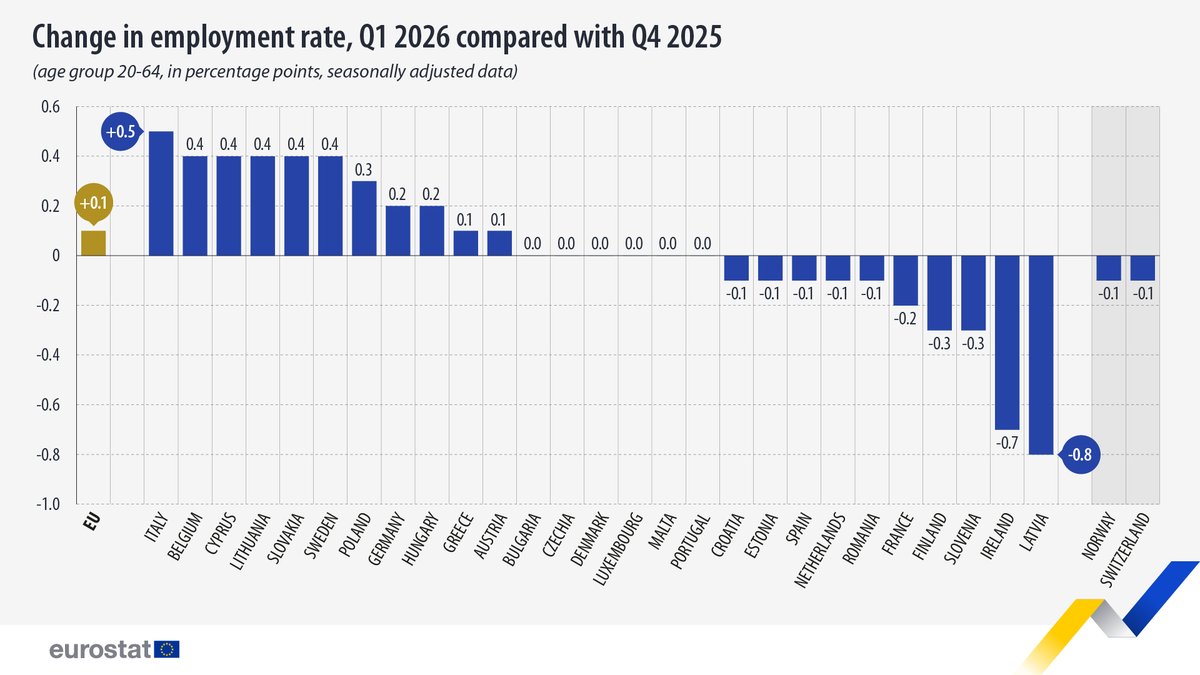
ALT Eurostat bar graph showing Change in employment rate, Q1 2026 compared with Q4 2025, age group 20-64, in percentage points, seasonally adjusted data in EU countries and EFTA countries with available data.
Between Q4 2025 and Q1 2026, 3 million unemployed people aged 15-74 in the EU found a job. 💼 📝
🔸7.1 million remained unemployed.
🔸4.2 million transitioned out of the labour force into employment.
See more 👉 link.europa.eu/HGbjqB
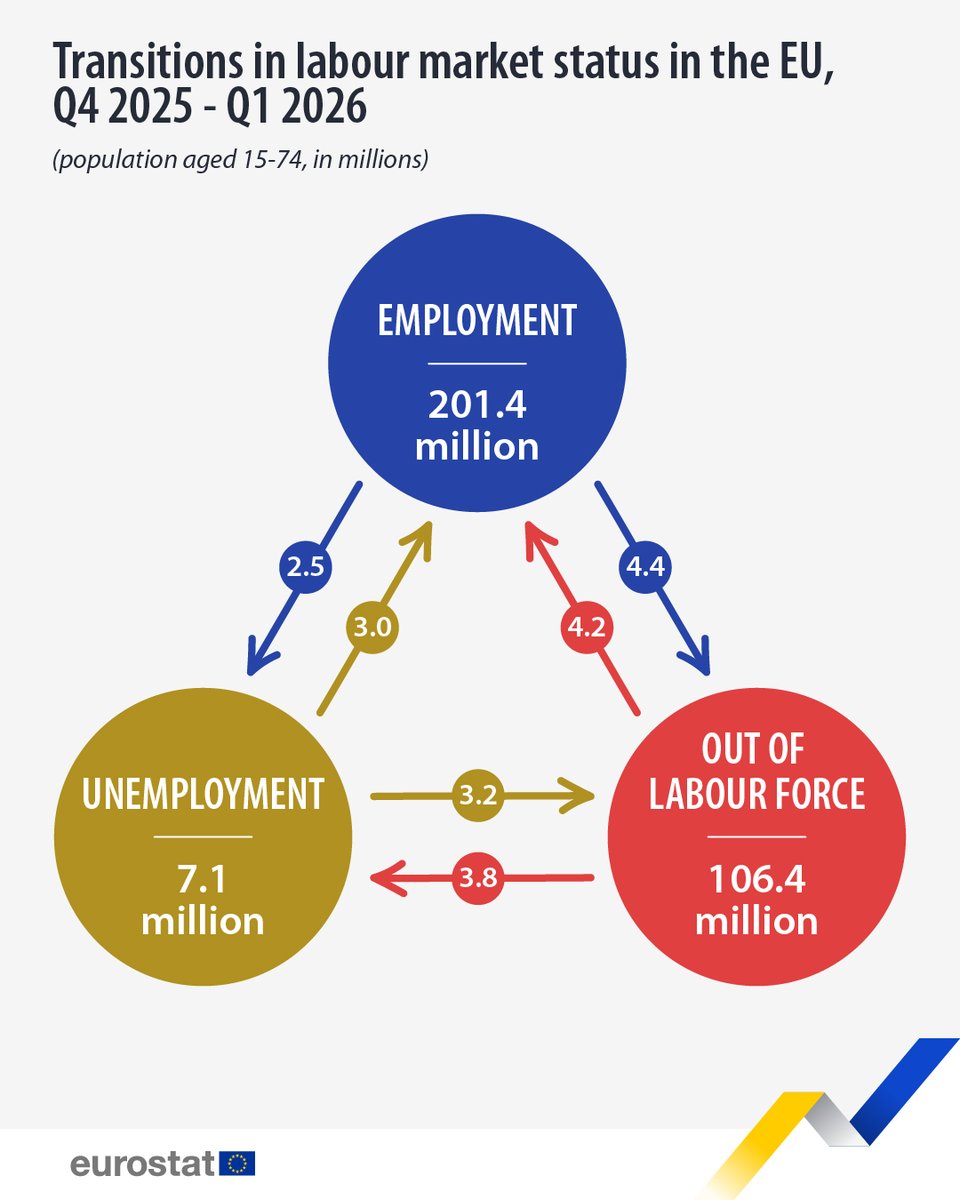
ALT Eurostat circle graph showing Transitions in labour market status in the EU, Q4 2025 - Q1 2026, population aged 15-74, in millions.
ℹ️The visual gives an overview of all possible transitions and changes in labour market status. Figures for employment, unemployment and out of the labour force refer to the number of people remaining in each status, while the arrows indicate those moving.
ℹ️ Outside the labour force includes people who are not employed, available to work, or seeking work (e.g. not-employed students, fully-retired people, care-givers).
In April 2026, the euro area seasonally adjusted unemployment rate was 6.3%, stable compared with March 2026 as well as with April 2025. The EU unemployment rate was 6.0% in April 2026, also stable compared with March 2026 and with April 2025.
More 👉 link.europa.eu/gkhBxP
In 2025, the unemployment rate of people aged 25 to 74 in the EU with low educational attainment stood at 10.5%.🎓📚
Highest unemployment rates for this group in:
🇸🇰 Slovakia (38.8%)
🇸🇪 Sweden (20.0%)
Lowest:
🇲🇹 Malta (3.2%)
🇳🇱 Netherlands (3.4%)
👉 link.europa.eu/xYmRTF
ALT Unemployment rate by educational attainment level, 2025
(% of labour force aged 25 to 74), EU and EFTA countries
Between Q1 2025 and Q1 2026, the sharpest declines in the average price of agricultural output across the EU were in:
🇧🇪Belgium (-12.9%)
🇩🇪Germany (-11.0%)
🇱🇹Lithuania (-10.8%)
Increases in:
🇲🇹Malta ( 14.8%)
🇭🇷Croatia ( 8.5%)
🇫🇮Finland ( 5.5%)
👉link.europa.eu/RtJ4Kc
ALT Change in quarterly agricultural price indices, 01 2026 compared with Q1 2025 (%) among EU countries
In Q1 2026, the average price of agricultural output in the EU decreased by 2.9% compared with Q1 2025.🚜📉
🔸The average price of goods and services currently consumed in agriculture (i.e. inputs not related to investment) changed little (-0.4%).
👉link.europa.eu/RtJ4Kc
ALT Developments of agricultural input and output price indicies in the EU, Q1 2021 - 01 2026
(% change compared with the same quarter of the previous year)
In 2025, the unemployment rate in the EU was 6.0% for people aged 15-74 in the labour force, up slightly from 5.9% in 2024.💼📈
Highest unemployment rate in:
🇪🇸Spain (10.5%)
🇫🇮Finland (9.7%)
Lowest:
🇨🇿Czechia (2.8%)
🇵🇱Poland and 🇲🇹Malta (both 3.1%)
👉link.europa.eu/xYmRTF
ALT Map showing unemployment rate in 2025 (% of the labour force aged 15-74), among Among EU countries, EFTA and candidate countries with available data.
On 30 April 2026, 4.37 million non-EU citizens who fled 🇺🇦Ukraine had temporary protection status in the EU.🛂
Highest number of temporary protection beneficiaries in:
🇩🇪Germany (1 279 660 people; 29.3% of EU total)
🇵🇱Poland (971 255; 22.2%)
👉link.europa.eu/byMtfj
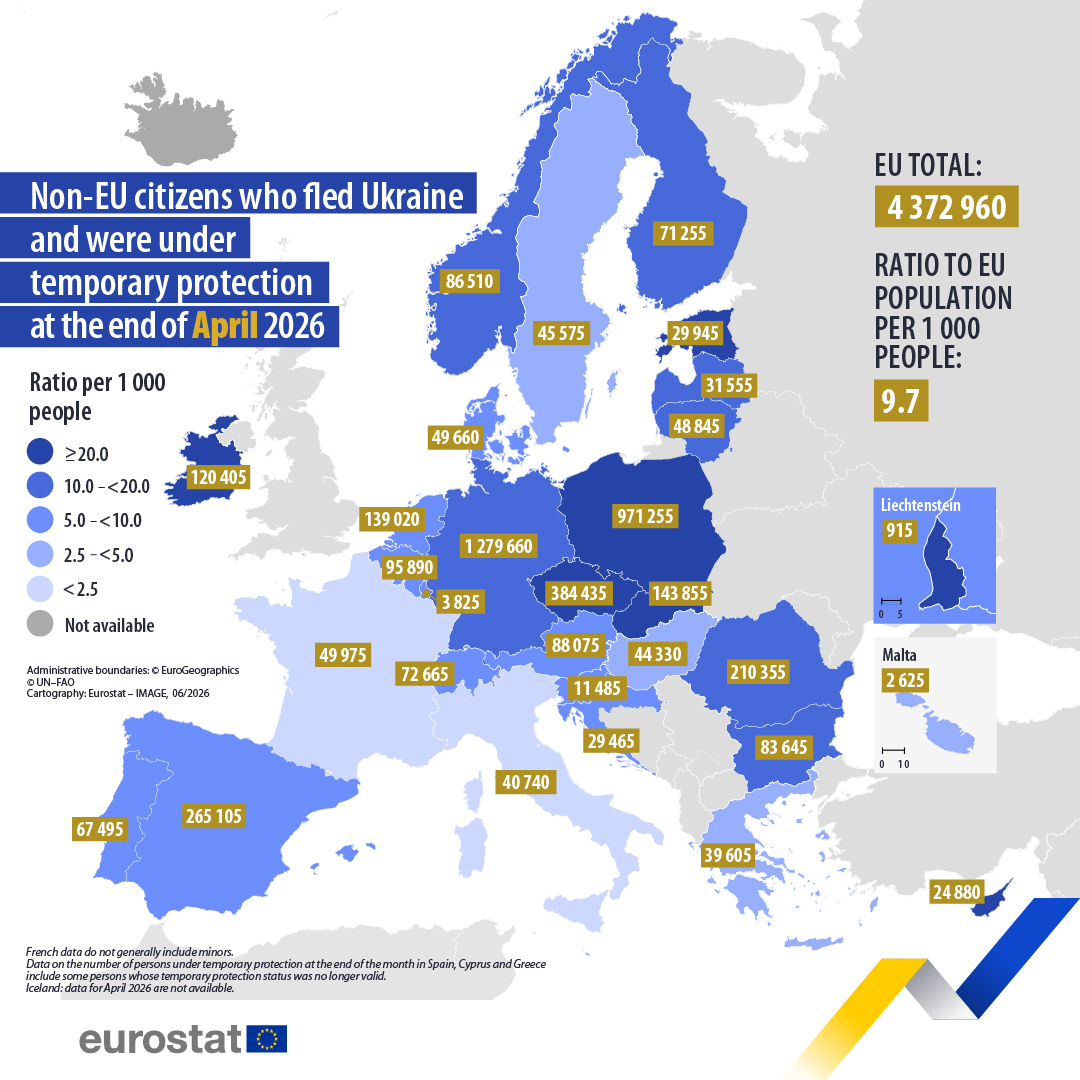
ALT Map showing Non-EU citizens who fled Ukraine and were under
temporary protection at the end of April 2026, among EU and EFTA countries with available data
In 2024, EU households used 9.54 million terajoules of energy. 🔌
Most of the energy was used for:
♨️ Space heating (61.5%)
🛀 Water heating (15.6%)
More data 👉 link.europa.eu/G8Y4gy
ALT Eurostat pie chart showing Energy consumption in the EU households, % by purpose, 2024
In 2024, the EU sold €10.4 billion worth of wind turbines. 💨
🔹From 2015 to 2023, the sold production quantity of wind-powered generating sets varied each year between 6 800 and 12 000, before increasing to 15 500 in 2024.
Read more 👉link.europa.eu/b7Fyp7#EUSEW2026
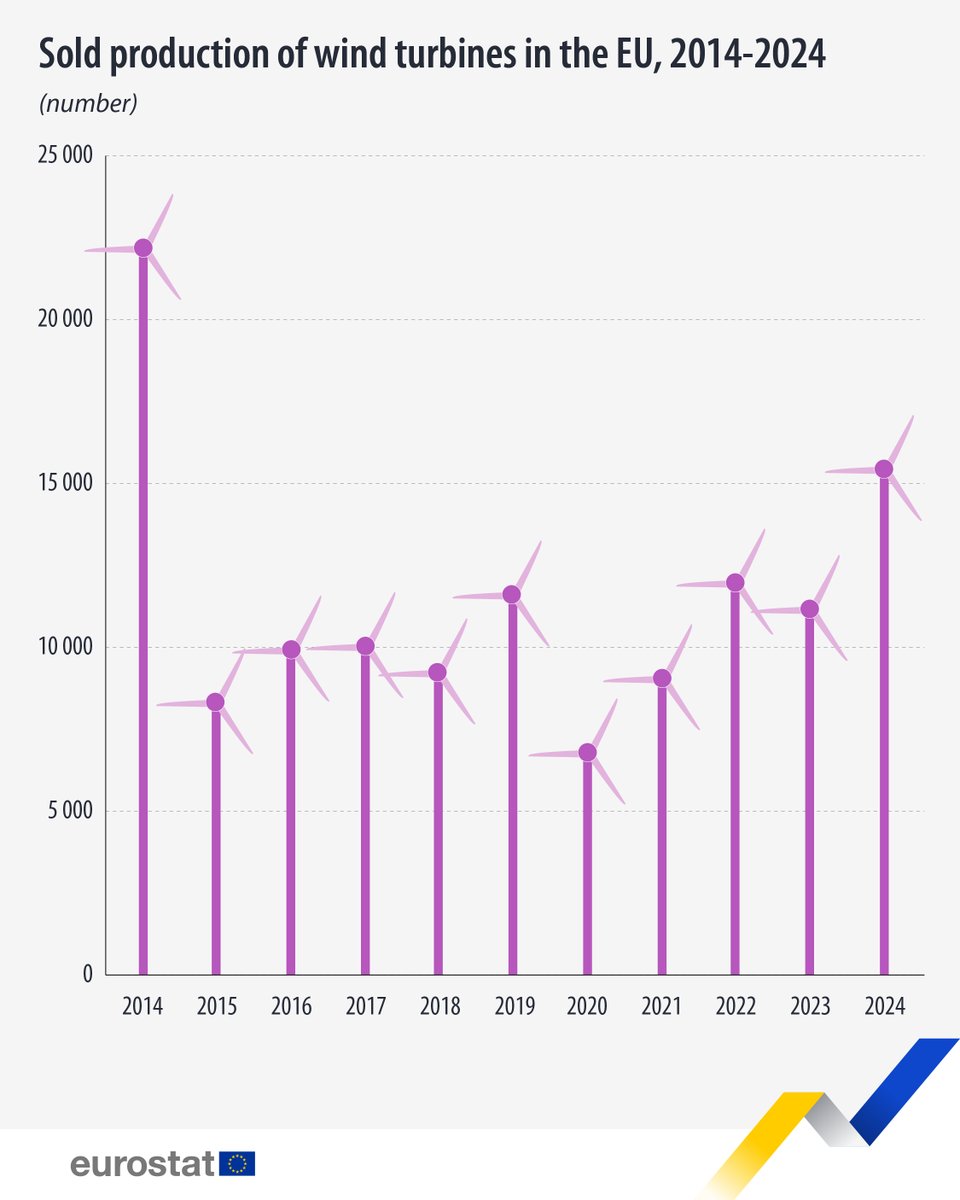
ALT Sold production of wind turbines in the EU, 2014-2024
(number)
The finalists for the 2025-2026 European Statistics Competition have been announced❗️ 🎊
🎥 Check out the finalists’ films 👉 youtube.com/playlist?list=PL…
🏆 Winners announced 25 June, streamed live on the European Statistics Competition website.
#esc2026stat@es_INE
VIDEO | Labour market — How do we calculate unemployment and employment? 💼🧮
Labour markets provide the structure through which workers and employers interact about jobs, working conditions and pay.
Watch the video 👉 youtu.be/I5Uc2X7YVQY
In 2024, 21.3% of EU enterprises engaged in international (intra-EU and extra-EU) trade in goods were two-way traders.↔️
🔹In terms of value, two-way traders accounted for the vast majority (95.4%) of all goods traded.
Read more👉link.europa.eu/QQtcB9
ALT Trade by type of trader and value in the EU, 2024
(% of number of enterprises and % of trade value)
In 2025, the EU exported 2.7 thousand tonnes of shark fins to countries outside the EU, worth €44.8 million. ↔️🦈
Main trade partners (shark fins):
🇸🇬Singapore (41.5% of trade)
🇨🇳China (40.9%)
🇭🇰Hong Kong (12.8%)
Read more 👉link.europa.eu/vPBtxg#WorldOceansDay
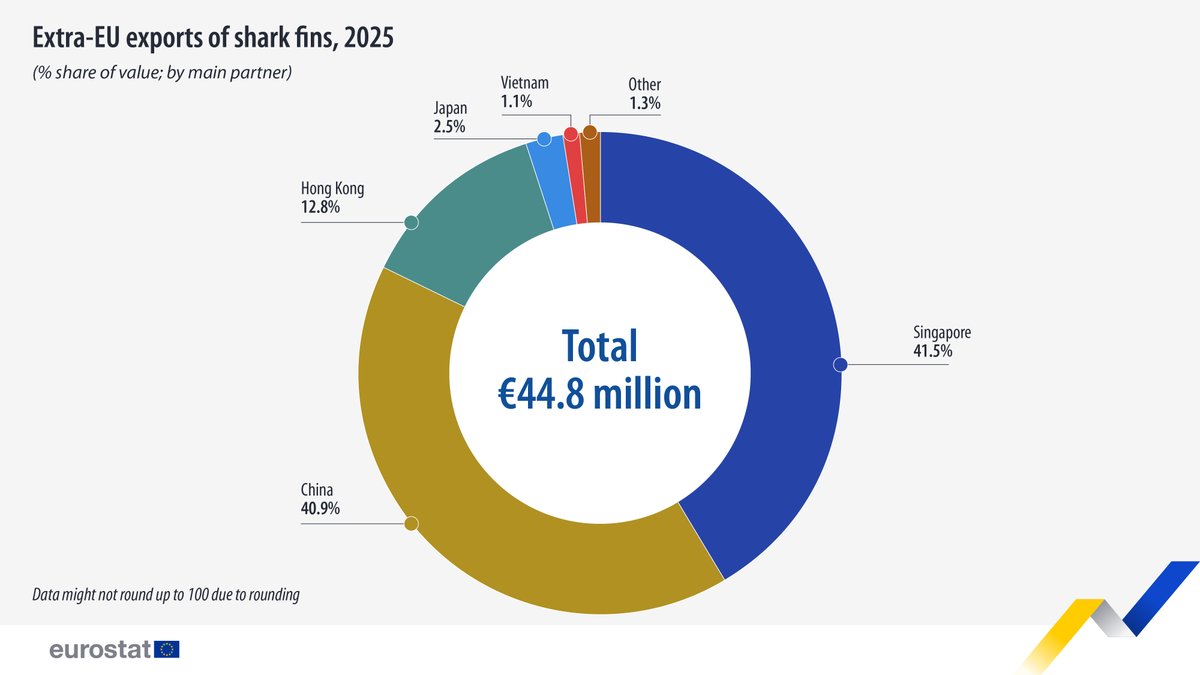
ALT Extra-EU exports of shark fins, 2025
(% share of value; by main partner)