
Joined October 2025
- Tweets 781
- Following 87
- Followers 725
- Likes 443
369 Photos and videos


Pinned Tweet

May 10
Introducing the ELSTATSLAB Match Center 🧵
A tool built around two questions every basketball analyst asks before and after a game:
Who has the edge, and in which area? How did the match actually unfold?
Here is what it does. 👇
elstatslab.com
#EuroLeague
2
1
6
1,758
Jun 12
Biggest piece of work I have published on this account.
EuroLeague aging curves, full version. 25 seasons, four visuals you have not seen before, and a long-form article that goes further than any thread could.
Non-nerds, do not be afraid. 😅
#EuroLeague #BasketballAnalytics

7
358
Jun 12
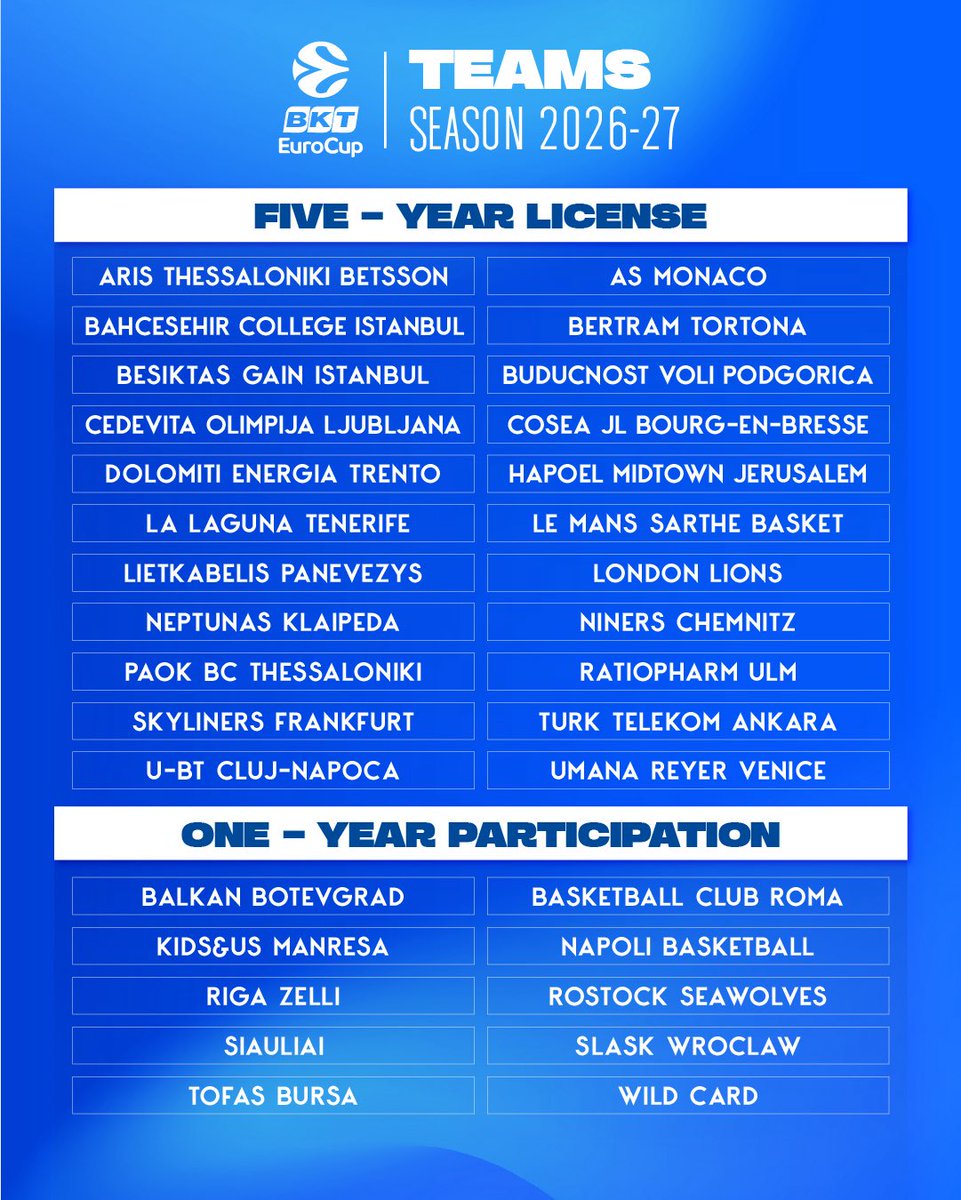
Next season, expect some EuroCup content on the account too.
EuroLeague remains the core focus, but the database is already built. More to come.

1
10
1,020
Jun 12
Concretely: at least one Efficiency Landscape per matchday (from Round 5, last 5 games rolling window) and at least one data-driven scouting piece per month.
1
195
Jun 11
🧬 EuroLeague Aging Curves | Episode 4 | TS% by Position
Does shooting efficiency improve with age?
I mapped the full distribution by age for Guards, Forwards and Centers across 25 seasons.
Guards: the only position that keeps improving. From 54.8% at 20-23 to 57.5% at 32-35. Forwards and Centers: remarkably stable throughout their careers.
25 seasons. Min 15 GP, 15 min/game.
#EuroLeague
206
Jun 10
🧬 EuroLeague Aging Curves | Episode 3 | Interior Players | OREB% & DREB% 👇
Different episode, different format.
For rebounding, a distribution view tells a richer story than a single aging curve. I mapped the full spread by age: median 25-75th percentile corridor.
What the data shows:
→ OREB%: peaks around 23-24, then slowly declines. Explosive rebounding fades with age.
→ DREB%: remarkably stable. Median holds at ~16-17% from 21 to 33. Defensive positioning doesn't age the same way.
Forwards & Centers with DREB% ≥ 12%. 25 seasons of data.
#EuroLeague
3
329
Jun 10
Having Mike James quote my post was great for visibility. But a reaction from @Sh_Cl_Pod, whose work is widely recognized, hits differently. That one genuinely means a lot.
More coming soon. 📊
Jun 9

Nice work!
15
8,355
Jun 9
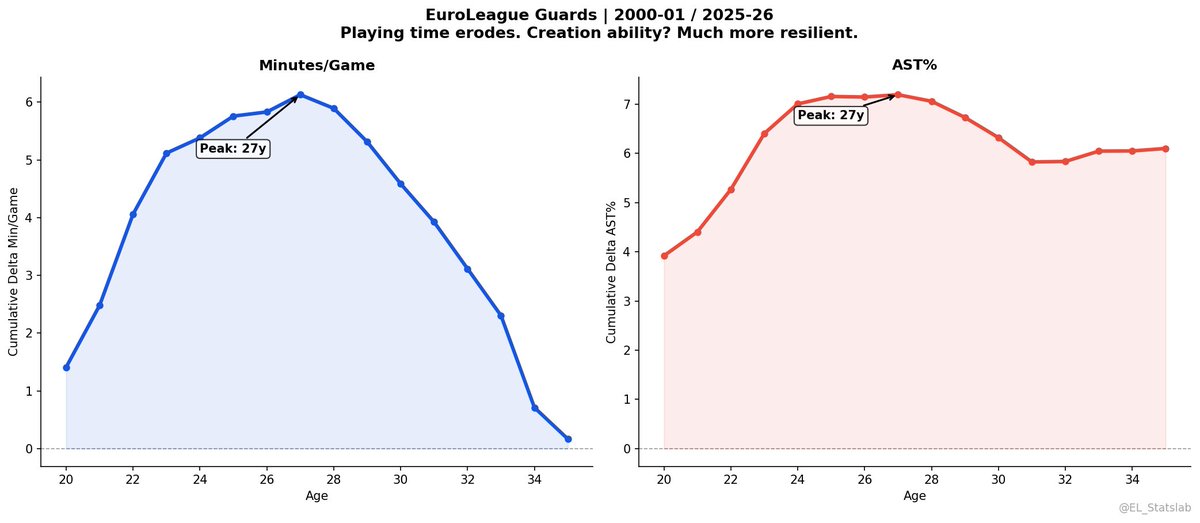
🧬 EuroLeague Aging Curves | Episode 2 | Guards | Minutes/Game vs AST%
Two curves. Same players. Different stories.
Peak minutes: 27. Peak creation: 27. But the decline after? Not the same at all.
The body fades. The vision stays. 25 seasons. Delta method.
#EuroLeague
3
17
4,301
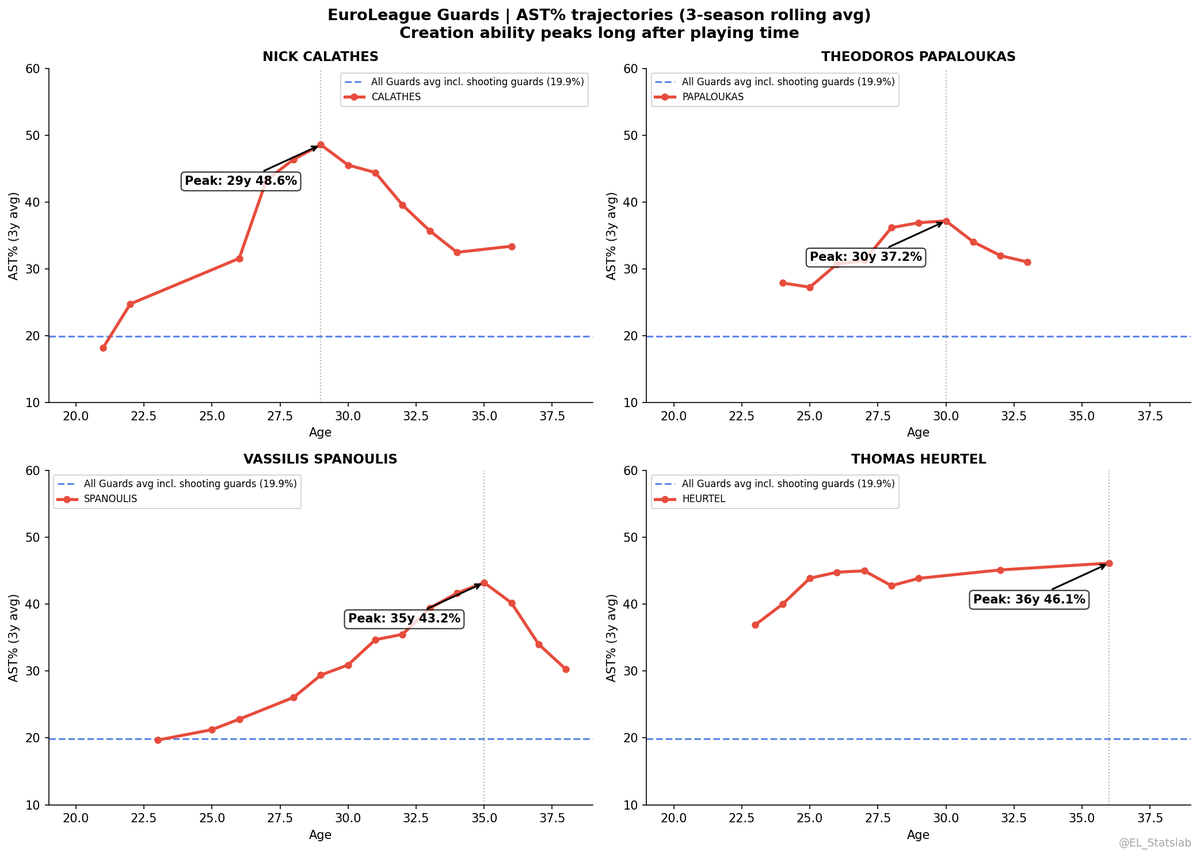
Jun 9
Four playmakers. Four different timelines.
All well above the Guards average (20%, all guard types incl. shooting guards).
→ Calathes: peak at 29 (48.6%)
→ Papaloukas: peak at 30 (37.2%)
→ Spanoulis: peak at 35 (43.2%)
→ Heurtel: peak at 36 (46.1%)
Note: curves are smoothed over 3 seasons to limit the impact of injuries or exceptional seasons.
1
3
330
EL_StatsLab retweeted

Jun 7
Washed
Jun 6
Mike James is actually a perfect outlier for this curve.
His prime runs from 29 to 32, peaking at ~31 min/game around 29-30. Way later than the EuroLeague median (26).
And what's remarkable: at 35, he's still averaging ~30 min. Most players at that age are at 20-21 min (league median).
A textbook case of a late bloomer who never really declined.
16
3
148
28,043
Jun 7
I also broke it down by position.
The result? Guards, Forwards and Centers don't age the same way at all.
Guards peak latest at 27. Forwards at 26. Centers earliest at 25.
Curves smoothed over 3 seasons.
#EuroLeague
Jun 6
🧬 EuroLeague Aging Curves | Episode 1 | Minutes/Game
When does an EuroLeague player truly peak?
I ran the delta method on 2,493 consecutive-season pairs across 25 seasons to find out.
The answer: 26. And the decline starts earlier than you think. 🧵
#EuroLeague
1
10
1,111
Jun 7
Three legends, three different timelines:
→ Spanoulis (Guard): peak at 29, 29.8 min. Guards can extend their prime well beyond the median.
→ Reyes (Forward): peak at 27, 25.5 min. Sharp and relentless decline after 28.
→ Tomic (Center): peak at 26, 23.5 min. Earliest of the three, consistent with the Centers curve.
Note: curves are smoothed over 3 seasons to limit the impact of injuries or exceptional seasons.
4
273
Jun 6
🧬 EuroLeague Aging Curves | Episode 1 | Minutes/Game
When does an EuroLeague player truly peak?
I ran the delta method on 2,493 consecutive-season pairs across 25 seasons to find out.
The answer: 26. And the decline starts earlier than you think. 🧵
#EuroLeague
2
1
19
2,636
Jun 6
The curve tells a clear story:
→ Ages 19-24: 2 min/game per year
→ Peak plateau at 24-26: 9.7 min vs age 19 baseline → Age 28: continuous decline begins
→ Age 33 : sharp drop, -1.5 min/year. The end is near.
#EuroLeague
1
2
684
Jun 6
Four legends, four different stories.
Note: curves are smoothed over 3 seasons to limit the impact of injuries or exceptional seasons.
→ Navarro & Llull: same peak age (26), same volume (~28 min). But Llull fell harder. Navarro declined more gracefully.
→ Sloukas: peak at 29, still above 21 min at 35. Late bloomer, slow decliner.
→ Vesely: the most consistent. A steady plateau from 18 to 30, peak at 30.
Same era. Same level. Very different aging profiles.
1
4
777
Jun 3
Just got back from a week in Madeira. Stunning island, proper break.
🔬 Now back to work. This summer is about long-term projects. Several topics on the list, one of them around player age in EuroLeague.
👀 More details soon.
5
371
May 25
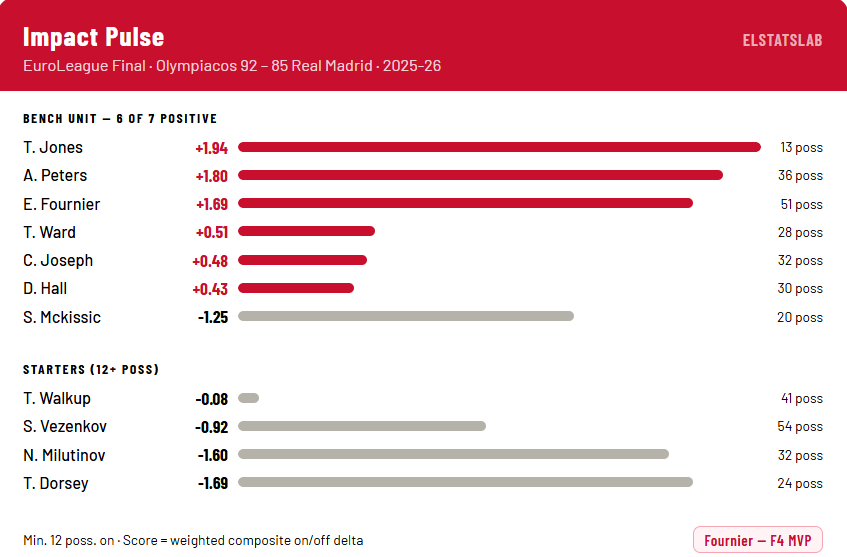
Olympiacos Impact Pulse | EuroLeague Final vs Real Madrid
Bench impact was a decisive factor in the championship game.
6 of 7 bench players who logged 12 possessions posted a positive score.
Fournier: Final Four MVP. Impact Pulse: 1.69.
#EuroLeague #OlympiacosBC #F4GLORY
1
3
9
687
May 24
🏆 Congratulations to Olympiacos on the 2025-26 EuroLeague title.
One year ago, EL_Statslab didn't exist.
Here's what got built in year 1:
→ A full Match Center at elstatslab.com
→ GameFlow visualizations with scoring run detection
→ Match Edge: a Monte Carlo win probability model (10,000 simulations per game)
→ Impact Pulse: a composite On/Off metric tracking the most impactful player per game
→ Shot charts, radar comparisons, efficiency landscapes
→ Best Lineup analysis by NetRtg
→ A box score scan every single game night
→ 25 seasons of EuroLeague data, all in one place
Built solo.
Thank you to everyone who read, shared, engaged, or simply followed along this season. Every interaction made this worth building.
Year 2 starts now. 👁️
#EuroLeague #Analytics
May 24

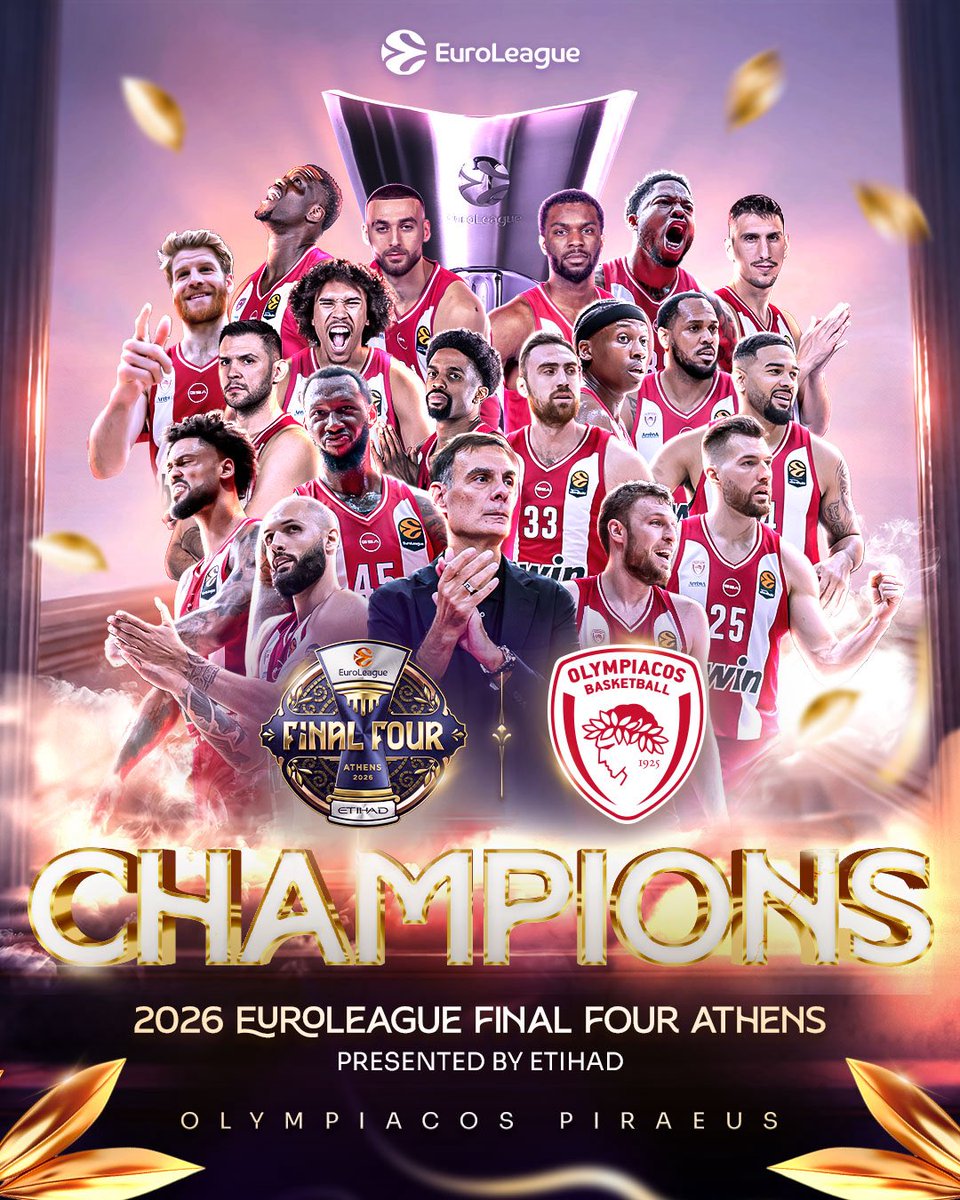
OLYMPIACOS ARE THE 2026 EUROLEAGUE CHAMPIONS 🏆 🔴⚪️
Congratulations to the reds, a first title since 2013 to cap off an amazing season!
#F4GLORY
1
6
338
May 24
Most points scored in a single EuroLeague Final (modern era).
📊 Larkin: 29 pts (2018-19) ❌
📊 Vezenkov: 29 pts (2022-23) ❌
📊 Melli: 28 pts (2017-18) ❌
📊 Ginobili: 27 pts (2001-02) ❌
📊 Rice: 26 pts (2013-14) ✅
The top 4 all lost.
#EuroLeague #F4GLORY
9
641