
Joined January 2021
- Tweets 12,793
- Following 743
- Followers 61,046
- Likes 20,537
6,819 Photos and videos


Pinned Tweet

6 Aug 2025
Excited to share—we’re now SEBI Registered!
After 2 years of consistently sharing insights on X, we received several inquiries about launching our own research services.
So, we decided to go ahead, get SEBI Registered, and launch our dedicated Research Desk, focused on uncovering high-growth opportunities in the Smallcap & Midcap space.
We're now also live on Smallcase!
There’s been a lot going on in the background over the last few months.
Thanks for the continued support—we’ll keep striving to add value!❤️
134
15
604
213,489
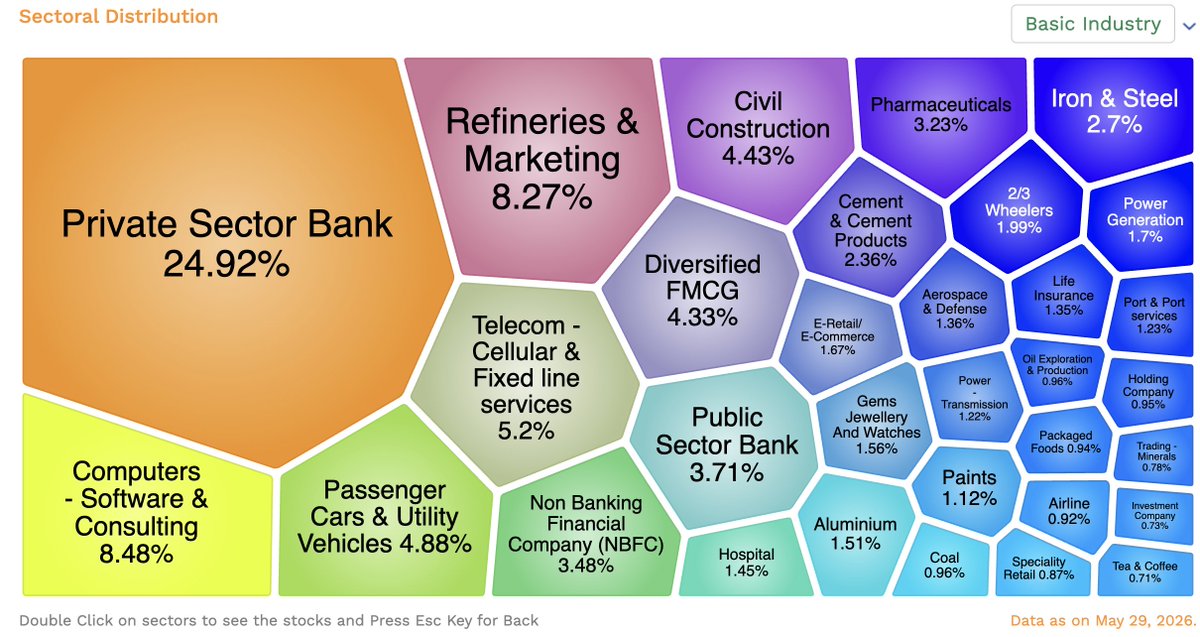
Nifty’s Technology weight has seen a sharp reset over the last few years
From 19.1% in Dec’21,Technology weight has now declined to 8.48%
Current IT weight in Nifty is mainly driven by:
Infosys - 3.77%
TCS - 2.14%
HCLTech - 1.16%
Tech Mahindra - 0.87%
Wipro - 0.54%
Together, these stocks now account for 8.48% of Nifty
The bigger point is that index composition is slowly changing
Wipro is also likely to be removed from Nifty50 as per reports. If that happens, IT weight will reduce further.
5
25
2,091
How Index weight have changed over time
x.com/EquityInsightss/status…

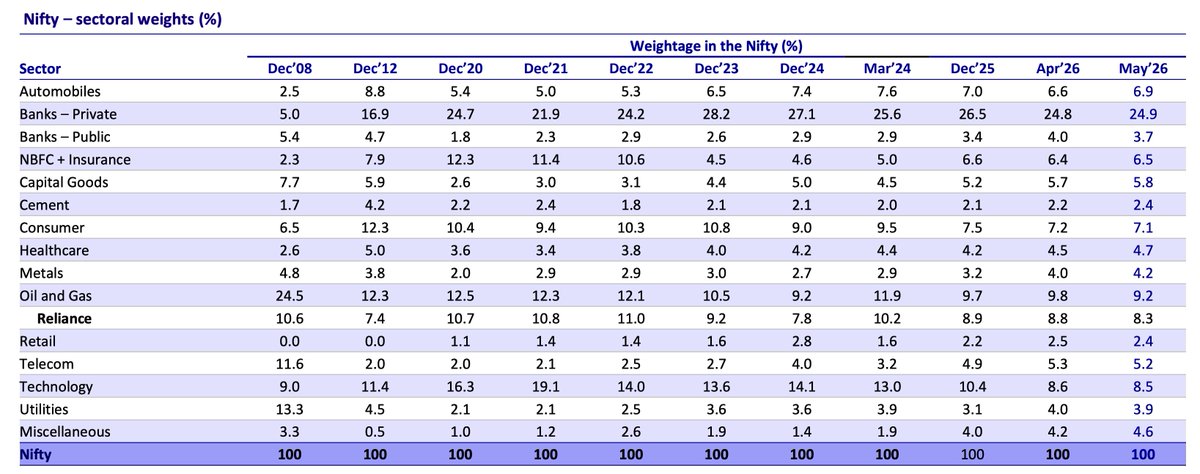
Nifty Sectoral Weight
Sectors where weight has increased recently : Telecom, Capital Goods, Metals, Healthcare
Sectors where weight has decreased : Technology, Consumer, Oil & Gas, Private Banks
Nifty is still heavily driven by financials, with Private Banks, Public Banks and NBFC Insurance together contributing 35%
Nifty continues to remain heavily dependent on Financials, Oil & Gas and Technology
Although Technology & Consumer weight has reduced meaningfully from the peak
src : MOFSL
3
1,120
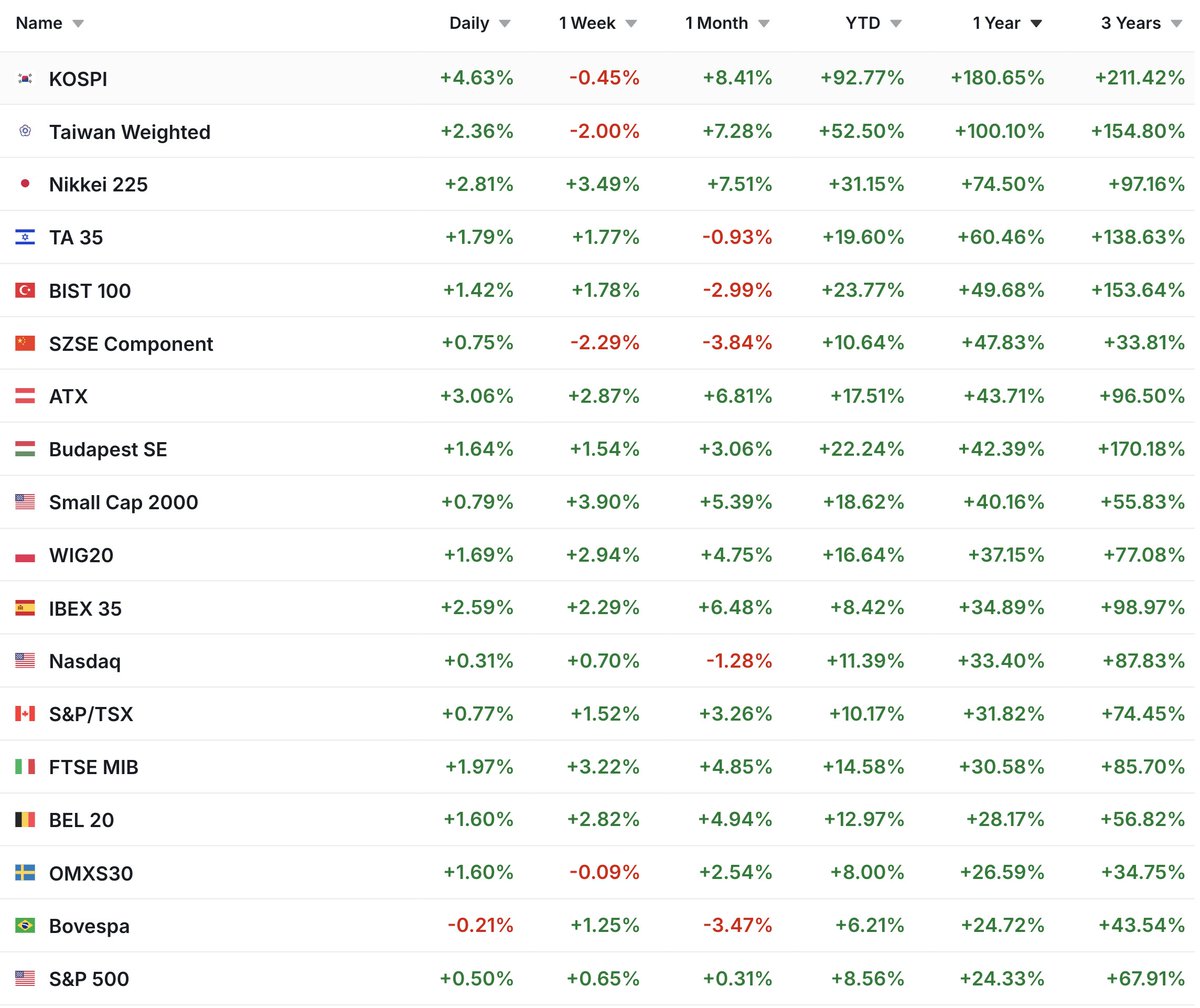
Top performing global indices over 1 year as well as YTD:
🥇 Korea
🥈 Taiwan
🥉 Japan
1
2
13
1,469
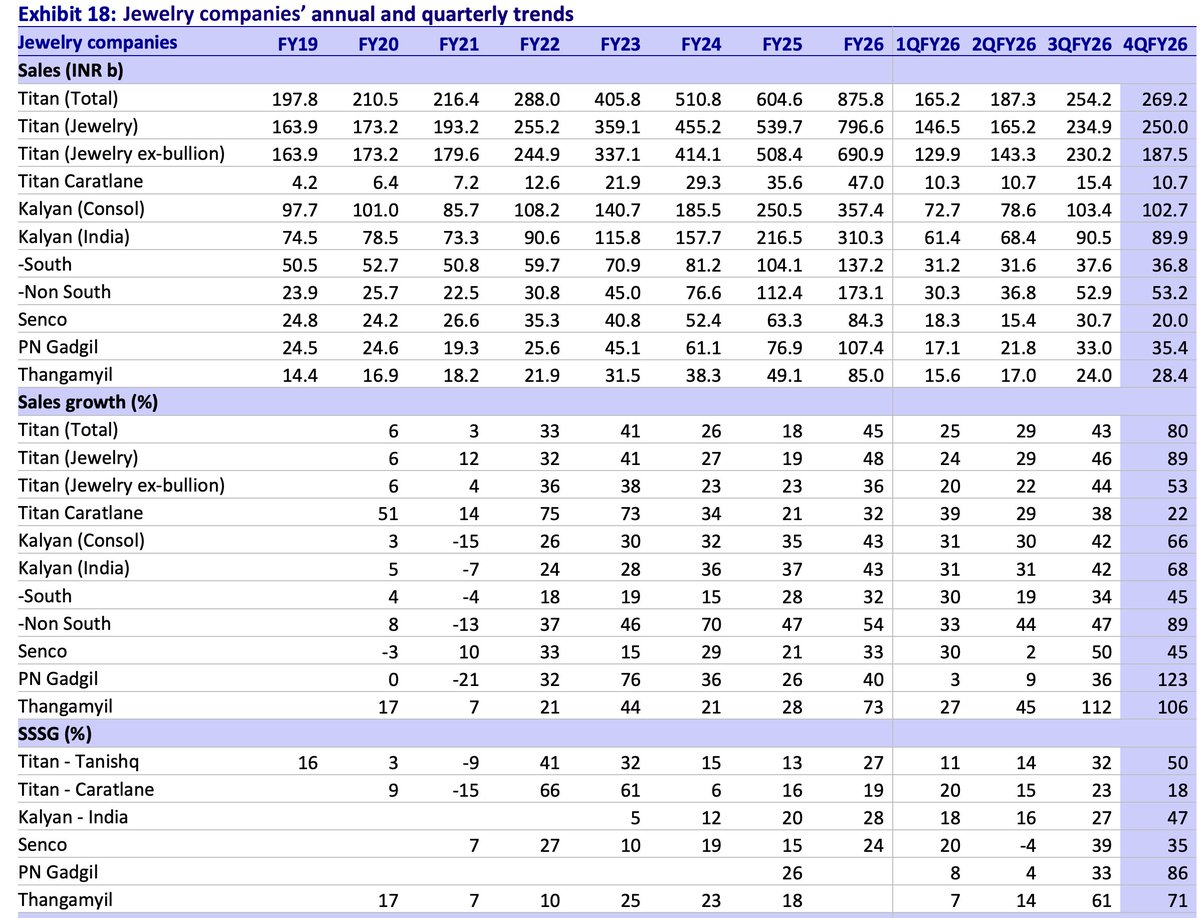
Commentary across Jewellery Companies💎
Titan, Kalyan, P N Gadgil, Senco Gold, Thangamayil, D.P. Abhushan⏬
Organised jewellers delivered strong FY26, supported by higher gold prices, wedding demand, formalization & continued store expansion
Demand has remained resilient even at elevated gold prices
Jewellery buying in India is largely budget driven
Customers generally come with an INR budget rather than a volume budget
So when gold prices rise, grammage reduces, but ticket size & REV can still remain strong
This is why many organised jewellers have been able to report strong REV growth despite high gold prices
Another major trend is old gold exchange.
Old gold exchange is becoming a structural driver for the sector
It helps customers manage affordability, supports conversion & reduces dependence on fresh gold buying
For many jewellers, old gold exchange can move towards 50% share in FY27
At the same time, bars & coins saw strong demand in FY26 because of investment led buying during rising gold prices
But bars and coins are low margin products, so whenever the mix of bars & coins increases, margins get diluted
Going ahead, if coin & bar demand slows after the duty hike, customers shift more towards jewellery, it is positive for margins
To manage high gold prices, jewellers are focusing on affordability led products
This includes: Studded jewellery, Lightweight jewellery & Lower caratage jewellery
These products help customers stay within budget & also support margin improvement
Titan is also experimenting with newer formats like Hues & beYon, showing that large players are trying to create new category engines beyond traditional jewellery
Store expansion remains a key growth driver, especially for organised players entering newer geographies & capturing market share from smaller jewellers
Kalyan is expanding outside South India, PNG is scaling outside Maharashtra, Senco is also expanding beyond East India
Kalyan & PNG are scaling through FOCO led formats
This reduces capital intensity, improves ROCE & allows faster store expansion
Growth trajectory remains intact for FY27, with most organised jewellers guiding to maintain 20% growth, led by store expansion, SSSG & continued market share gains from unorganised players.
2
35
2,869
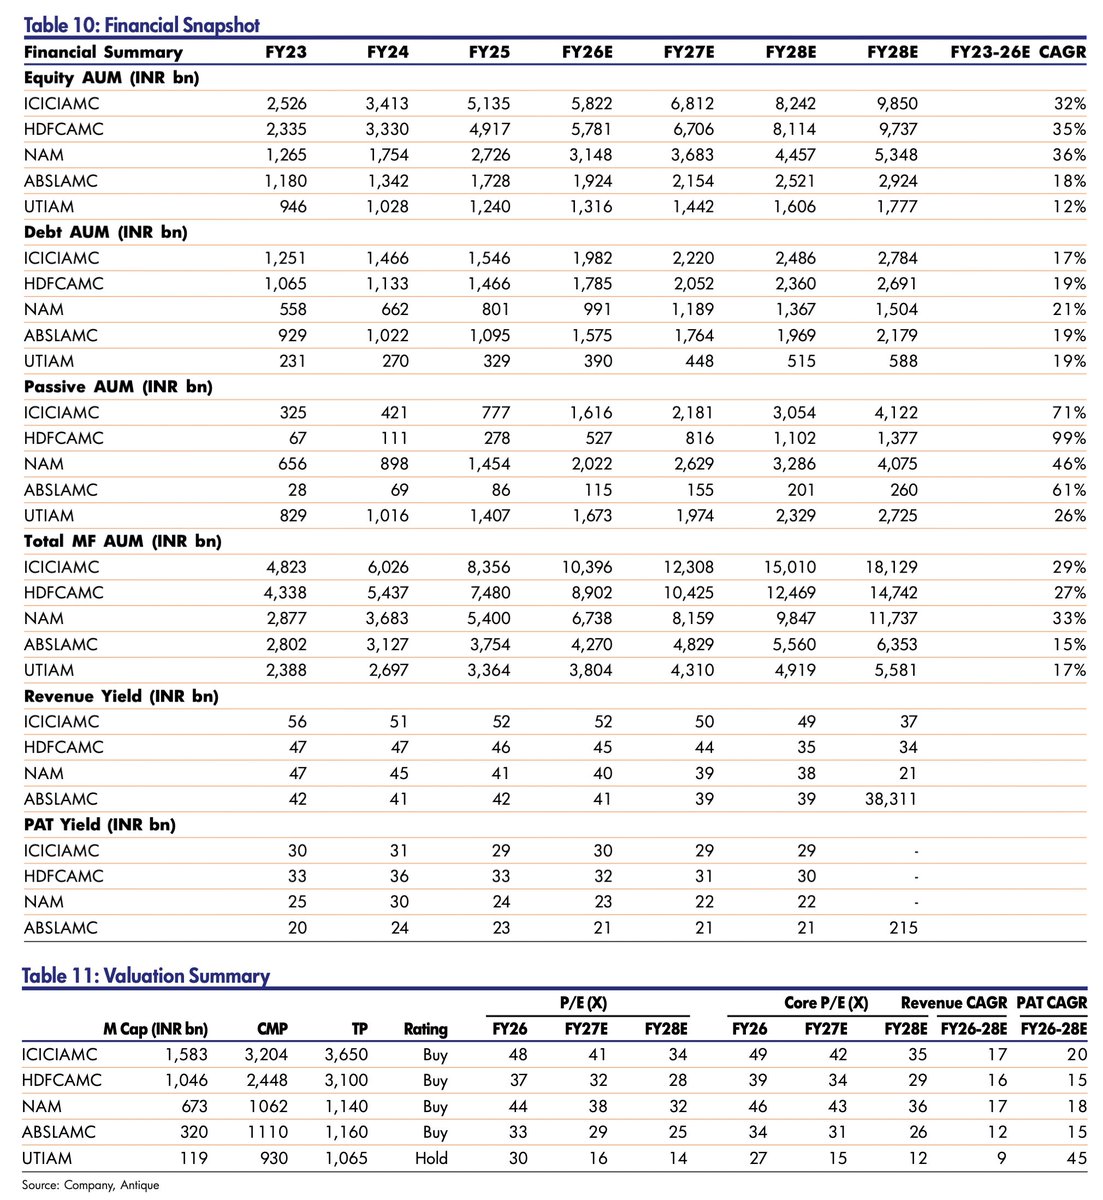
Comparison of leading AMC's - ICICI, HDFC, NAM India, ABSL & UTI AMC across AUM growth, financials & valuations
Equity AUM growth remains the strongest for NAM, HDFC & ICICI AMC, with FY23-FY26E CAGR of 36%, 35% & 32%
src : Antique
5
5
47
3,885
Top 15 Concalls Worth listening (2):
Titan
Goldiam
CarTrade Tech
TD Power
Prestige Estates
Blackbuck
Syrma SGS
Interarch Building
Rategain Travel
Privi Speciality
Edelweiss
Waaree Energies
Gaudium IVF
Coforge
Tata Capital
Many insights shared by the management, worth tracking
Not a buy/sell reco
Only for study purposes
6
7
110
7,458
Top 15 Concalls Worth listening :
Bajaj Finance
V2Retail
Garware Hi Tech
Nuvama
Pearl Global
Indo Count
SBFC Finance
360One
Smartworks
Wework
Northern ARC
Credit Access
Arman Financial
Tips Music
Vishal Mega Mart
Many insights shared by the management, worth tracking
Not a buy/sell reco
Only for study purposes
6
2,502
Titan’s new growth engines - Hues & beYon
Titan is not only focusing on traditional gold & studded jewellery, but is also creating new growth engines to expand the overall jewellery category
Titan has launched 'Hues' as its new natural gemstone based jewellery collection
The strategic rationale is to add a new dimension to jewellery beyond coins, gold jewellery & studded jewellery
Management said consumers are increasingly becoming design seekers, not just value seekers
Hues has around 200 styles, 50% of the collection is priced between Rs 40,000 & Rs 2.5 lakh, range goes up to Rs 10 lakh
The collection is focused on wearable & daily use jewellery, not just locker based jewellery
beYon is Titan’s lab grown diamond platform
Titan currently has 2 beYon stores, Management plans to scale beYon to around 10-12 stores across 2-3 cities
Company wants to first test the model at this 10-12 store scale before going for a national launch
Titan sees beYon as part of a twin-engine approach to grow diamond adoption in India
During the Valentine’s period, management said beYon saw good traction
However, they also clarified that the current sample size is too small, so they do not want to extrapolate too much from one store.

1
2
59
4,891
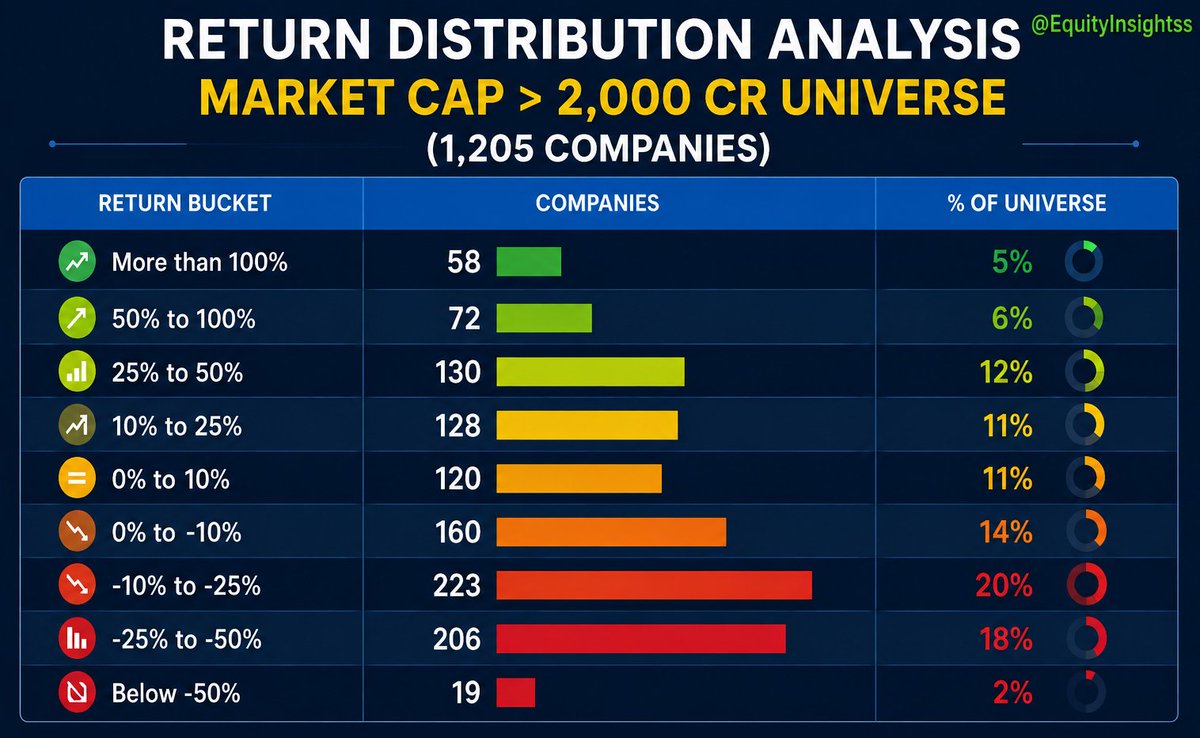
Market breadth tells a very different story from headline indices
1,205 companies in the dataset with Mcap > 2,000 Cr
Median 1 year return stood at -2.6%, while the average 1 year return stood at 10.5%.
This clearly shows that the market rally has been highly skewed.
A small set of outperformers has pulled the average return higher, while the median stock is still negative.
Only 508 companies delivered positive 1 year returns, which is 42% of the total universe & 46% of companies where 1 year return data is available
On the other hand, 608 companies delivered negative 1 year returns, which is 50% of the total universe & 54% of companies where 1 year return data is available
This means more companies have delivered negative returns than positive returns over the last 1 year.
130 companies delivered more than 50% returns, while 58 companies delivered more than 100% returns.
Wealth creation has been concentrated in a limited set of names.
At the same time, correction has also been sharp in many pockets.
Median fall from 52W high stands at 21%, while the median fall from all time high stands at 32%.
622 companies are down more than 20% from their 52W highs.
357 companies are down more than 30% from their 52W highs.
Only 140 companies are trading within 5% of their 52W highs.
Another important point is the difference between winners & losers.
Median return of companies with positive 1 year returns is 27%.
Median return of companies with negative 1 year returns is -19%.
There are pockets of massive wealth creation, but broad based participation is missing.
This is a classic selective market.
2
3
45
5,584
We have pushed our latest Smallcase rebalance
x.com/EquityInsightss/status…
We have pushed our latest Smallcase rebalance
Overall, our portfolio companies have delivered well & have largely achieved their guidance
Portfolio EPS growth stands at >25%
We added 2 new companies in this update where earnings visibility looks strong
Detailed rationale has been mentioned in the update
Outlook for FY27 also remains encouraging, with most companies continuing to guide for sustained growth momentum
Our focus remains simple - stay with companies that are delivering, exit where execution is weak.
5
3,112
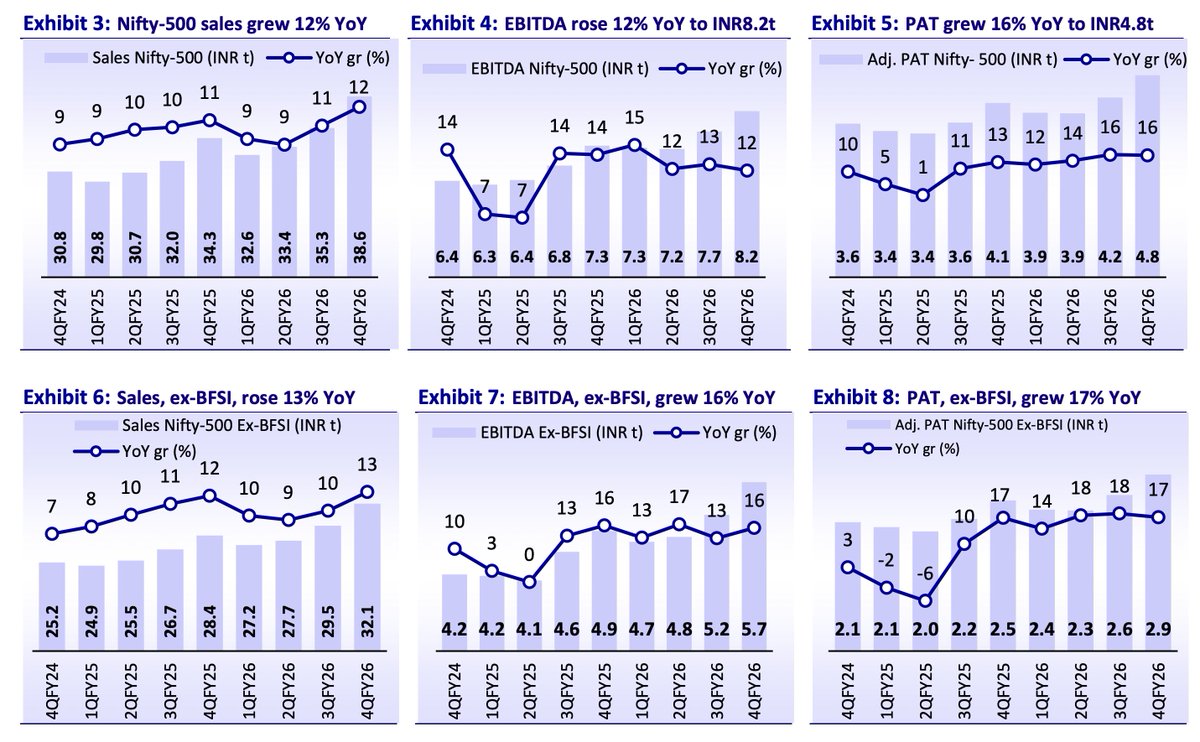
Nifty 500 delivered 16% YoY PAT growth in Q4FY26
Ex-financials, earnings growth was even stronger at 17% YoY
Nifty500 PAT grew 16% YoY vs Nifty50 PAT growth of only 4% YoY
Nifty500 EBITDA grew 12% YoY vs Nifty50 EBITDA growth of 5% YoY
Sales growth for Nifty500 stood at 12% YoY, which was the highest in the last 13 quarters
Nifty Midcap150 PAT grew 34% YoY, much higher than Nifty500 at 16%, Nifty100 at 12% & Smallcap250 at 13%
Around 50% of Nifty 500 co's reported earnings growth above 15% YoY
src : MOFSL

2
1
44
4,308
AI stock of India?
Up 700% in 1 year, trading at 199x earnings
31
12
356
45,940
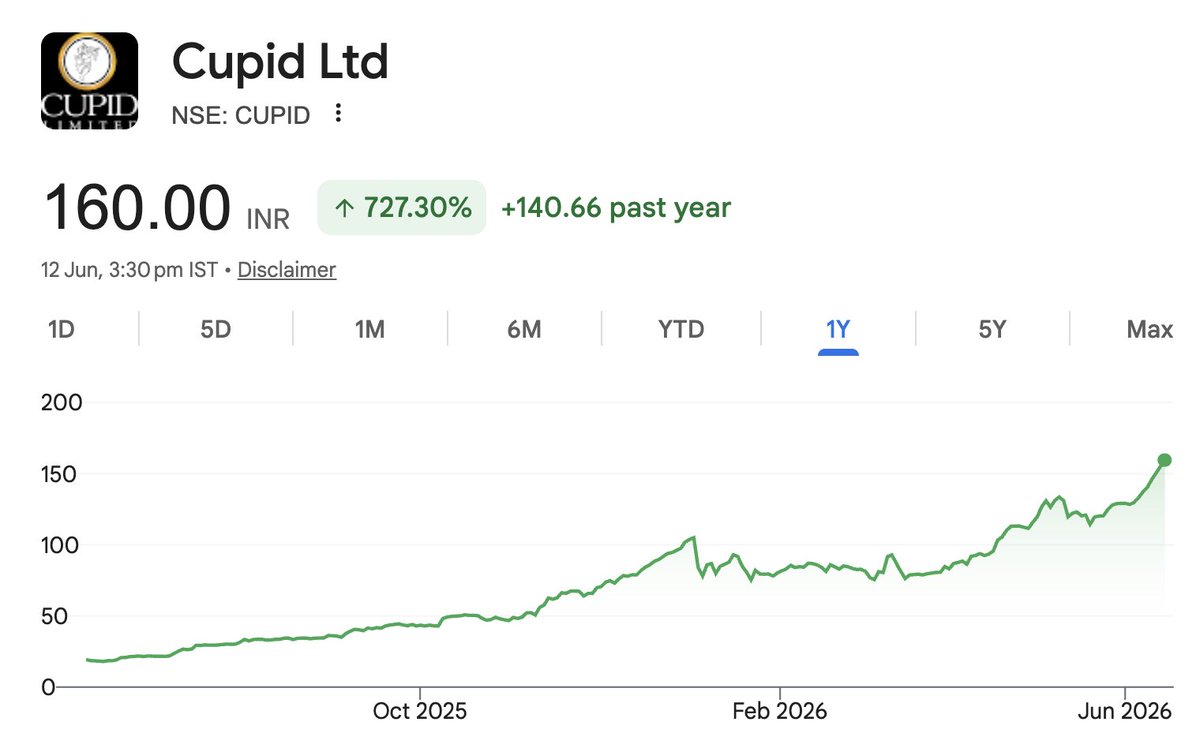
Crazy ! Cupid have given REV & PAT guidance till FY29 !
They ended FY26 with
REV : 358 Cr & PAT : 108 Cr
They are projecting 390 Cr PAT in FY29...

1
16
5,556
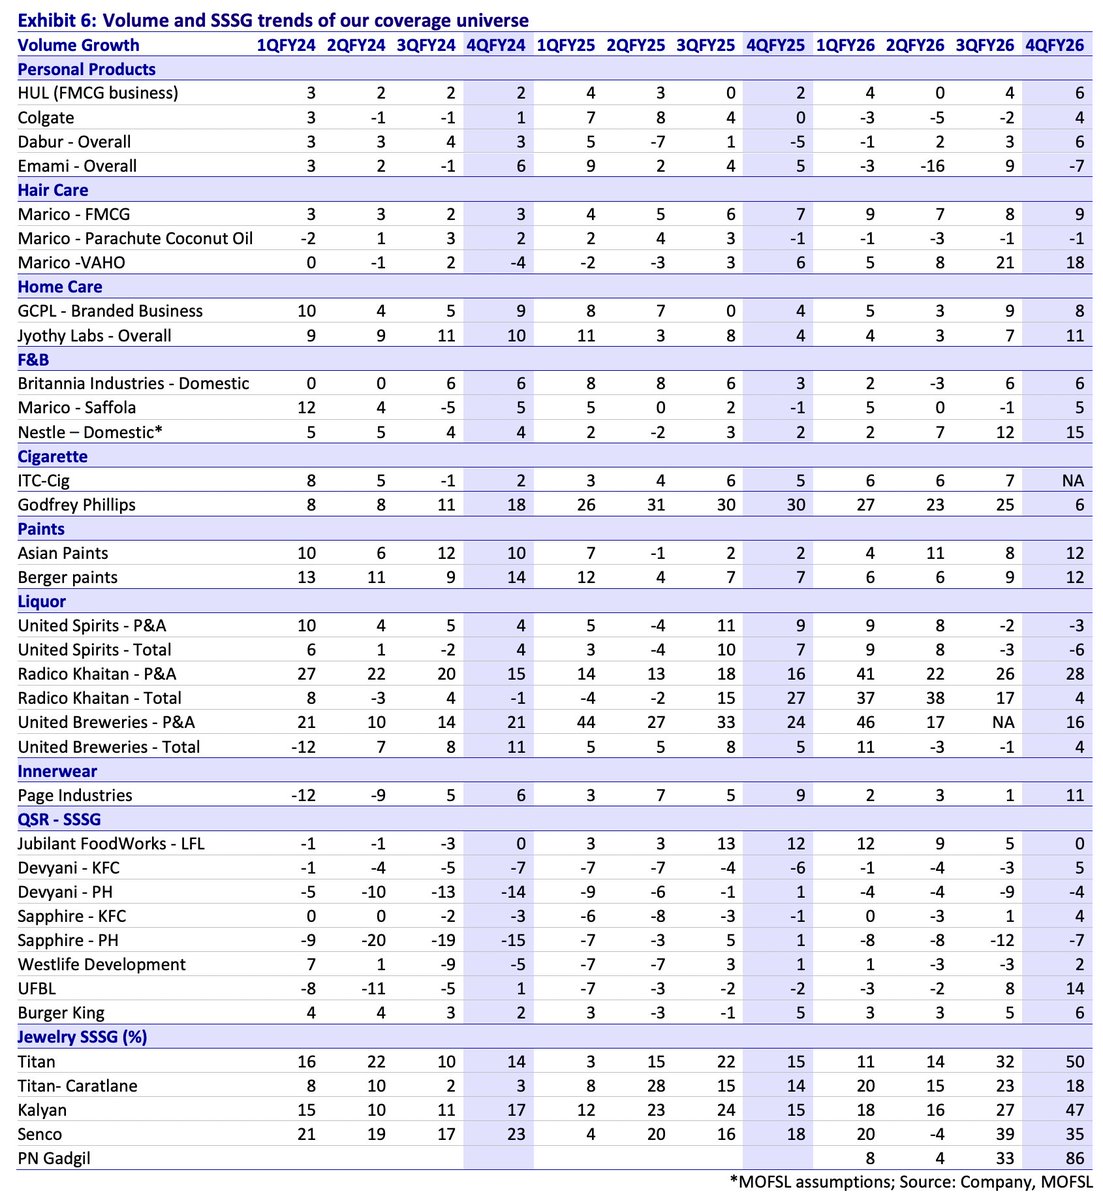
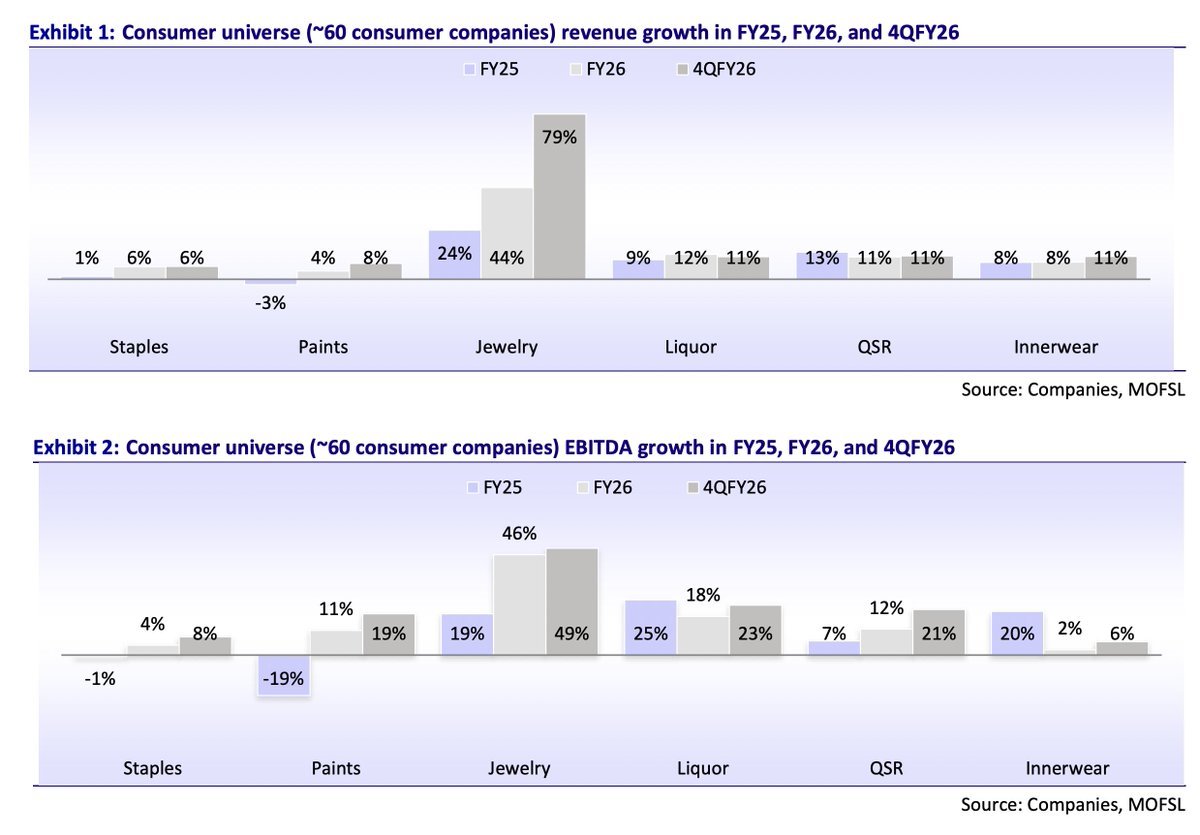
Growth trend across the Consumer Universe
It compares REV & EBITDA growth across key segments like staples, paints, jewellery, liquor, QSR & innerwear
Jewellery is the clear outperformer in the consumer space
Paints have started recovering after a weak FY25, other segments are also seeing early signs of recovery
src : MOFSL
4
1
31
4,129
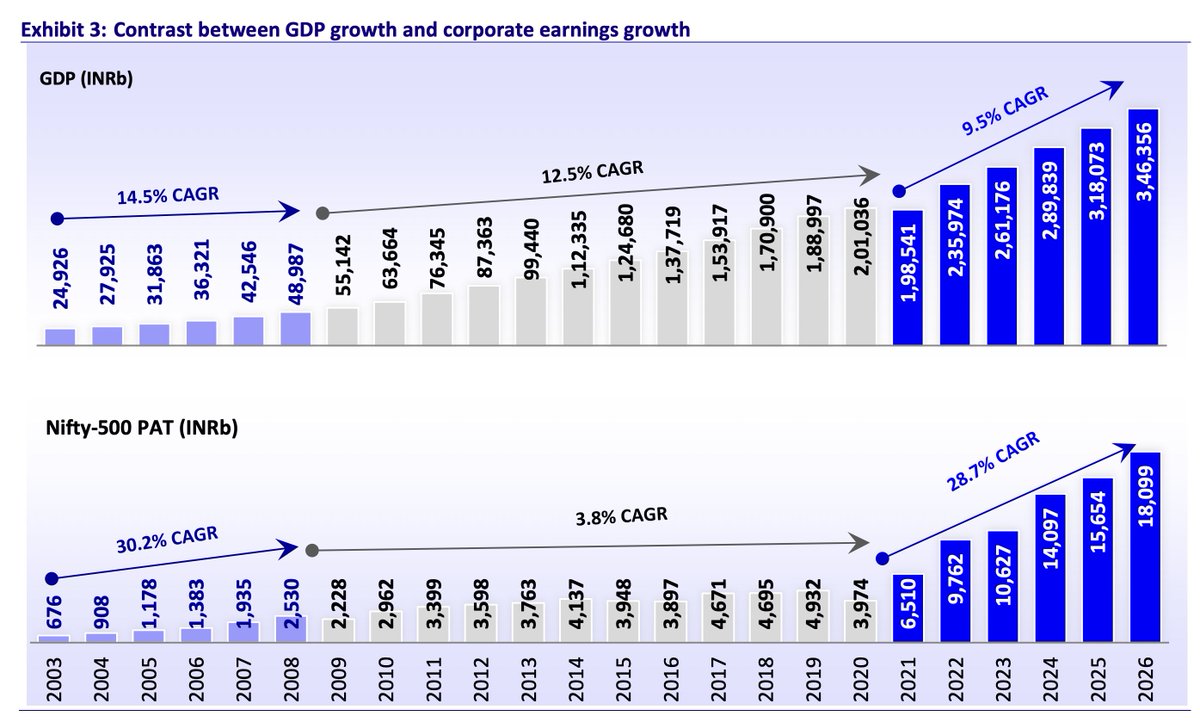
Nifty 500 corporate profit/GDP ratio surged to an all time high of 5.2% in FY26
This is a major milestone, as corporate profitability has now surpassed the previous peak of 5.2% seen in FY08
Corporate profits grew 15.6% YoY in FY26 while Nominal GDP grew 8.9% YoY in FY26
The key point is that corporate profit growth continues to outpace nominal GDP growth
The journey has been quite interesting
From 5.2% in FY08, the ratio declined consistently & bottomed at 2% in FY20
src : MOFSL
5
5
57
8,403
Nifty 500 REV & Margins trend
Strongest growth phase was b/w FY03-FY08
2
12
2,207
During 2003-08, India’s GDP compounded at 14.5% CAGR, while Nifty 500 PAT compounded at a much stronger 30% CAGR
During 2008-20, GDP still compounded at 12.5% CAGR, but Nifty 500 PAT grew at only 3.8% CAGR
This led to the corporate profit/GDP ratio falling from 5.2% in FY08 to just 2% in FY20
During 2020-26, GDP growth was relatively lower at 9.5% CAGR, but Nifty 500 PAT compounded at 29% CAGR
src : MOFSL
6
16
77
7,826
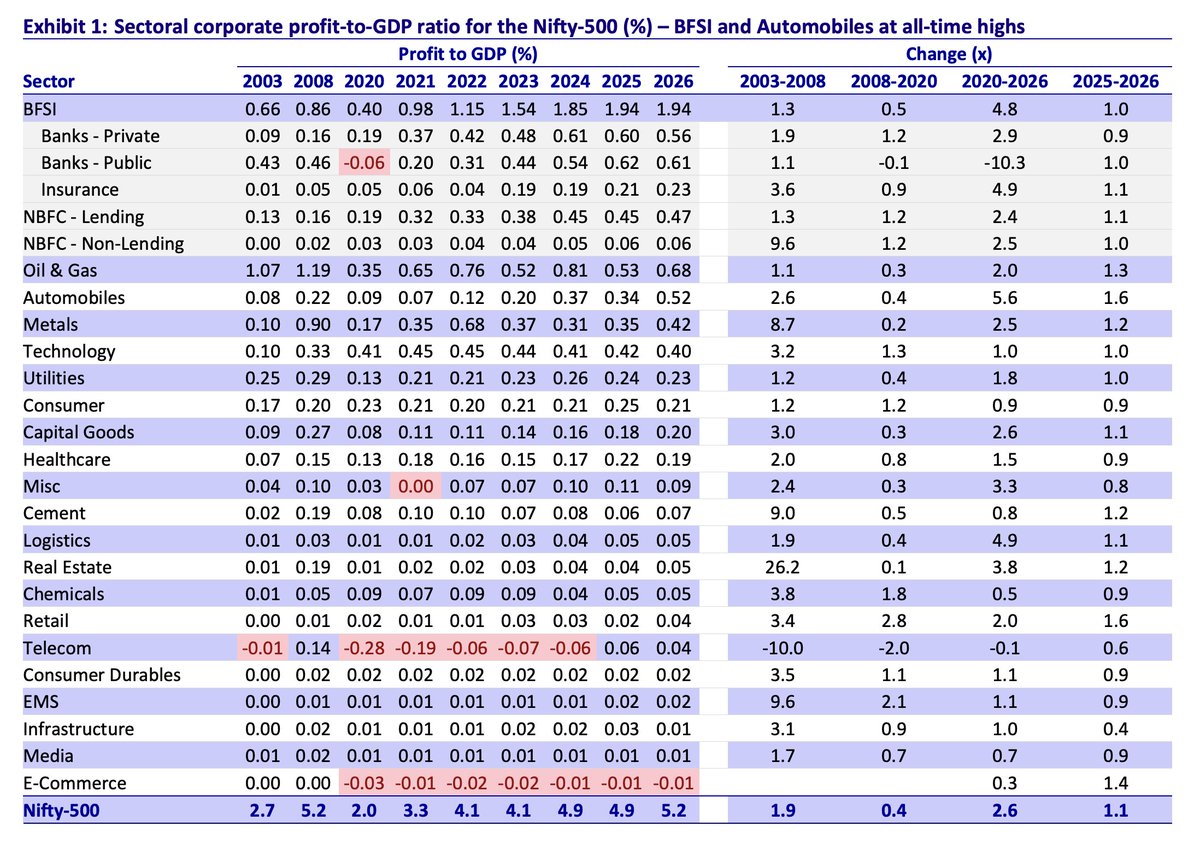
Sectoral corporate profit/GDP ratio for Nifty 500
13
2,386
All research reports & insights shared here
t.me/equityinsightselite
5
2,389