
Joined May 2026
- Tweets 740
- Following 792
- Followers 321
- Likes 471
21 Photos and videos


Pinned Tweet
My stock portfolio, which I expect to rise over the next 2–3 months:
$AVGO (Broadcom) ~ $382
$NVDA (Nvidia) ~ $205
$LLY (Eli Lilly and Company) ~ $1,133
$MU (Micron Technology) ~ $981
$CRWV (CoreWeave) ~ $100
My goal is to exit this portfolio with at least a 10% profit over the next 2-3 months...
My US portfolio. Not financial advice.
1
4
439
🚨 Is $QQQ a Buy Right Now, or Is It Way Too Inflated?
Let’s look at the Invesco QQQ Trust using simple, no-BS financial analysis.
1️⃣ The Price Tag: Sitting around $721. It recently cooled down from its $748 peak. It feels heavy because it has run up so fast.
2️⃣ P/E Ratio (Valuation): Around 36x. Translation: You’re paying $36 for every $1 of profit. Historically, it's expensive. You are paying a premium for AI hype.
3️⃣ Concentration Risk: It’s not actually "the whole market." Over 25% of QQQ is just 4 stocks: Nvidia, Apple, Microsoft, Amazon. If tech cools down, QQQ drops hard.
4️⃣ The Reality Check: Unlike the 2000 Dot-Com crash, these tech giants aren't fake companies—they are cash cows making record billions.
5️⃣ The Trend: The recent dip is a healthy breather, but entering with a huge lump sum right here is high risk.
The Verdict:
❌ Don't FOMO buy everything today. The price is heavily inflated for the short term.
✅ Best move? Dollar-Cost Average (DCA). If you have a 5 year horizon, just buy small amounts weekly/monthly and ignore the noise.
2
51
Is $IBIT (iShares Bitcoin Trust ETF) a buy right now, or is it a trap?
Here is the quick financial reality check:
The Price Drop: It's NOT bloated anymore. $IBIT crashed from its 52-week high of $71 down to ~$36. It’s sitting at a 50% discount from its peak.
The Bitcoin Trend: Bitcoin recently broke below $60k, causing mass panic. When Bitcoin bleeds, $IBIT drops exactly with it.
Record Outflows: Institutional investors are pulling money out at record speeds. From a purely technical sentiment view, this is maximum market fear.
The "Buy the Dip" Indicator: Smart money loves blood in the streets. Historically, when regular retail investors panic-sell their ETFs, it creates a classic cyclical bottom.
Institutional Backing: Even with the crash, major giants like Morgan Stanley and Charles Schwab are expanding crypto access. The long-term infrastructure isn't going away.
Cheap Management: With a low 0.25% sponsor fee, it remains the cheapest and safest way for an average American to hold Bitcoin inside a standard retirement account (401k/IRA).
The Verdict: If you think Bitcoin is going to zero, stay away. But if you believe it will recover by the end of the year, buying $IBIT at $36 is catching a massive Wall Street discount—not buying a bubble.
1
72
Is $SPY (SPDR S&P 500 ETF) a buy right now, or are we sitting in a massive bubble?
Let’s look at the raw numbers so anyone can understand:
1️⃣ Price Check: S&P 500 is around 7,400. Up nearly 10% YTD.
2️⃣ Valuation: Forward P/E is at 21x. Historically, this is in the 88th percentile. Translation: It’s expensive.
3️⃣ The AI Engine: Corporate earnings are up 24%, but half of that growth is purely driven by massive AI spending.
4️⃣ Inflation Warning: May inflation hit 4.2% (3-year high). High interest rates aren’t going away soon.
5️⃣ The Target: Goldman Sachs just raised its year-end target to 8,000 (~7% upside).
The Verdict: It’s definitely bloated, but strong earnings are holding the floor. Don’t lump-sum FOMO here—Dollar-Cost Average ($DCA) instead.
1
2
127
🚨 Should You Buy $SOXL (Direxion Daily Semiconductor Bull 3X ETF), or Is the Price Too Inflated?
(A Clear 5-Point Analysis) 👇
What Is It? It’s a 3x leveraged version of chip giants like Nvidia, AMD, and Micron. If the chip sector rises by 1%, SOXL surges by 3%; if it drops by 1%, SOXL plummets by 3%.
The Price Is Way Overvalued: The stock, which was at $47 in early 2026, skyrocketed to $284 by June. It’s currently around $234. Technically, it’s in the “Overbought” zone, meaning the price is severely inflated.
The Big Players Are Exiting (Fund Flows): By the end of May, major institutional investors had cashed out billions of dollars in profits and exited the stock. It’s risky to enter the game as the big players are leaving the table.
Leverage Trap (Time Constraint): This is NOT a “buy-and-hold” stock. Since it resets daily, your money will erode mathematically even if the market moves sideways.
Poor Risk/Reward Ratio: Jumping on the bandwagon at this price carries the risk of catching the stock at the absolute peak.
🎯 SUMMARY / DECISION: The price is way overvalued. Buying here right now is a gamble. If you don’t already own it, don’t get carried away and jump in at the top; wait for a solid correction (drop), then buy at the bottom!
269

Jun 13
Following the ceasefire agreement between Iran and the U.S., prices for oil and precious metals are expected to decline.
In addition, the S&P 500 index is expected to rise by 5% this week.
1
4
171
Jun 13
🚀 Should You Buy $RKLB (Rocket Lab), or Have You Missed the Boat? 🚀
Massive Growth (63.5%): They reported $200.3 million in revenue in their Q1 2026 earnings report. They signed 31 new contracts in this quarter alone. The guaranteed revenue from upcoming projects (backlog) totals a full $2.2 billion!
Nasdaq-100 Boost: Officially announced on June 12; they’ll join the index at the market open on Sunday, June 22. This is a massive event because large index funds will be forced to buy millions of RKLB shares.
Price Has Skyrocketed (117x P/S): Here’s where the alarm bells are ringing. The company’s market cap has reached $78 billion, but its annual revenue is only ~$679M. That means it’s trading at 117 times its sales. This indicates that all future success is already priced in.
The Hidden Risk in the Neutron Rocket: The large Neutron rockets are supposedly “scheduled for launch by the end of 2026,” but a behind-the-scenes accident has occurred. A fuel tank test in January 2026 exploded due to a manufacturing defect, and the launch has already been postponed to as early as Q4 2026. This does not rule out another failure.
Major Insider Selling ($66.9M): Over the past three months, company executives have sold a total of $66.9 million worth of shares. In contrast, not a single share was purchased by insiders. Those who know the company best are cashing out at this price.
💬 Summary / Decision: Space technology is amazing, the company is growing, and it’s joining the index, but the 117x P/S valuation, the delay at Neutron, and the insider sales all scream, “The price is way overinflated!” Instead of jumping in at the top out of FOMO, waiting for a potential market pullback is much more rational.
3
254
Jun 13
Should you buy $VOO (Vanguard S&P 500 ETF) right now, or has the price gotten too inflated?
I’ve summarized the most popular U.S. fund in six points using the clearest financial metrics. 👇
Price-to-Earnings (P/E) Ratio: The S&P 500’s P/E ratio is above its historical average. In other words, the market isn’t “cheap”; it’s closer to the expensive end of the spectrum.
Shiller P/E Test: The long-term, inflation-adjusted measure of valuations is also at historically high levels. This is the basis for those who say “prices are inflated.”
Hidden Tech Weighting: VOO is supposed to hold stakes in 500 companies on paper, but giants like Nvidia, Apple, and Microsoft play a massive role in the fund’s performance. If tech weakens, VOO will be shaken.
Near-Zero Costs: The expense ratio is 0.03%. That means you pay just $3 a year on a $10,000 investment. It’s one of the cheapest large-cap funds in the world.
A $1 Trillion Giant: VOO became the first ETF to surpass $1 trillion in assets. This grants it high levels of trust, liquidity, and institutional acceptance.
Conclusion – Should You Buy It?: It may seem expensive in the short term. Therefore, instead of investing all your money at once, DCA (dollar-cost averaging) might be a more sensible approach. In the long term, however, it remains a strong core investment vehicle.
2
111
Jun 13
🚀 $ASTS: Space Revolution or Investor Trap? 🛰️
We’re breaking down the AST SpaceMobile stock—the talk of the town—in its simplest form, free of confusing financial jargon. Here’s the breakdown in 5 points:
1️⃣ Massive Vision: They’ll provide satellite internet directly to regular cell phones. They’re backed by giants like AT&T and Verizon. The story is very strong.
2️⃣ Financial Health: The company isn’t profitable yet (negative EPS). Right now, you’re buying into the future and the promises, not current profitability.
3️⃣ Is the Price Overvalued?: The stock hit a high of $133 and is currently around $82. However, with a zero-profit bottom line, a $29 billion market cap still seems significantly overvalued.
4️⃣ Major Competitor on the Scene: The IPO of major rival SpaceX has started drawing hot money from the market. This is putting serious pressure on $ASTS.
5️⃣ Catalyst (All or Nothing): New satellite launches are on the horizon in mid-June. A successful launch could send the stock soaring, while even the slightest technical glitch could send it crashing.
💡 Bottom Line: The technology is fascinating, but the current price is highly risky and volatile. If you don’t want to gamble, waiting for sharp drops (lows) to jump on the bandwagon makes much more sense.
1
294
Jun 13
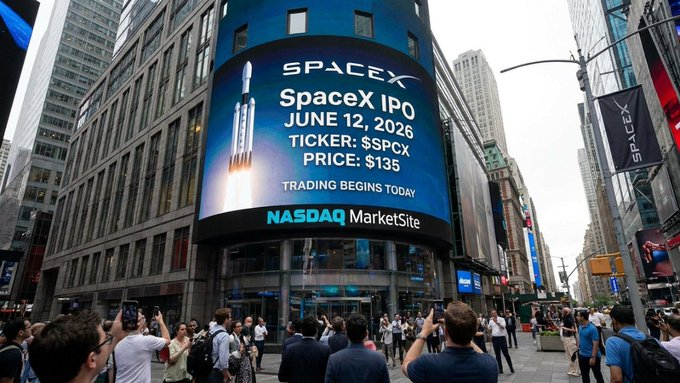
Will $SPCX hit $200 next week?
0%
definitely 100%
0%
maybe 50%
0%
never 0%
0 votes • 1 day
1
105
Jun 13
Should I buy or sell $MU (Micron Technology)?
Price Action: Rallied over 760% in the past year, driven by AI and HBM (High Bandwidth Memory) demand. It has pulled back to the $980–$990 range due to profit-taking from its peak of ~$1,089.
Valuation: The current P/E ratio is around 46–47x. This is significantly above its historical averages; the short-term price looks stretched (while the forward P/E is ~10x).
Growth and Profit Margins: Driven by HBM demand, an 81% gross profit margin is targeted for Q3 FY2026. This indicates exceptionally strong pricing power.
Supply and Demand Balance: Micron can meet approximately 60% of the 2026 HBM demand. Capacity is completely sold out for 2026. This remains positive for the medium term, though capacity expansion could eventually normalize margins.
Industry Cyclicality: The memory sector is cyclical. Analysts project that the peak in profitability could be reached toward 2027.
Earnings Catalyst: The June 24, 2026 earnings report is critical. Goldman Sachs raised its price target but maintained its Neutral rating. Because expectations are sky-high, the margin for error is slim.
Summary Verdict: The price has extended significantly and has largely priced in growth expectations. Buying directly at this level carries risk. The most rational strategy is to either wait for the June 24 earnings release or accumulate shares gradually during corrections.
1
3
365
Jun 13
The $SPCX stock closed at $160.95 today, reaching a market capitalization of $2.11 trillion.
1
2
135
Jun 12
US stocks that lost the most in price
-47.37% $HSPT Horizon Space Acquisition II Corp.
-36.81% $SMSI Smith Micro Software, Inc.
-34.05% $SDOT Sadot Group Inc.
-31.76% $SPCE Virgin Galactic Holdings, Inc.
-31.26% $HTCO High-Trend International Group
-28.26% $ASTC Astrotech Corporation
-26.69% $MNTS Momentus Inc.
-25.00% $DXST Decent Holding Inc.
-24.51% $BBGI Beasley Broadcast Group, Inc.
-22.55% $STFS Star Fashion Culture Holdings Limited
-22.30% $CRMT America's Car-Mart, Inc.
-20.27% $PWRL Powerlaw Corp.
-19.44% $VCIG VCI Global Limited
-19.32% $VRXA Veraxa Biotech AG
2
534
Jun 12
US stocks that increased the most in price
64.73% $CUPR Cuprina Holdings
64.30% $UBXG U-BX Technology
44.48% $EDHL Everbright Digital
31.61% $FRD Friedman Industries
25.77% $DSY Big Tree Cloud
25.68% $ZDGE Zedge
20.88% $TXMD TherapeuticsMD
20.48% $SNSE Sensei Biotherapeutics
20.47% $AKAN Akanda
20.08% $ROKU Roku
19.93% $TBN Tamboran Resources
19.36% $PTLE PTL
18.58% $FLNT Fluent
18.18% $STTK Shattuck Labs
17.99% $RNAC Cartesian Therapeutics
17.72% $RTB RTB Digital
1
232
Jun 12
At 3.75%, the Fed’s current interest rate may seem like a safe haven. But it’s actually a trap.
In an environment where headline inflation stands at 4.2%, your “safe” money is losing purchasing power day by day. This is a classic illusion between the perception of safety and basic mathematics.
Sitting on the sidelines may feel safe, but inflation quietly erodes your wealth like a silent tax. To truly protect your wealth, you must look beyond nominal returns and aim for positive real returns.
If you don’t want fear to erode your hard-earned capital, all you need to do is follow me.
2
74
Jun 12
The long-awaited $SPCX IPO has finally taken place. The stock is currently trading at $167.
2
174
Jun 12
Everyone is talking about SpaceX’s historic IPO, but no one is talking about the billions of dollars flowing from other stocks into $SPCX ...
Elon Musk may have become the first trillionaire in history, but other companies need to rise as well—especially the ones that deserve it...
1
5
364
Jun 12
If you had invested the $10,000 you saved throughout the year in $SNDK stock at the start of the year, you would have $78,000 right now...
Life sometimes favors simple moves...
1
112
Jun 12
Should $ETH (Ethereum) be bought?
Price & RSI: The price is holding around the $1,650 level. The RSI rose to the neutral zone at 57.6, dissipating the oversold pressure from early June.
Trend: The price remains below the 50-day and 200-day moving averages. Although the price is attempting to recover, there is no clear trend breakout yet.
Staking Power: More than 32% of the total supply (39M ETH) is locked. The investor is protecting their investment; spot selling pressure in the stock markets is limited.
Macro & ETF: Although the net outflow trend in ETFs has slowed down, the global liquidity contraction continues to exert overall pressure on crypto.
Inflation: The price that corrected by over 65% from the ATH level is definitely not inflated; the bubble has completely cleared.
Conclusion: Instead of diving into the body until there is a net bottom approval (volume and trend break), a gradual purchase can be considered by following the $ 1,500 - $ 1,600 support.
1
3
141
Jun 12
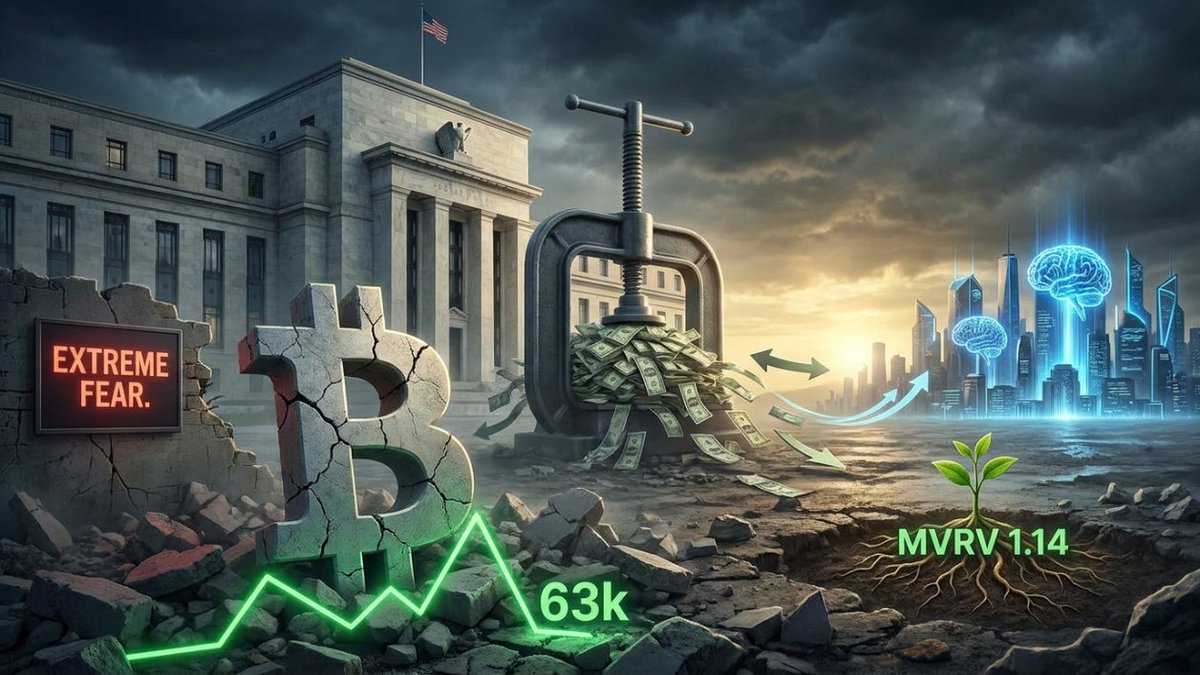
Should Bitcoin Be Bought? 📊
Price & Support: The bubble burst with a 50% correction from the $126,000 peak. The price is stabilizing around the $63k level; $60k is the main technical support.
Macro Pressure: Tight Fed policy (3.50% - 3.75% interest rates) and spot ETF outflows are squeezing fresh money inflows into the market.
On-Chain (MVRV): The ratio is around 1.14. According to historical cycles, it is close to the long-term accumulation zone.
Sentiment: Fear index at its lowest (Extreme Fear). Market enthusiasm (FOMO) has ended, seller fatigue is present.
Opportunity Cost: Global liquidity and volume are currently shifting significantly toward artificial intelligence (AI) and technology stocks.
Summary: Although short-term macro pressures and volatility persist, key financial metrics indicate a gradual recovery path for long-term investors.
3
88