
See more about our student projects, updates from our courses and more! Profs: @johntstasko @EndertAlex @PoloChau @friendly_cities @thecindyxiong @yalong_yang
- Tweets 273
- Following 163
- Followers 648
- Likes 410


ALT Figure 5. Combine View lets users analyze a) a combination of one or more binning methods by visualizing b) the most consistent Bin, c) the frequency of the most consistent Bin, and d) both together for each U.S. county in separate choropleths. The new, resiliency binning method then utilizes this information to g) determine “resilient” bins (counts, intervals) that are also visualized in a choropleth. Hovering any county on the map shows a tooltip with relevant information about the county, as shown in e) and f).


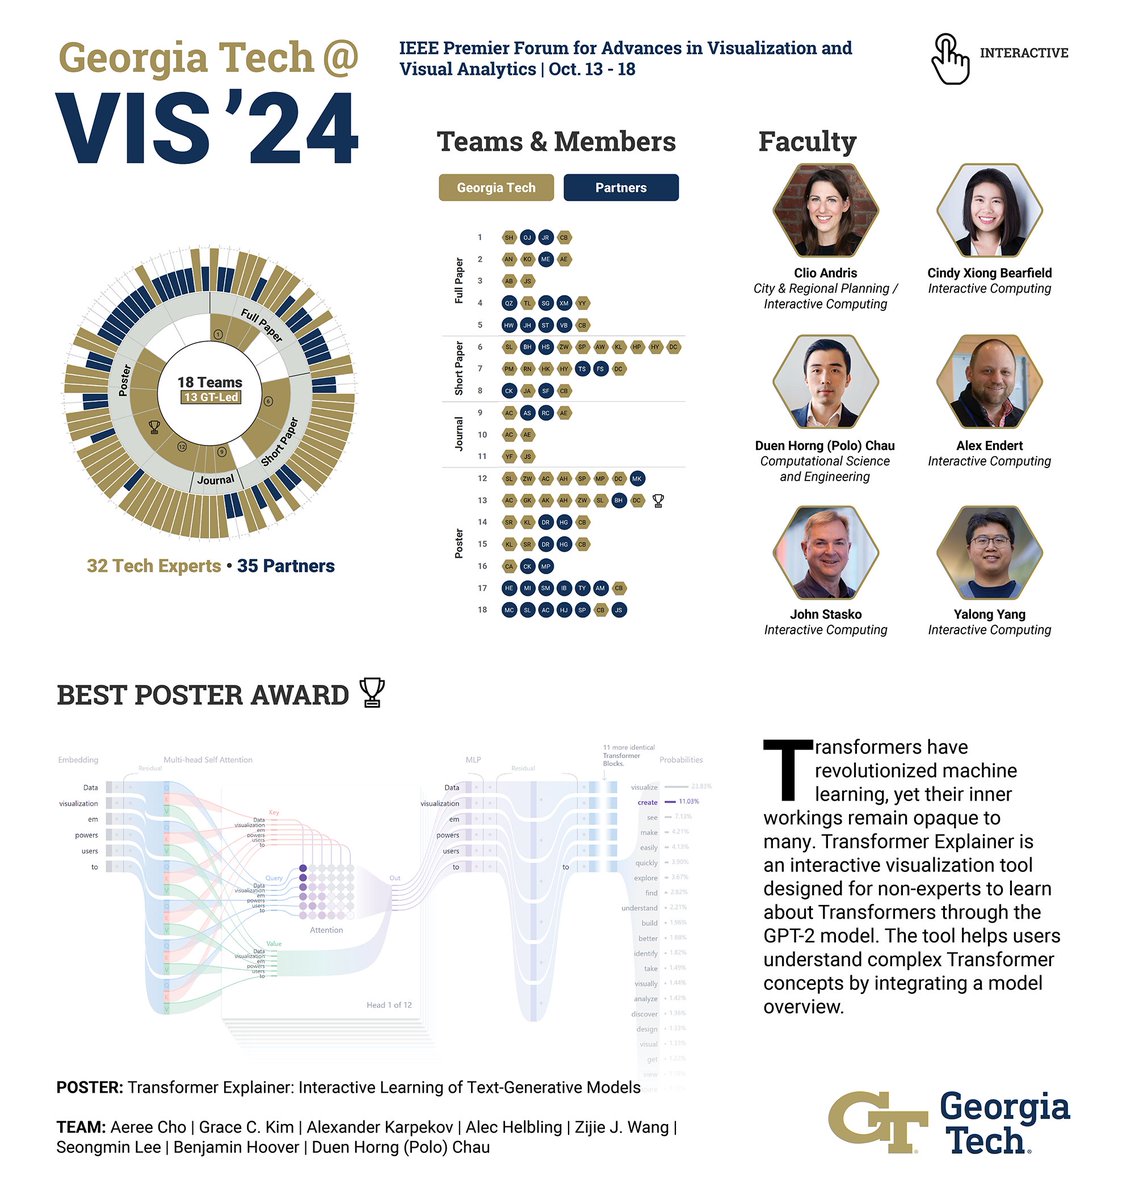
ALT Graphic illustrating all Georgia Tech faculty presenting research at IEEE VIS, held Oct. 13-18, 2024


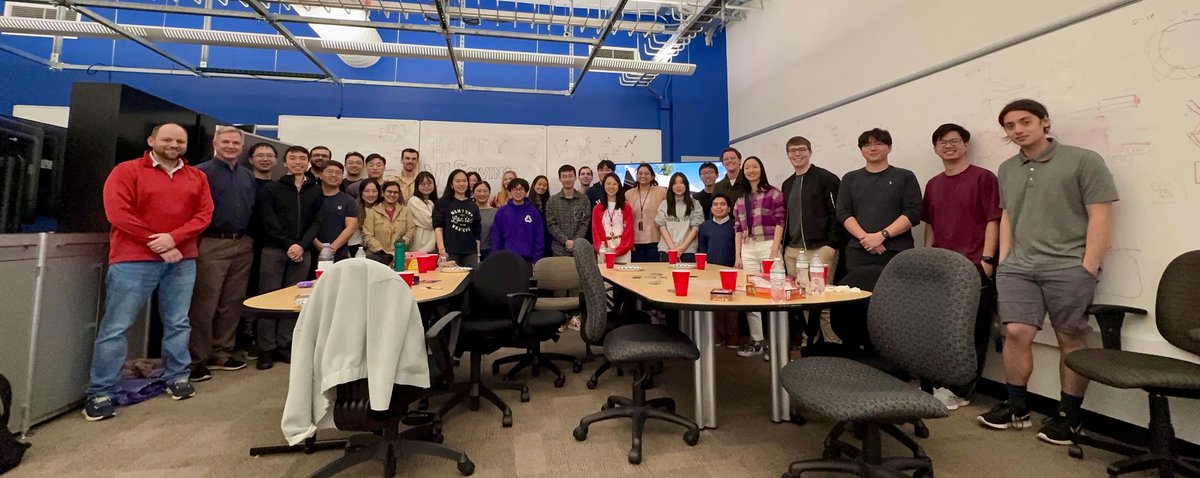
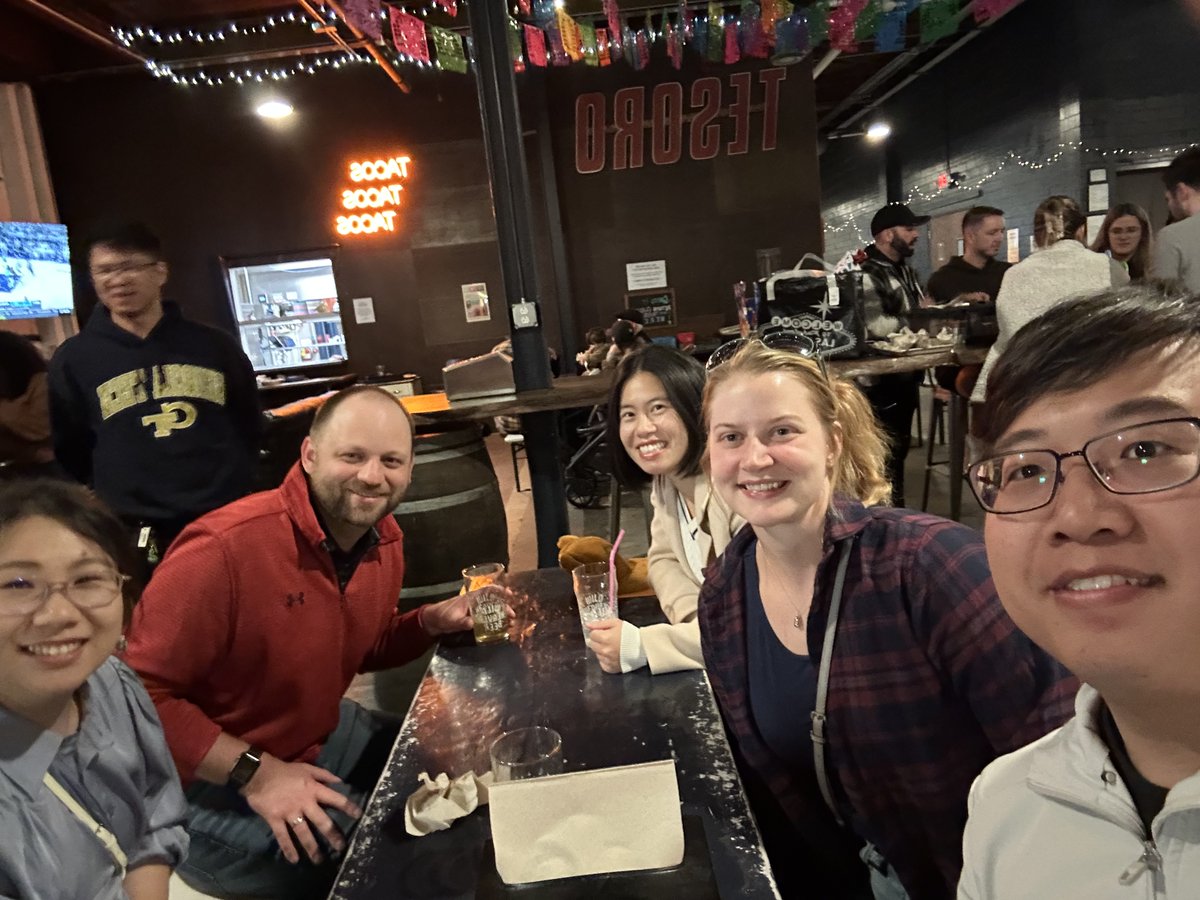
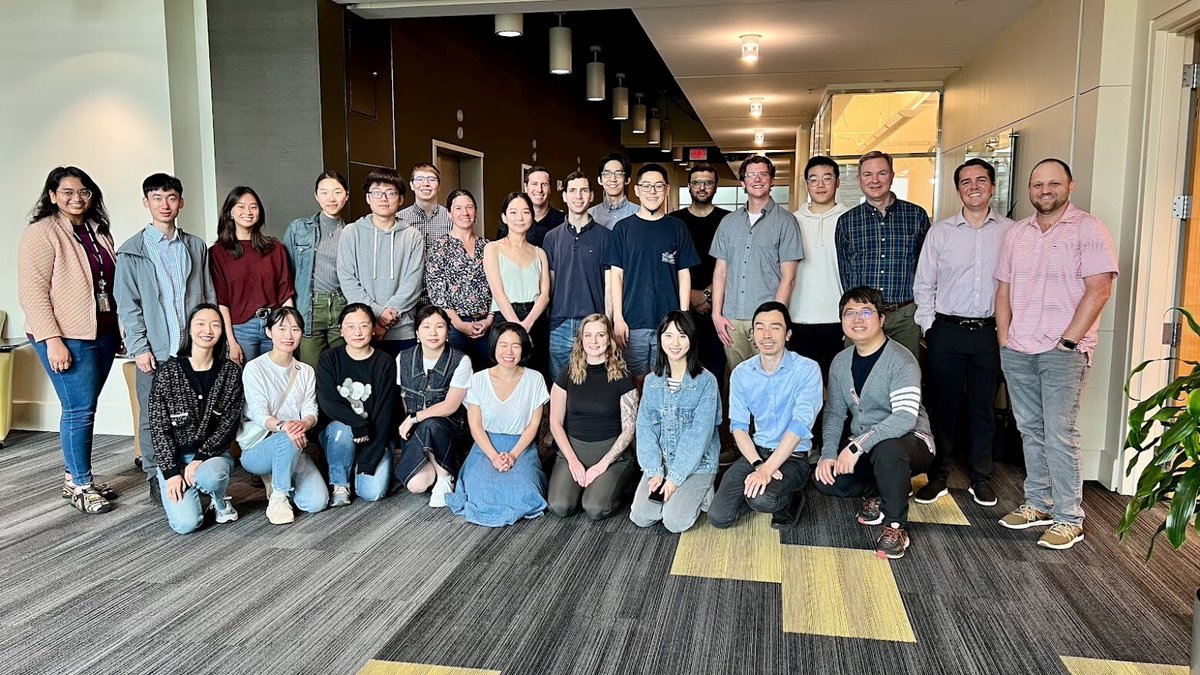
ALT Georgia Tech teams at IEEE VIS 2024.

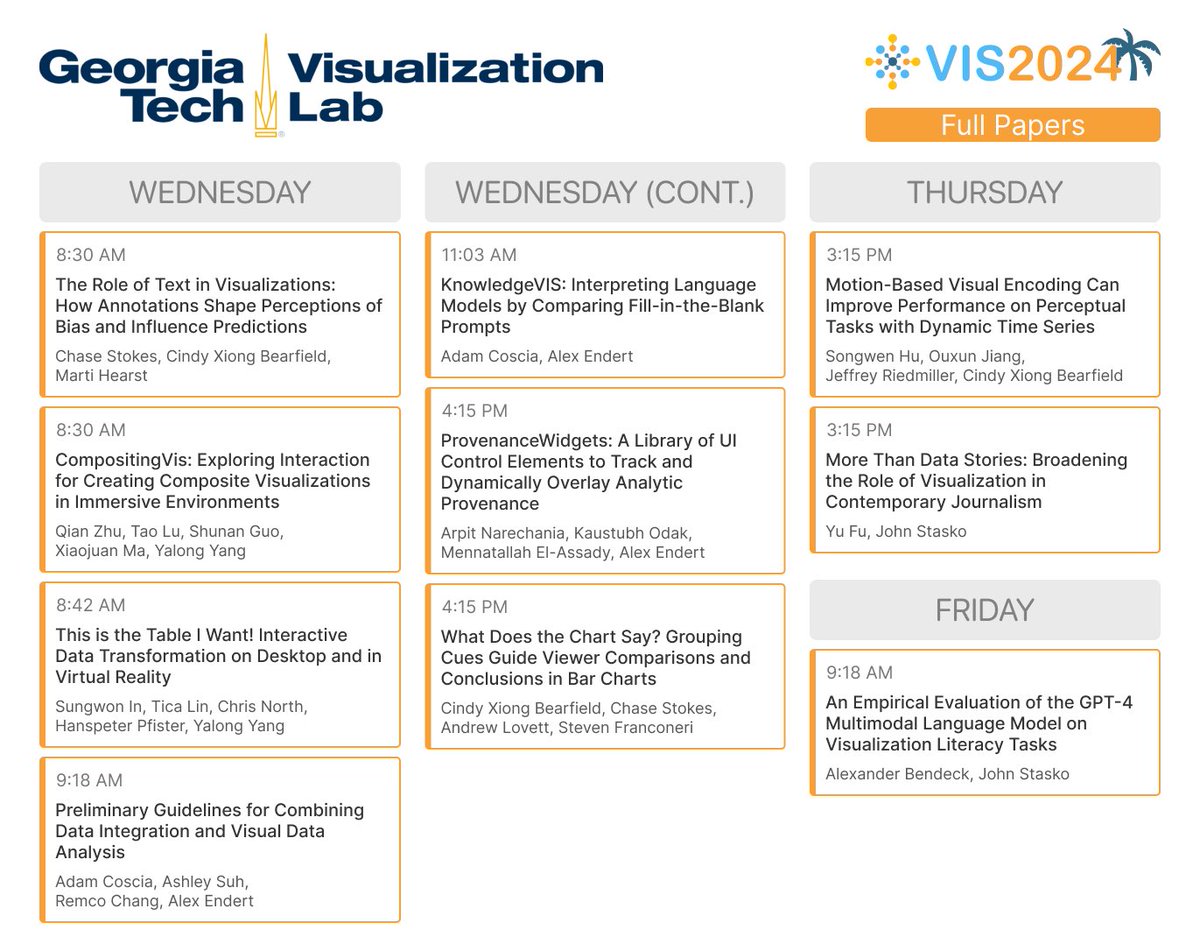


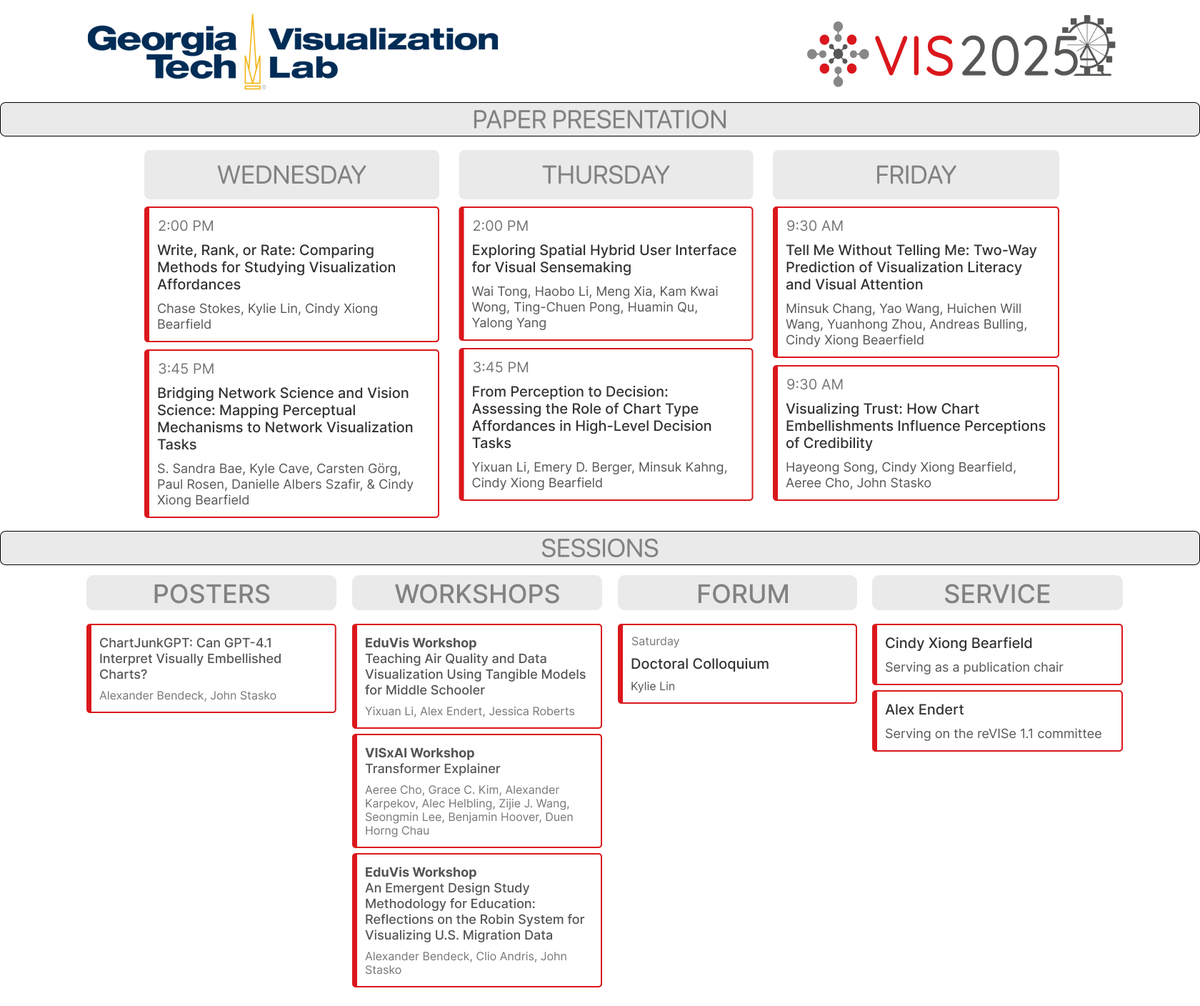
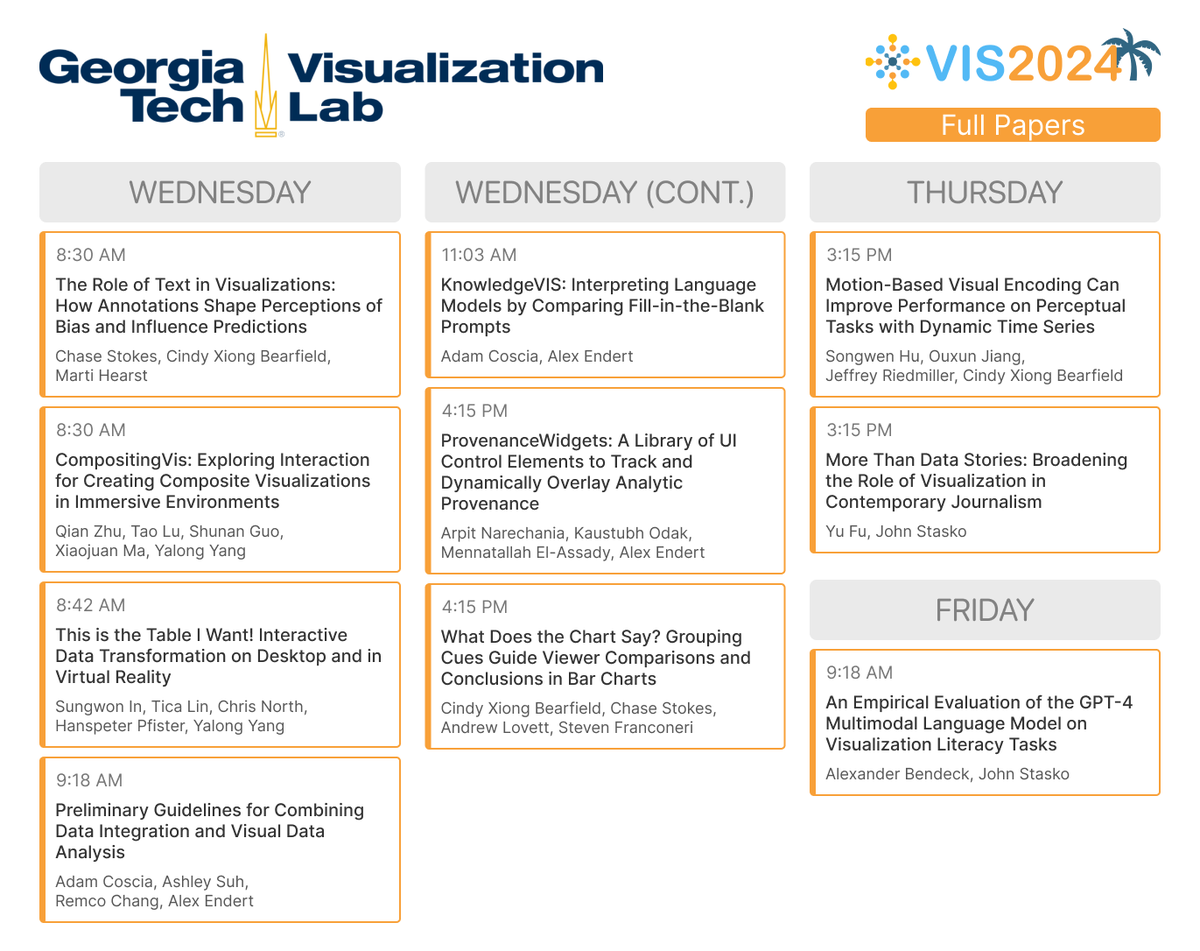
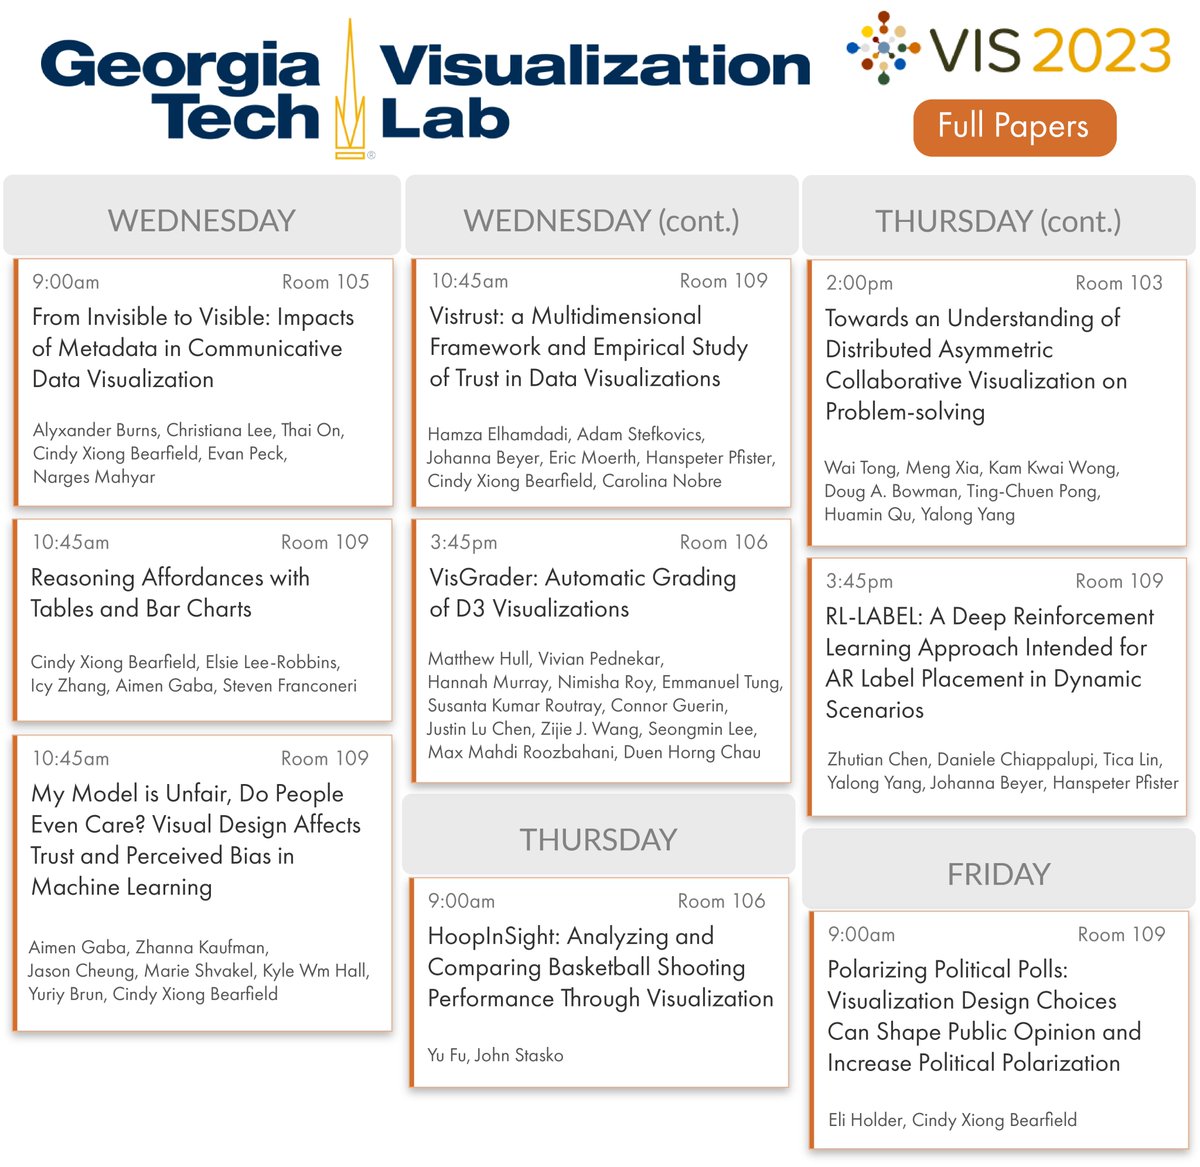
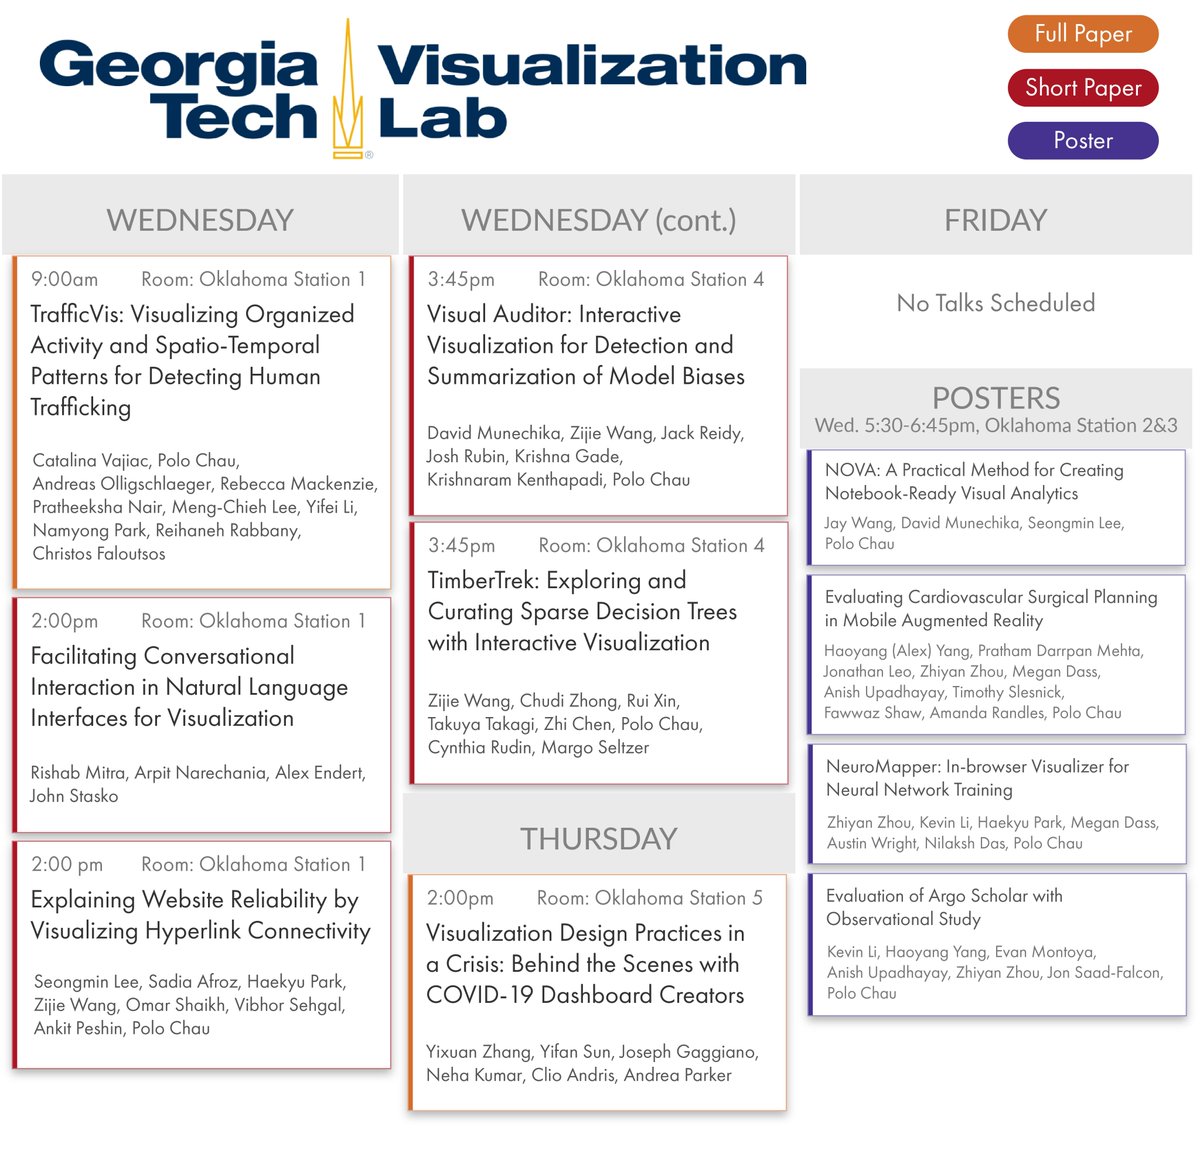
ALT Presentation Schedule of 10 Full Papers by the Georgia Tech Visualization Lab from Wednesday (16 Oct) through Friday (18 Oct) at IEEE VIS 2024.
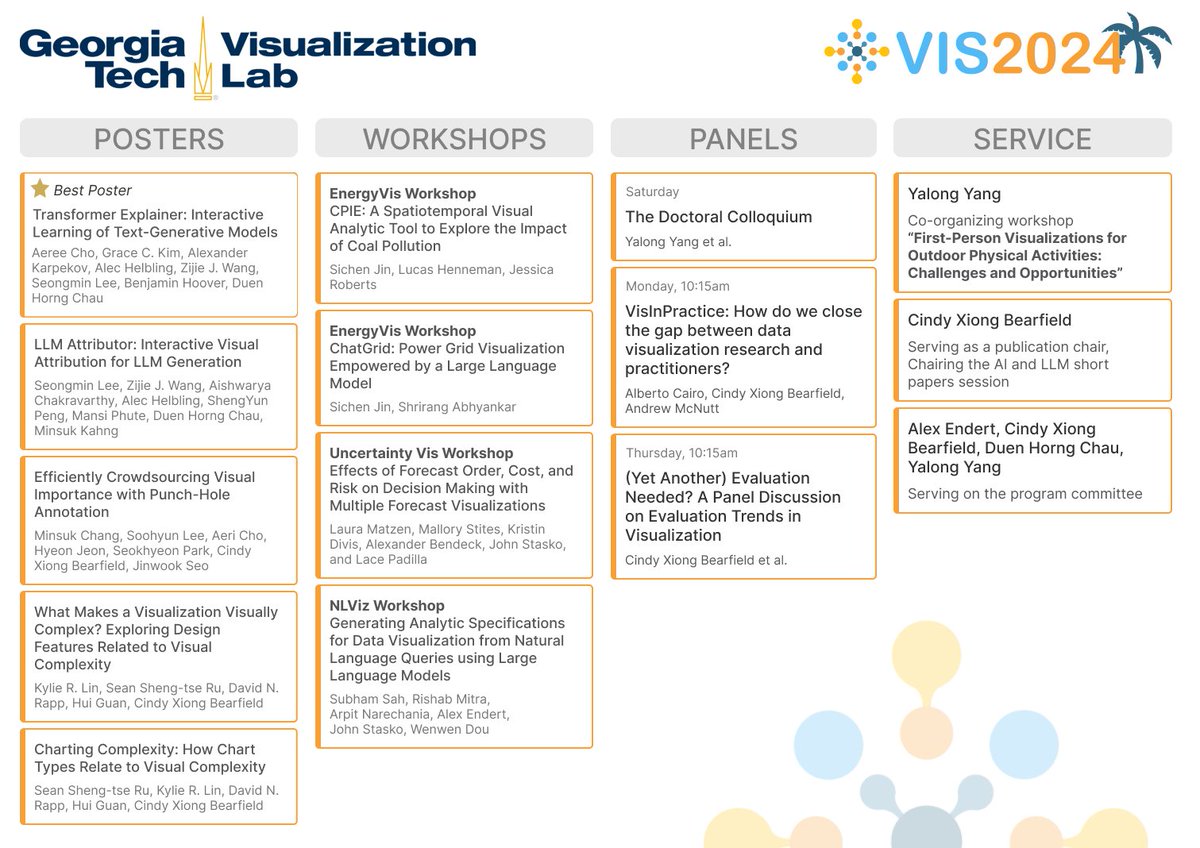
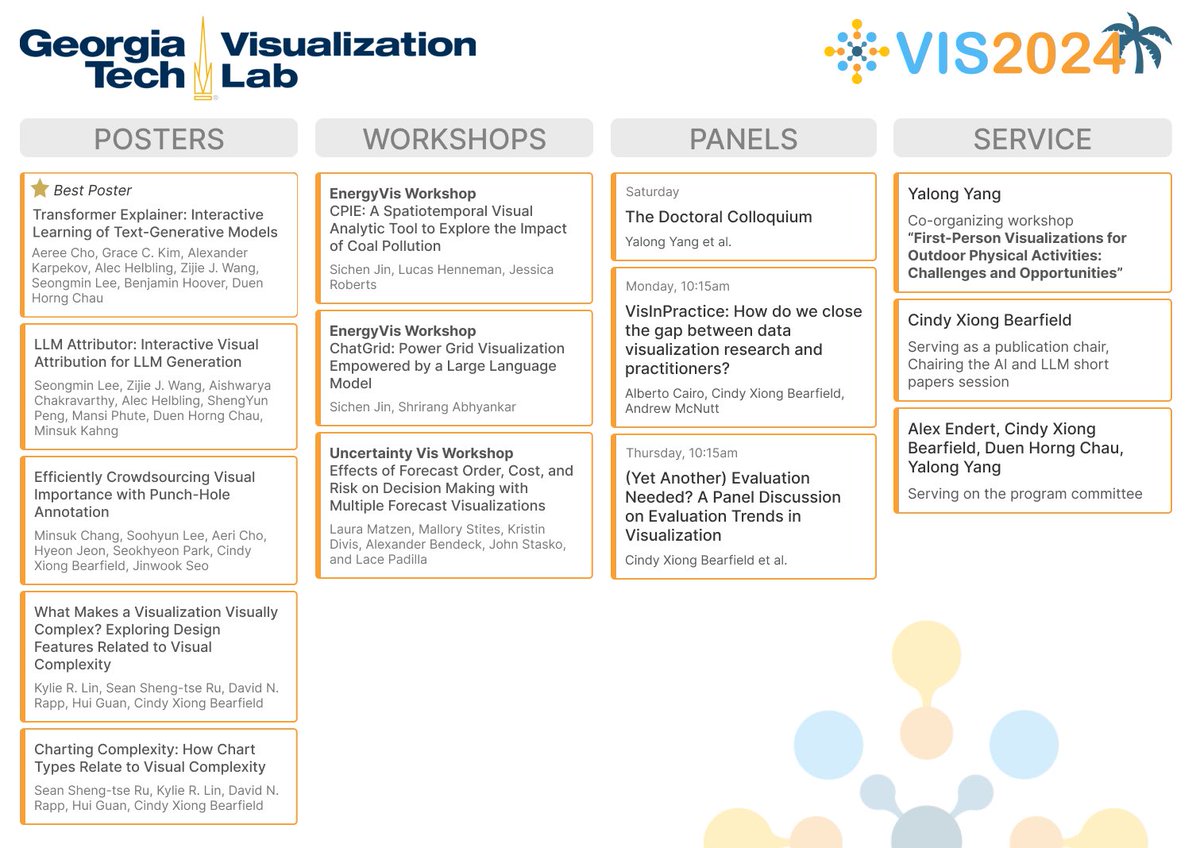
ALT 5 Posters, 4 Workshop Papers, 3 Panels, and 3 other Service contributions by the Georgia Tech Visualization Lab at IEEE VIS 2024.


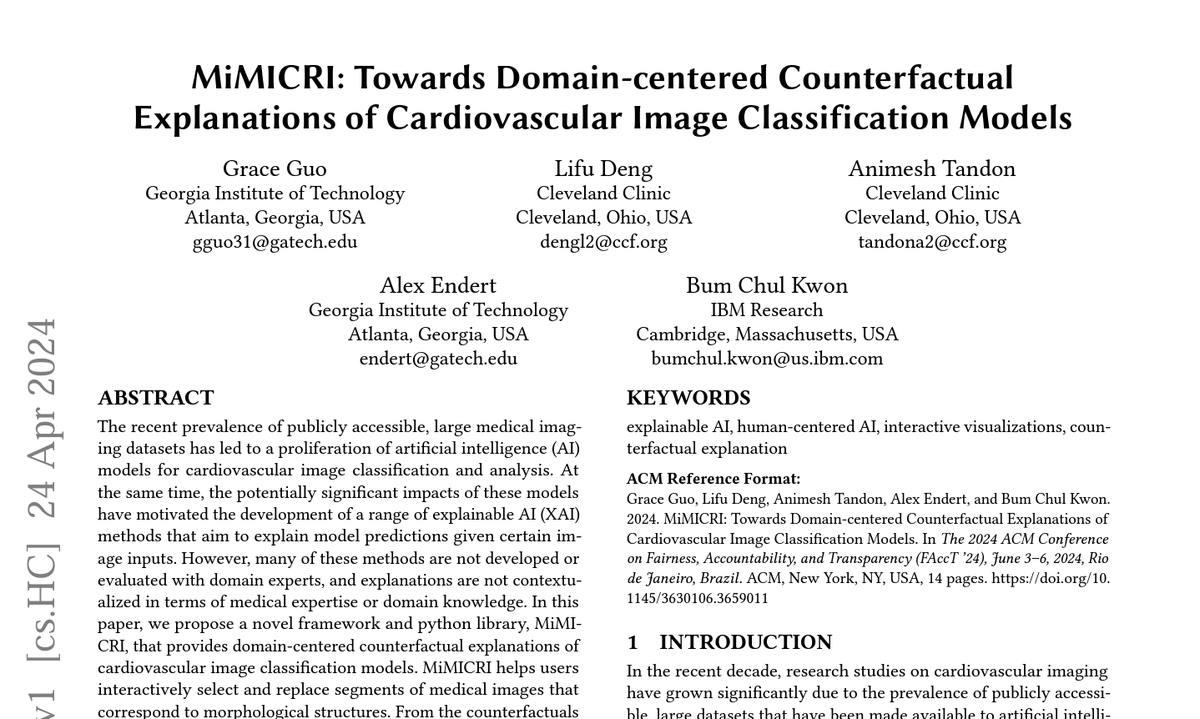
ALT Screenshot of MiMICRI paper.