
Joined October 2009
- Tweets 1,419
- Following 35
- Followers 23,996
- Likes 1,548
398 Photos and videos


In the past 3 years, square meter prices across Europe have moved very differently.
Biggest gains:
🇪🇸Madrid 37%
🇷🇴Bucharest 33%
🇨🇿Prague 29%
🇳🇱Amsterdam 27%
🇵🇱Warsaw 23%
🇬🇷Athens 21%
Meanwhile:
🇩🇪Munich -0.2%
🇫🇷Paris -5.5%
🇱🇺Luxembourg City -5.9%
🇫🇮Helsinki -6.5%
3
11
2,724
Average mortgage rates in Europe (latest data):
🇨🇭 Switzerland: 1.44%
🇲🇹 Malta: 2.05%
🇧🇬 Bulgaria: 2.47%
🇪🇸 Spain: 2.75%
🇫🇮 Finland: 2.77%
🇵🇹 Portugal: 2.83%
🇸🇮 Slovenia: 2.91%
🇭🇷 Croatia: 3.05%
🇨🇾 Cyprus: 3.06%
🇫🇷 France: 3.10%
Source: Longest available fixed-rate mortgage terms tracked by Global Property Guide.
1
1
4
1,839
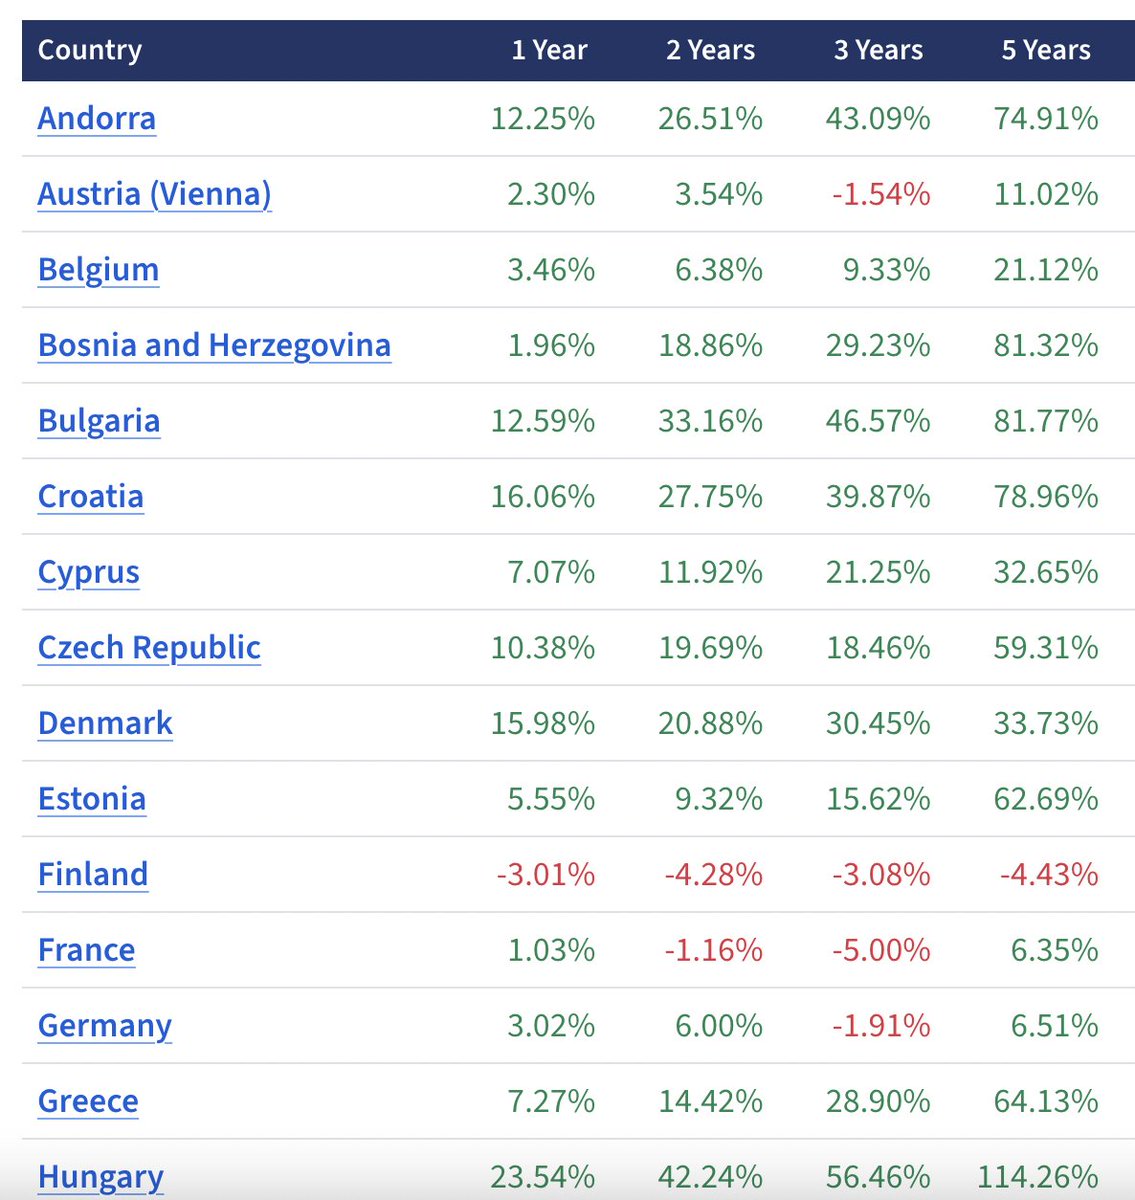
3-Year Nominal House Price Change in the 🇪🇺Eurozone (Latest Data):
🇵🇹Portugal: 52.9%
🇧🇬Bulgaria: 46.6%
🇭🇷Croatia: 39.9%
🇬🇷Greece: 28.9%
🇪🇸Spain: 27.5%
🇳🇱Netherlands: 22.8%
🇮🇪Ireland: 22.5%
🇸🇮Slovenia: 21.7%
🇨🇾Cyprus: 21.3%
🇱🇹Lithuania: 20.1%
10
63
38,746
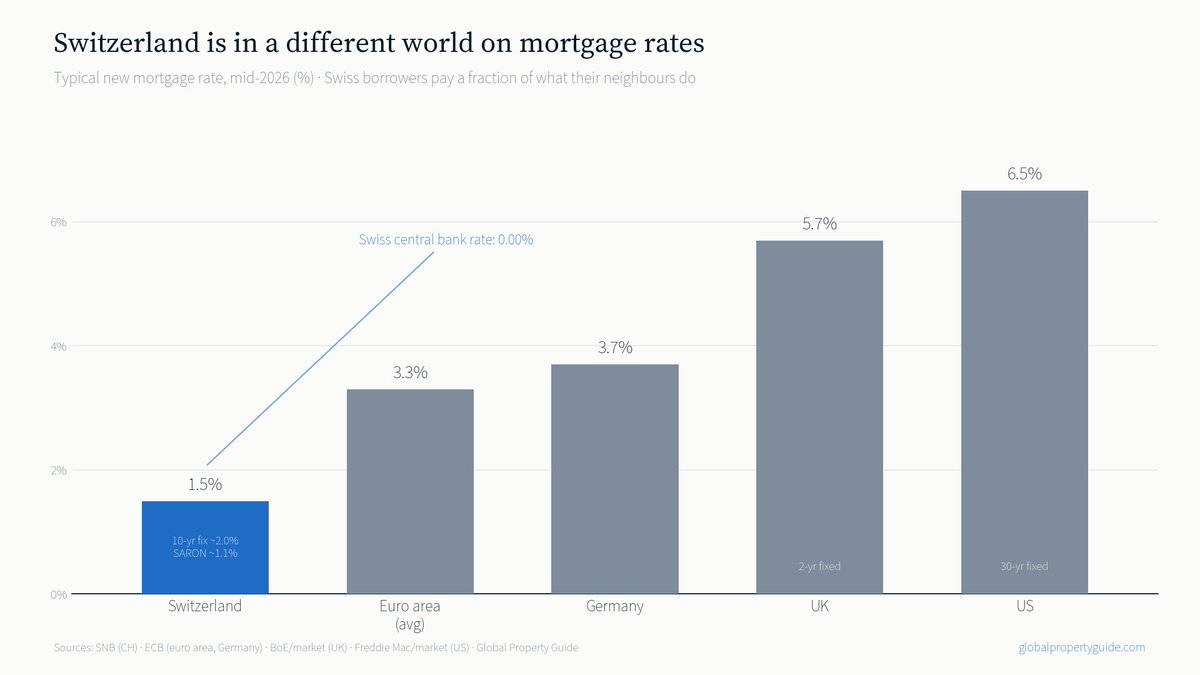
🇨🇭 Switzerland's real estate market is in a different world.
While much of Europe is still dealing with 3–4% mortgages, Switzerland has the lowest mortgage rates in Europe.
The central bank's policy rate is 0%. You can fix a 10-year mortgage at under 2%.
And with barely 1% of homes sitting empty, prices keep climbing - up 4.5% over the past year.
Low mortgage rates and almost no supply.
3
1
11
1,806
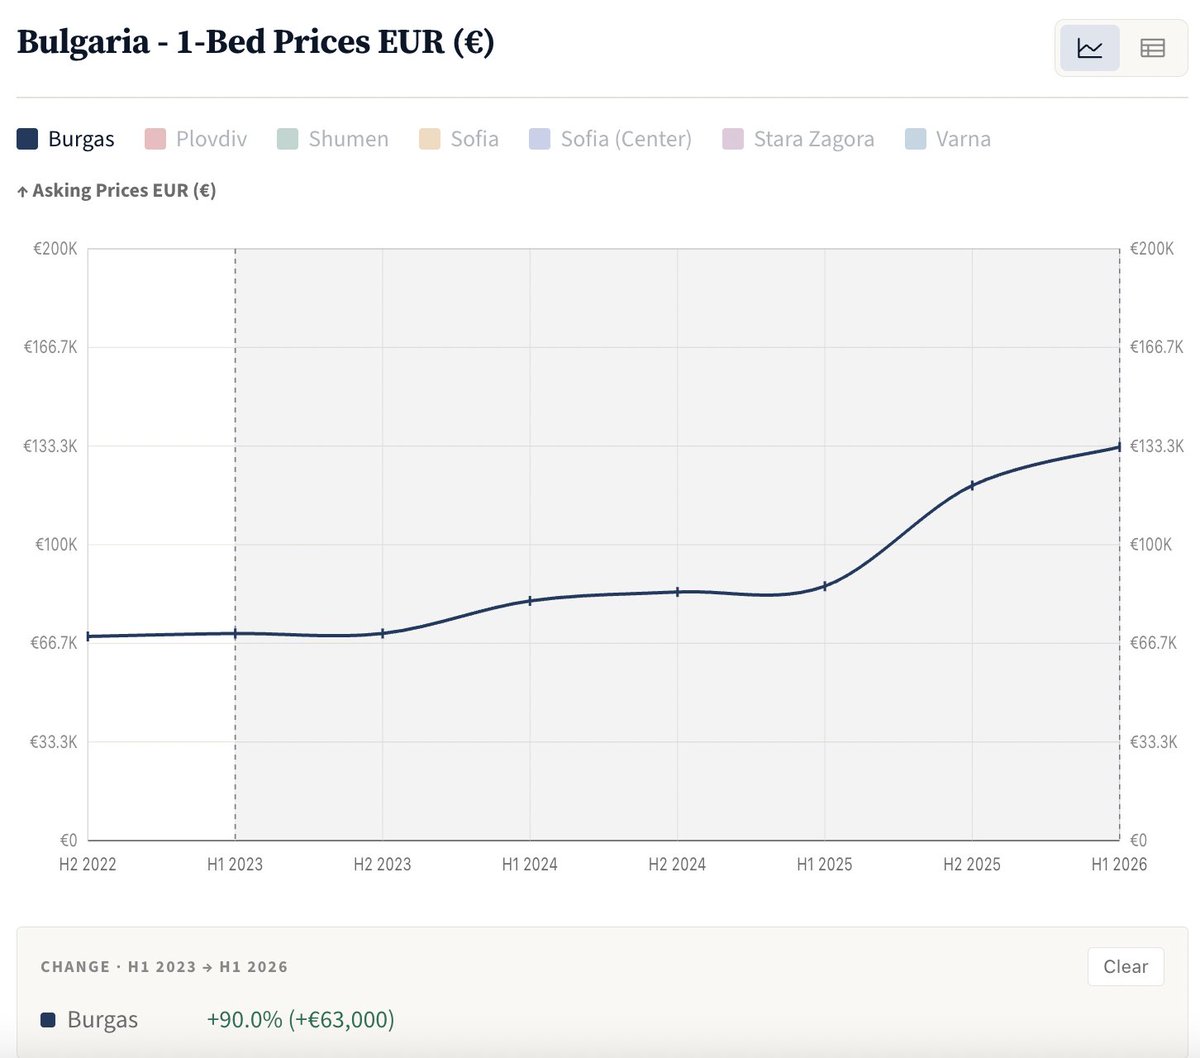
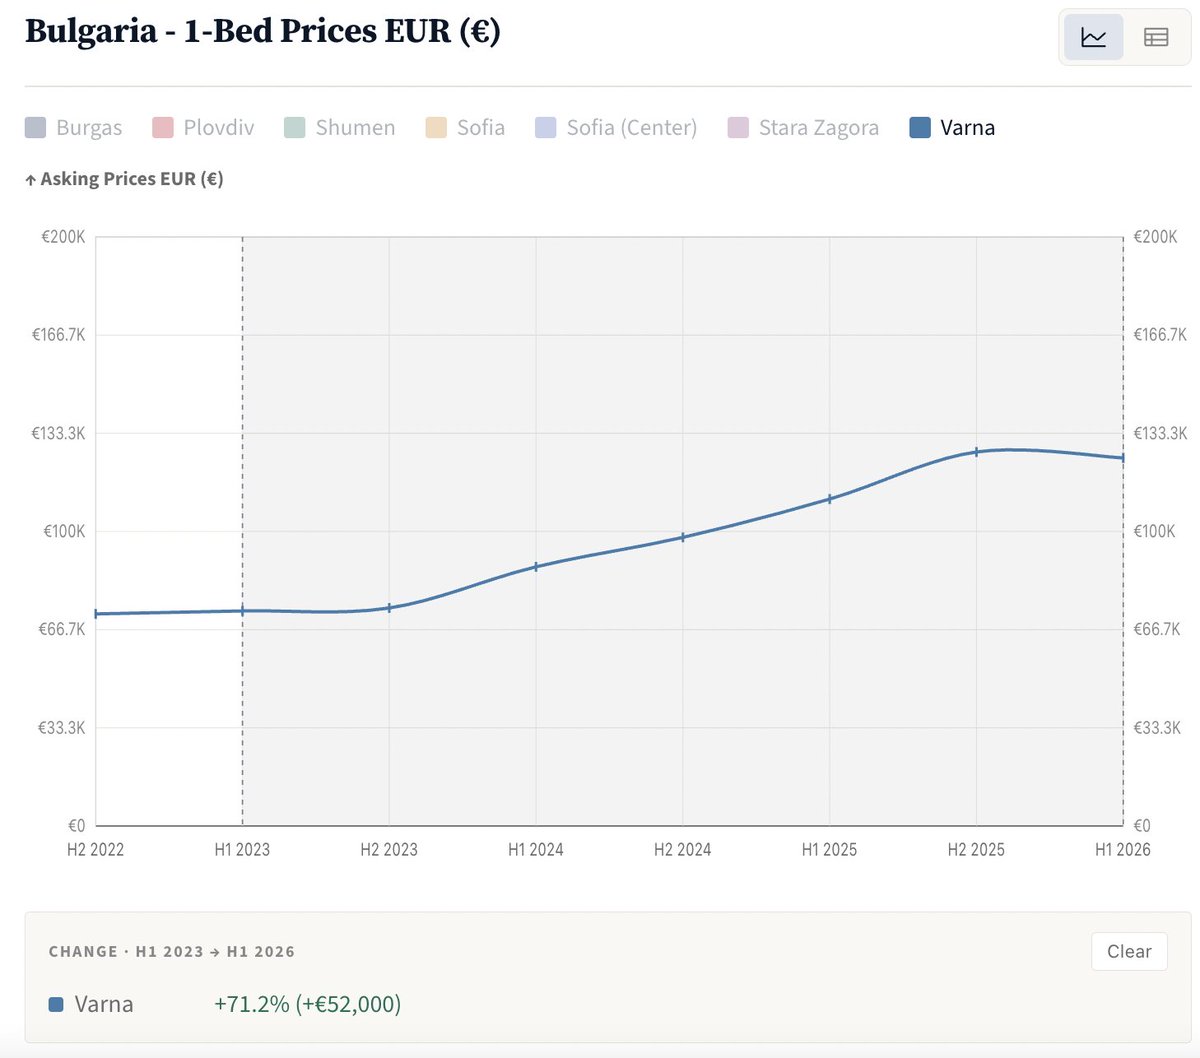
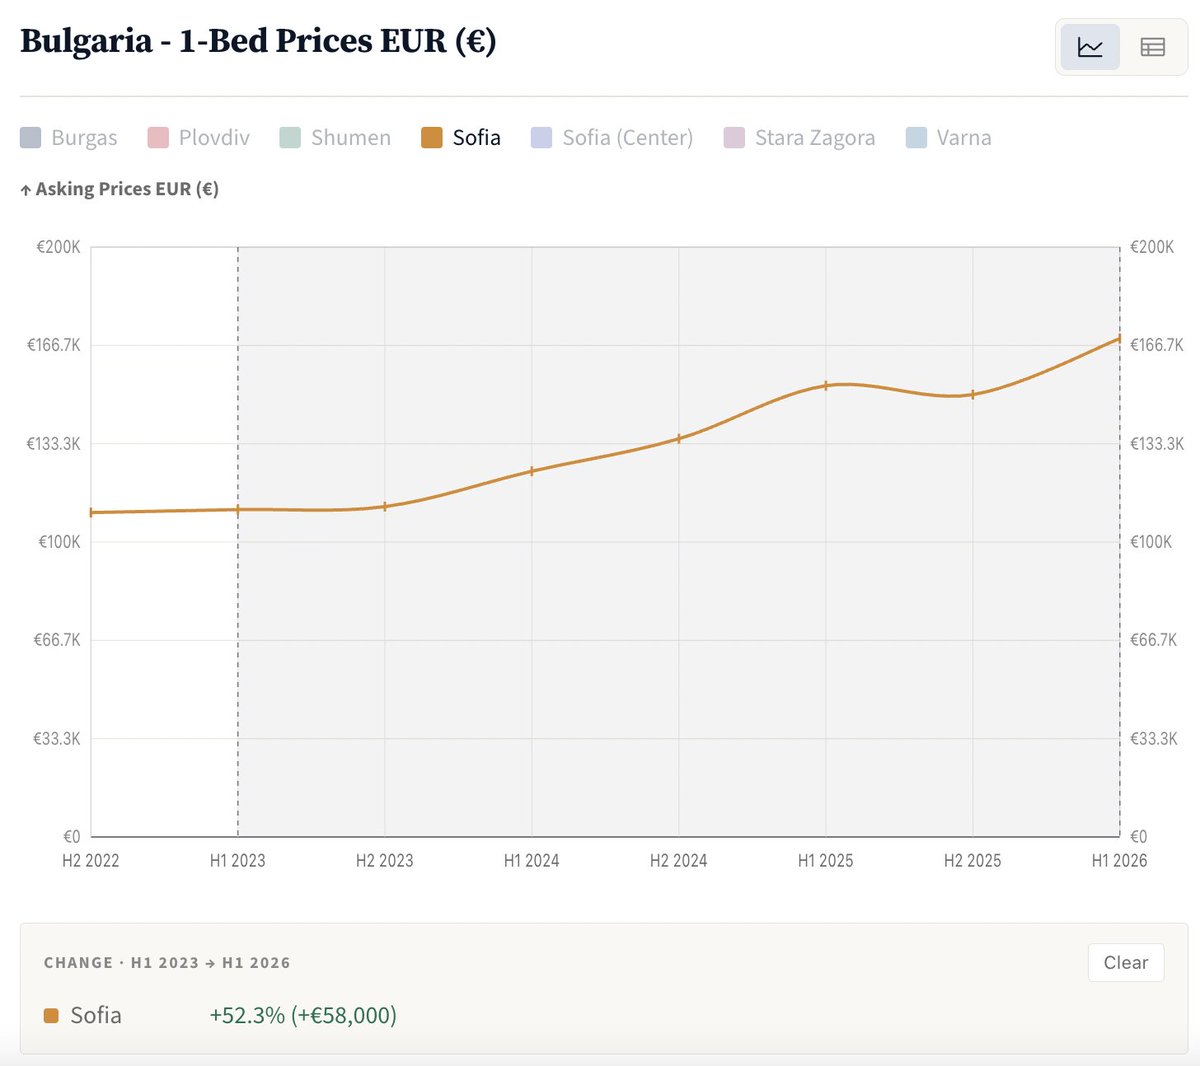
🇧🇬 Bulgaria is experiencing one of Europe's most extreme housing booms.
Nationwide house prices have surged nearly 50% in just three years.
In some cities, median asking prices are up close to 70% from 2023.
To put that into perspective:
A ~100,000 one-bedroom apartment in Sofia in 2023 costs now ~€150,000.
Meanwhile, mortgage rates continue to fall and buyers are increasingly buying newly built apartments, pushing average transaction values even higher.
Housing affordability is deteriorating rapidly, yet demand remains strong.
Many European housing markets are cooling.
Bulgaria appears to be doing the opposite. Whoever bought pre-2023 = well done.

4
5
35
35,362
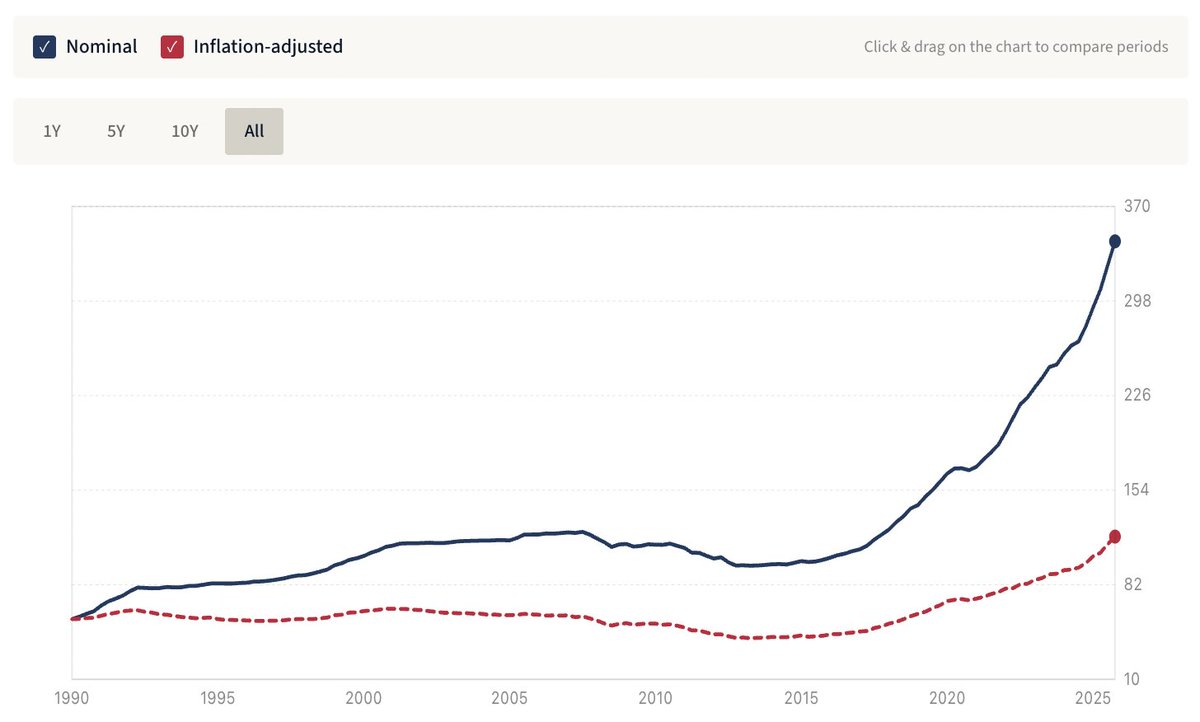
🇵🇹Portugal's housing boom still hasn't hit a ceiling.
Nationwide house prices rose another 5.24% in Q4 2025 vs Q3.
Year-over-year: 23.25%
A market growing 23% annually doubles roughly every 3 years if sustained.
Prices have now been on an upward trend for the past 13 years.
20
17
207
22,219
🇬🇪Tbilisi's post-pandemic boom is over. Asking rents fell 8% in 2024 and 11% in 2025, with another 2% drop forecast for 2026: a cumulative ~20% correction.
Sales prices rose just 3.27% nominal in Q4 2025, a 0.67% real decline once inflation is in.
However Batumi primary prices are still up 9.4% YoY with foreign buyers at 52% of sales, but Galt & Taggart warns growth is running ahead of demand.
2
10
2,001
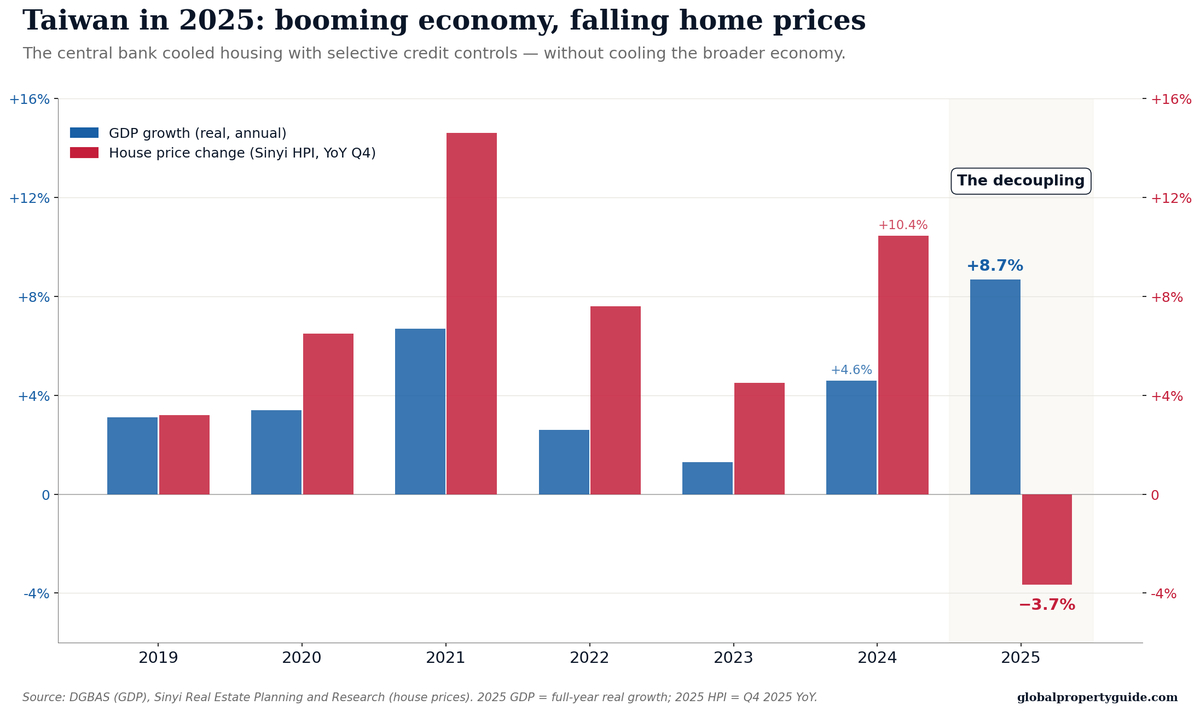
The 🇹🇼Taiwan housing market is doing something economists thought wasn't possible.
GDP in 2025: 8.7%. Best year in 15.
House prices in 2025: -3.7%. Worst slump in 9 years.
A central bank deliberately deflated a housing bubble during an export boom.
First the context:
From 2000–2025, house prices rose 282% in Taipei, 430% in Taoyuan, 420% in Taichung.
By 2024, Taipei's price-to-income ratio hit 16.4. Higher than Hong Kong (14.4). A typical household needed two-thirds of its income just for the mortgage.
Then the AI boom hit. Exports surged 35% in 2025. The economy ran hot. Most central banks would have let housing ride the wave. Taiwan's did the opposite.
Seven rounds of selective credit controls. LTVs slashed. 45% capital gains tax on quick flips. No grace periods on second-home loans.
The data 12 months later:
• Housing transactions: -25.5% (9-year low)
• New mortgage loans: -33.9%
• Construction licenses: -30% YoY in early 2026
• Prices in Tainan: -13%, Hsinchu: -8.5%
Meanwhile Q4 2025 GDP grew 12.65% - fastest single quarter since 1987.
1
8
1,947
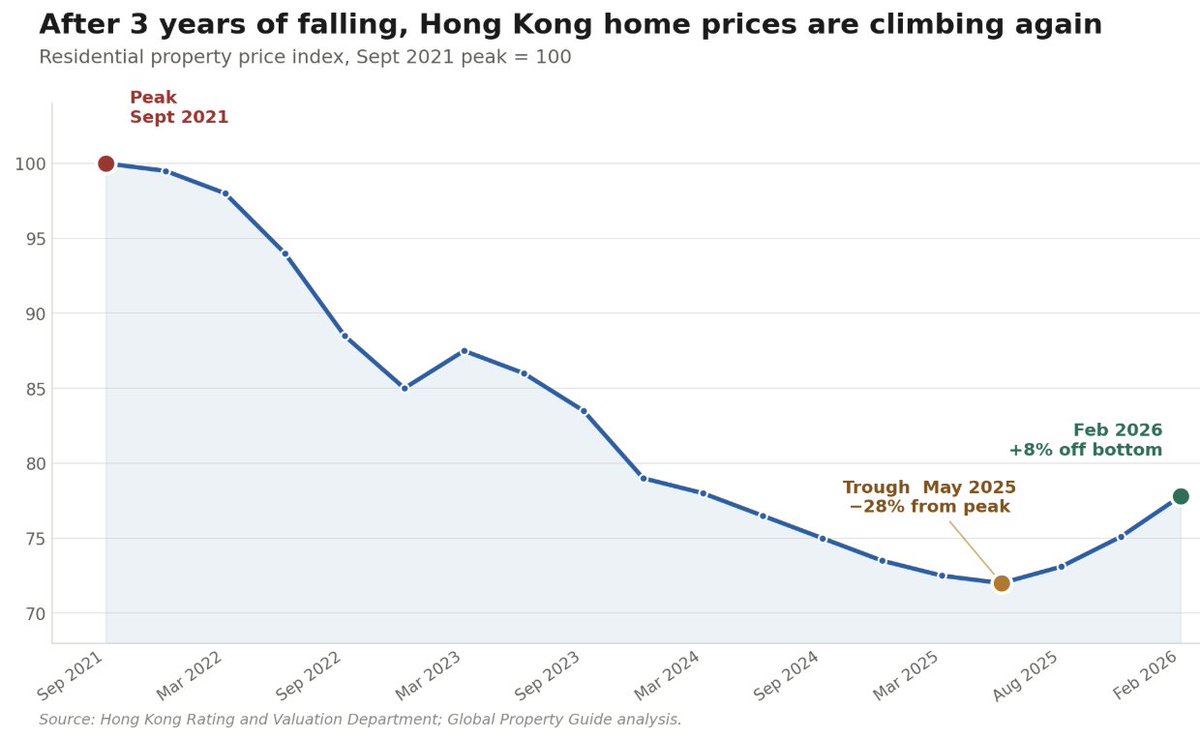
After 3 years of falling, Hong Kong home prices are climbing again.
After a brutal 28% slide from its 2021 peak, prices have now risen for nine consecutive months through February 2026 — up roughly 8% off the bottom.
Q1 2026 transactions jumped 53% year-on-year, the strongest quarterly demand in nearly five years.
The world's most unaffordable property market is officially in recovery mode.
2
3
1,295
Finland’s new apartment market remains near record lows.
Less than 90 new apartments were sold nationwide in each month from January to April.
These are historically weak numbers for the Finnish housing market.
10
4,277
Europe Median Asking Prices (Latest Data):
🇨🇭Zurich: €1,150,000
🇩🇰Copenhagen: €575,000
🇩🇪Munich: €548,000
🇬🇧London: €524,000
🇫🇷Paris: €443,000
🇵🇹Lisbon: €415,000
🇳🇱Amsterdam: €400,000
🇨🇿Prague: €336,000
🇪🇸Madrid: €240,000
🇭🇺Budapest: €215,000
🇵🇱Warsaw: €174,000
5
10
73
17,109
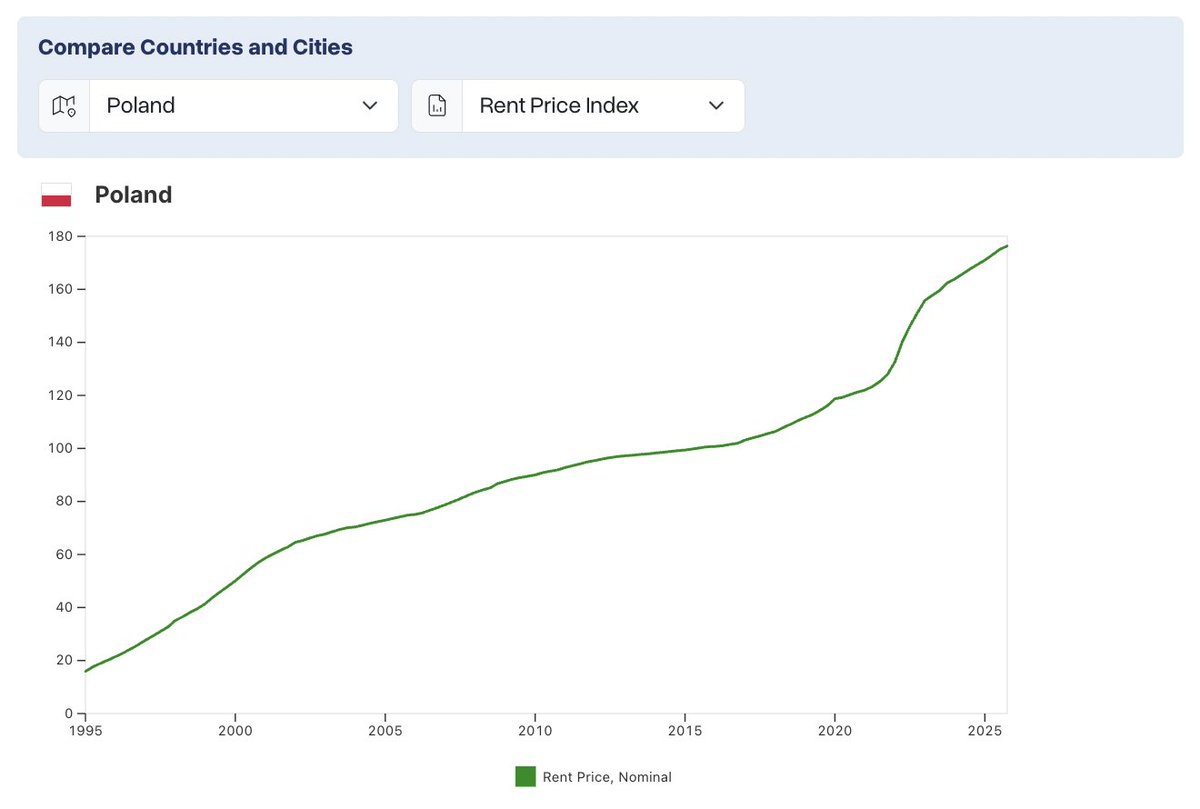
🇵🇱Poland Rent Price Index (National, Latest Data)
1 Year: 4.2%
2 Years: 8.6%
3 Years: 16.7%
5 Years: 45.5%
10 Years: 75.3%
15 Years: 91.9%
Note: Rents in Poland have almost doubled since 2010.
Source: Global Property Guide, OECD
1
18
3,231
Square Meter Prices in World Cities (Latest Data)
🇭🇰 Hong Kong: $22,291
🇨🇭 Zurich: $21,145
🇸🇬 Singapore: $18,952
🇮🇱 Tel Aviv: $14,832
🇫🇷 Paris: $11,008
🇳🇱 Amsterdam: $10,946
🇳🇴 Oslo: $10,825
🇰🇷 Seoul: $10,740
🇩🇪 Munich: $10,647
🇩🇰 Copenhagen: $9,749
🇸🇪 Stockholm: $9,720
🇬🇧 London: $9,686
🇮🇪 Dublin: $9,546
🇦🇹 Vienna: $9,013
4
15
23
25,149
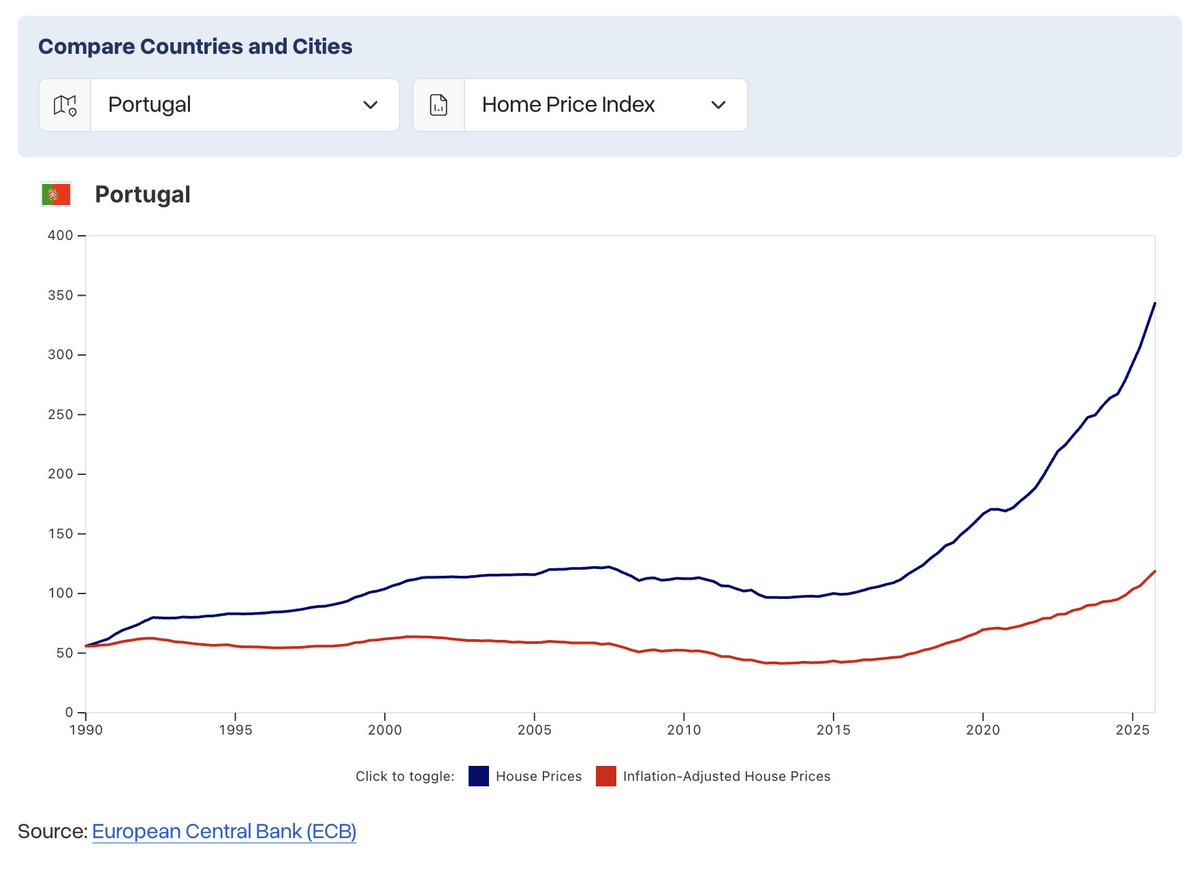
🇵🇹Portugal House Price Change:
1 Year: 23%
2 Years: 37%
3 Years: 53%
5 Years: 103%
10 Years: 239%
Adjusted for inflation:
1 Year: 20%
2 Years: 31%
3 Years: 43%
5 Years: 69%
10 Years: 174%
Note: Portugal house prices have grown the most in Europe over the last 10 years.
4
11
47
16,493
Real estate prices have surged in several countries over the past 5 years.
From 2020 to 2025, these markets saw some of the strongest growth:
Montenegro: 154%
Moldova: 114%
Pakistan: 104%
Hungary: 104%
Portugal: 103%
Egypt: 97%
Mauritius: 93%
Bulgaria: 84%
On paper, that looks like ~20% annual returns. Add rental income, and total returns could reach ~25% per year. But there’s a catch: these are local currency returns.
For a USD-based investor, currency movements can significantly change the outcome:
Montenegro (EUR): 3%
Moldova (MDL): –2%
Pakistan (PKR): –44%
Hungary (HUF): –3%
Portugal (EUR): 3%
Egypt (EGP): –67%
Mauritius (MUR): –10%
Bulgaria (EUR): 3%
So while nominal returns look strong, in several cases (Egypt, Pakistan) a large part of the gain was offset by currency depreciation.
And even this isn’t the full picture. For local investors, the key metric is inflation-adjusted performance — not nominal price growth.
In simple terms: Did property prices actually increase in real terms, or just keep up with inflation?
Historically, investors aim to beat inflation and generate ~5% real returns annually.
Here’s how nominal gains compare to real (inflation-adjusted) gains from 2020 to 2025:
Montenegro: 154% → 86%
Moldova: 114% → 24%
Pakistan: 104% → 2.6%
Hungary: 104% → 34%
Portugal: 103% → 69%
Egypt: 97% → –17%
Mauritius: 93% → 44%
Bulgaria: 84% → 31%
Strong nominal growth can be misleading. In high-inflation or weak-currency markets, much of the gain exists only on paper.
To avoid this, always evaluate returns in USD/EUR (or your base currency) and focus on inflation-adjusted performance - not just nominal price growth.
1
1
19
2,717
5-Year House Price Change in Asia-Pacific (Nominal, Latest Data)
🇰🇿 Kazakhstan: 66.1%
🇦🇺 Australia: 54.9%
🇬🇪 Georgia: 48.7%
🇯🇵 Japan: 44.6%
🇹🇼 Taiwan: 41.2%
🇸🇬 Singapore: 37.8%
🇵🇭 Philippines: 27.3%
🇮🇳 India: 17.1%
🇲🇾 Malaysia: 14.6%
🇹🇭 Thailand: 13.7%
3
4
22
3,941
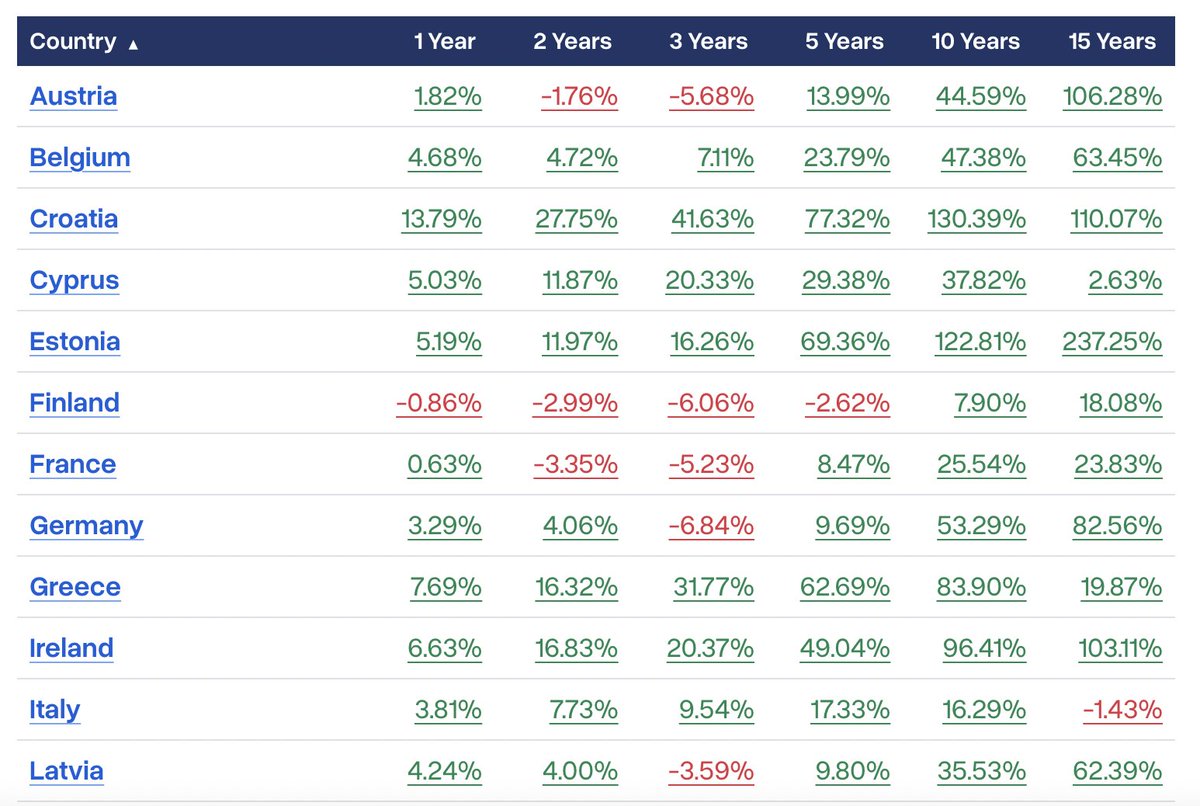
1-Year House Price Change in 🇪🇺EU (Nominal, Latest Data):
🇵🇹 Portugal: 23.25%
🇭🇷 Croatia: 13.79%
🇪🇸 Spain: 12.10%
🇸🇰 Slovakia: 11.67%
🇱🇹 Lithuania: 11.34%
🇬🇷 Greece: 7.69%
🇲🇹 Malta: 6.87%
🇮🇪 Ireland: 6.63%
🇪🇪 Estonia: 5.19%
🇨🇾 Cyprus: 5.03%
🇧🇪 Belgium: 4.68%
🇱🇻 Latvia: 4.24%
6
13
147
20,214
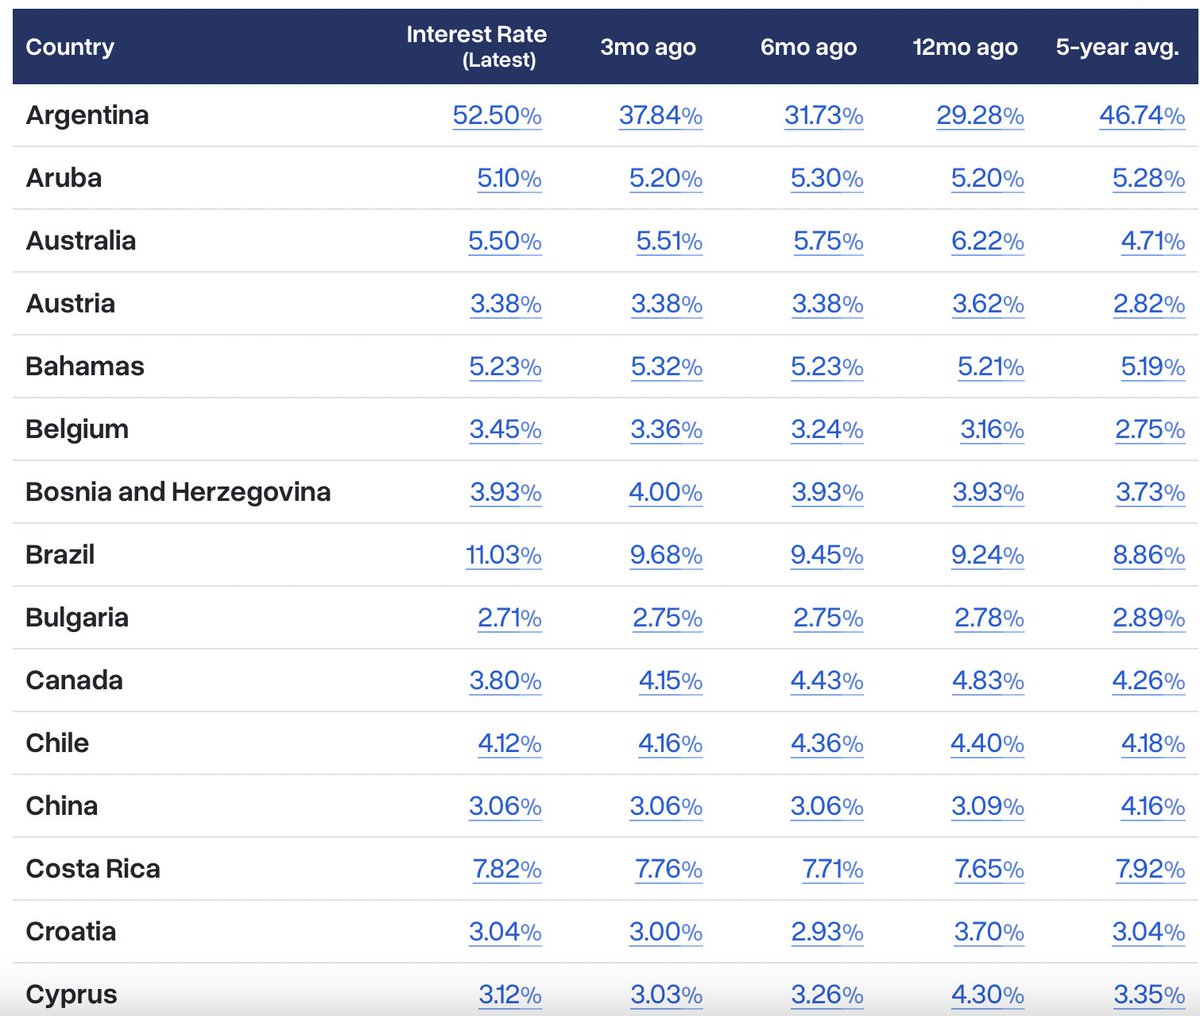
Global residential mortgage rates right now:
Ultra-low financing (~2%)
🇨🇭Switzerland: 1.38%
🇲🇹Malta: 2.01%
🇹🇼Taiwan: 2.33%
Cheap Europe (2–3%)
🇪🇸Spain: 2.61%
🇧🇬Bulgaria: 2.71%
🇫🇮Finland: 2.82%
🇵🇹Portugal: 2.84%
Mid-range (3–6%)
🇩🇪Germany: 3.71%
🇨🇦Canada: 3.80%
🇬🇧UK: 4.52%
🇦🇺Australia: 5.50%
High-rate markets (7–12%)
🇭🇺Hungary: 7.72%
🇨🇷Costa Rica: 7.82%
🇧🇷Brazil: 11.03%
🇲🇽Mexico: 11.45%
Note: Mortgage rates are not just about property - they reflect inflation, currency risk, and financial stability.
If you're investing globally, financing cost = strategy.
1
6
30
13,891
Countries with highest (gross) rental yields (Q1 2025):
🇿🇦 South Africa: 10.93%
🇲🇳 Mongolia: 10.75%
🇰🇿 Kazakhstan: 10.50%
🇩🇴 Dominican Republic: 8.53%
🇲🇩 Moldova: 8.23%
🇨🇷 Costa Rica: 7.80%
🇮🇪 Ireland: 7.71%
🇺🇦 Ukraine: 7.55%
🇰🇭 Cambodia: 7.54%
🇬🇪 Georgia: 7.42%
1
11
2,565
Lowest Residential Mortgage Rates (Q4 2025 and Y-o-Y change):
🇨🇭Switzerland: 1.38% (-0.34%)
🇲🇹Malta: 2.01% ( 0.04%)
🇹🇼Taiwan: 2.33% ( 0.42%)
🇪🇸Spain: 2.61% (-0.03%)
🇧🇬Bulgaria: 2.71% (-0.18%)
🇫🇮Finland: 2.82% ( 0.21%)
🇵🇹Portugal: 2.84% ( 0.21%)
🇸🇮Slovenia: 2.86% (-0.05%)
🇫🇷France: 2.99% ( 0.60%)
🇭🇷Croatia: 3.04% (-0.00%)
2
3
31
5,601