
Joined October 2016
- Tweets 1,226
- Following 2
- Followers 10,999
- Likes 603
621 Photos and videos


Pinned Tweet

GoLand 2026.1 is here, and it brings:
🔹Go 1.26 syntax updates and ways to quickly modernize your code
🔹Native Terraform Stacks
🔹Support for Git worktrees
🔹Agent Client Protocol
🔹Editor improvements
Read more 👉 jetbrains.com/go/whatsnew/

4
39
2,914
We're heading to @gopherconeu next week!
Stop by our booth to say hi, talk Go, and see what's new in GoLand.
Looking forward to meeting the Go community in person 👋

SPONSOR POST
Meet the team behind @GoLandIDE and chat about #Golang workflows, debugging, profiling, AI tooling, and the day-to-day challenges of building in Go.
Stop by their booth to ask questions, and see what’s new in GoLand.
Learn more 👉jetbrains.com/go/

1
8
585
🔥Hot take: Heap and allocs are the same profile. They collect the same data. The only difference is the view they default to:
🔹Heap defaults to `inuse_space` (memory currently live).
🔹Allocs defaults to `alloc_space` (total memory allocated since startup).
🧵 0/2
1
4
638
`inuse` tells you what’s still alive on the heap. Check it when memory keeps growing, GC is overworked, or you suspect retained objects.
😎Pro tip: Force GC first before running a heap or allocs profile for the clearest view of currently live objects.
🧵 1/2
1
3
416
`alloc` tells you where allocations are coming from over time. Use this parameter when your app creates too much garbage, even if memory is eventually freed.
🧵 2/2
3
360
A CPU profile samples active execution and shows hot paths: parsing, serialization, hashing, tight loops, or expensive business logic.
Use it when your Go app is burning CPU or a benchmark is slower than expected – it’s a great first stop for CPU-bound performance problems.
🧵 0/1
1
6
693
CPU profiling does not tell you where time is spent waiting.
If your service is slow because goroutines are blocked on locks, channels, I/O, or the network, then the CPU may look okay.
Low CPU high latency? Reach for block, mutex, or goroutine profiles.
🧵 1/1
1
3
446
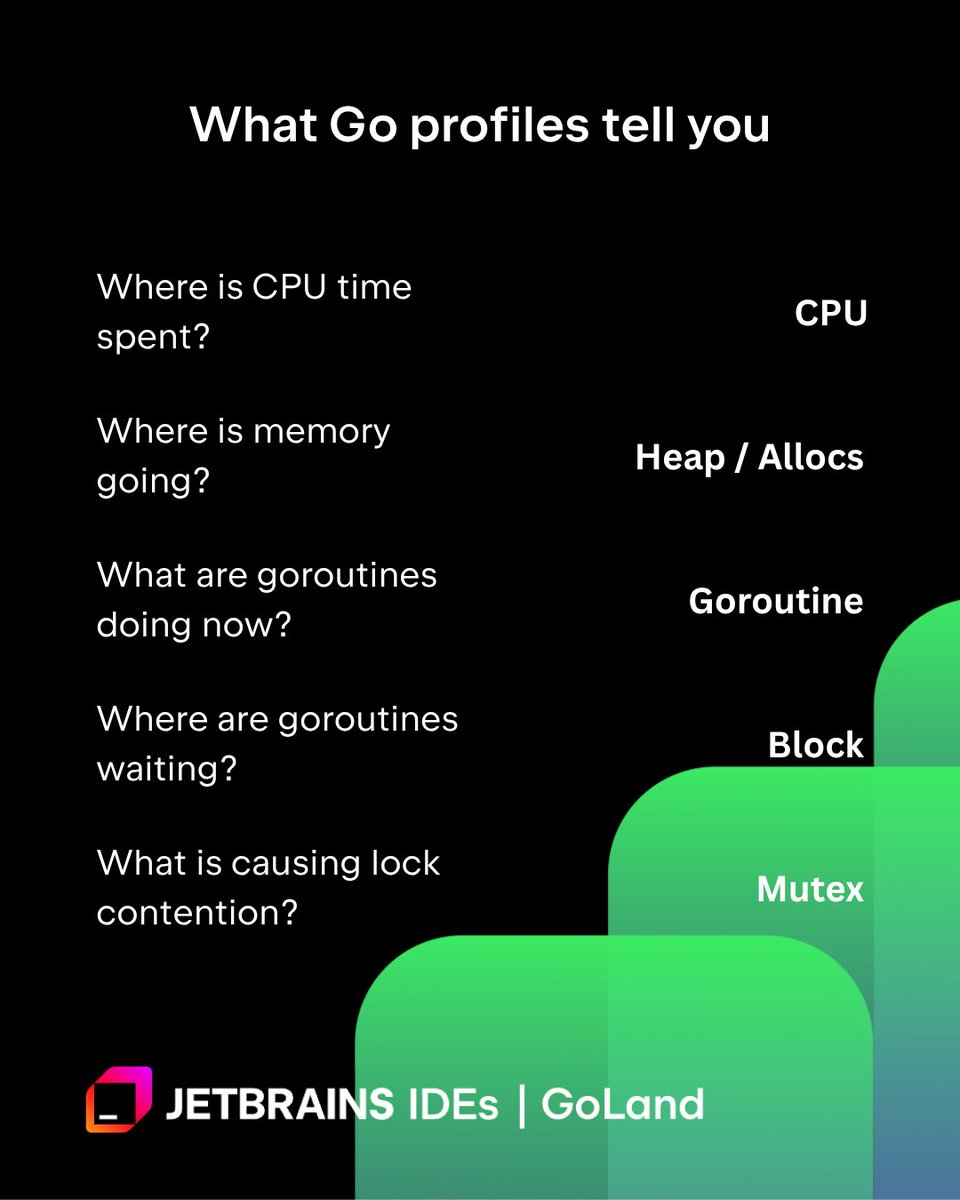
Different profiles answer different questions. Here’s a cheat sheet:
🔹 CPU: Where is the CPU time spent?
🔹 Heap/allocs: Where is memory going?
🔹 Block: Where are goroutines waiting?
🔹 Goroutine: What are goroutines doing right now?
🔹 Mutex: What is causing lock contention?
1
12
658
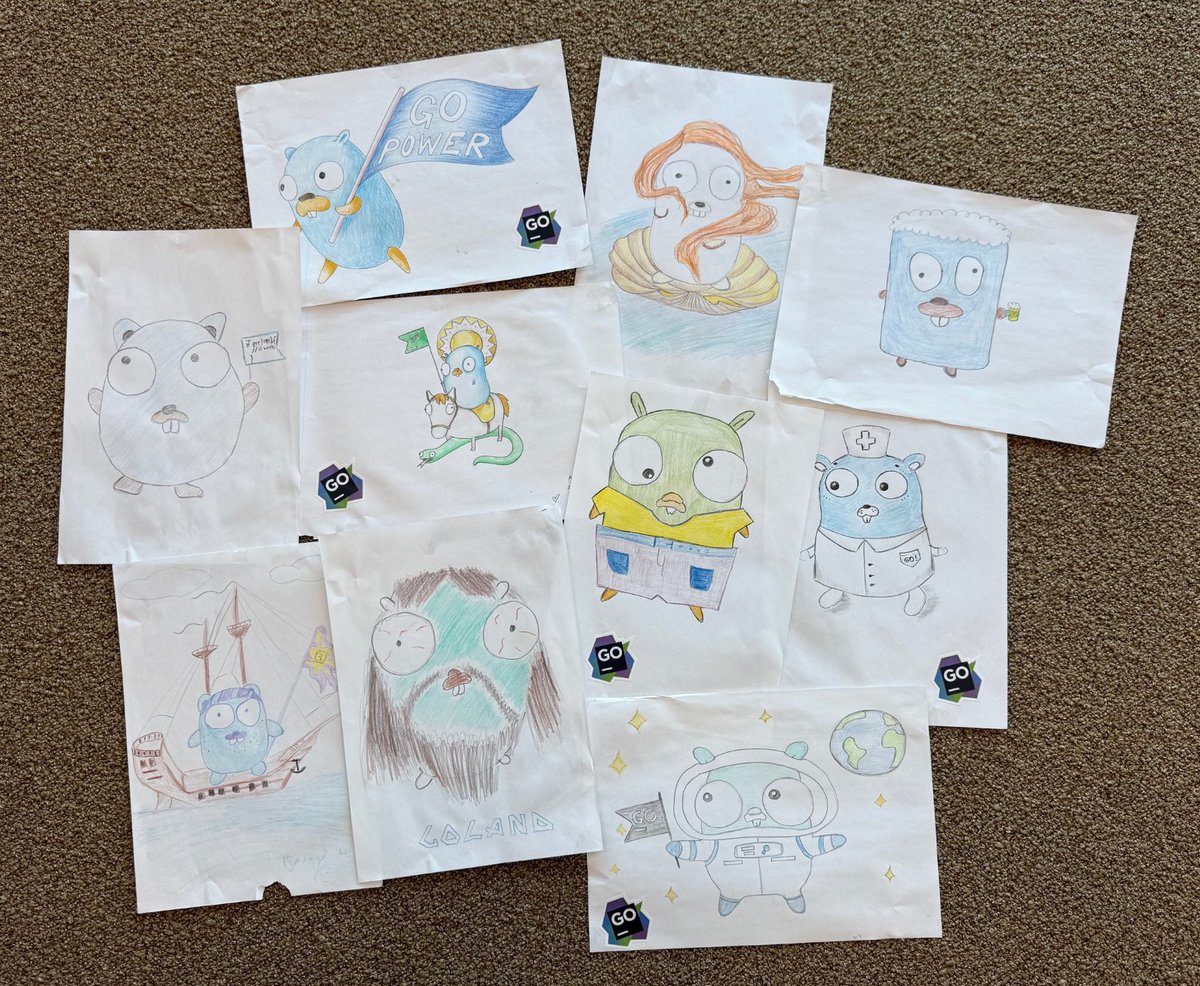
Here’s what happens when developers spend time in the playground, but not the one for writing Go code.
How about you, have you been creative recently? Show us your art, we’d love to see it!
2
7
375
GoLand, a JetBrains IDE retweeted

May 26
This might be more info than you'll ever need about @golang profiling, but this data is handy when you need to really explore software performance.
This @jetbrains blog explains it, and shows why GoLand is a great IDE for Go devs ... blog.jetbrains.com/go/2026/0…
6
18
1,480
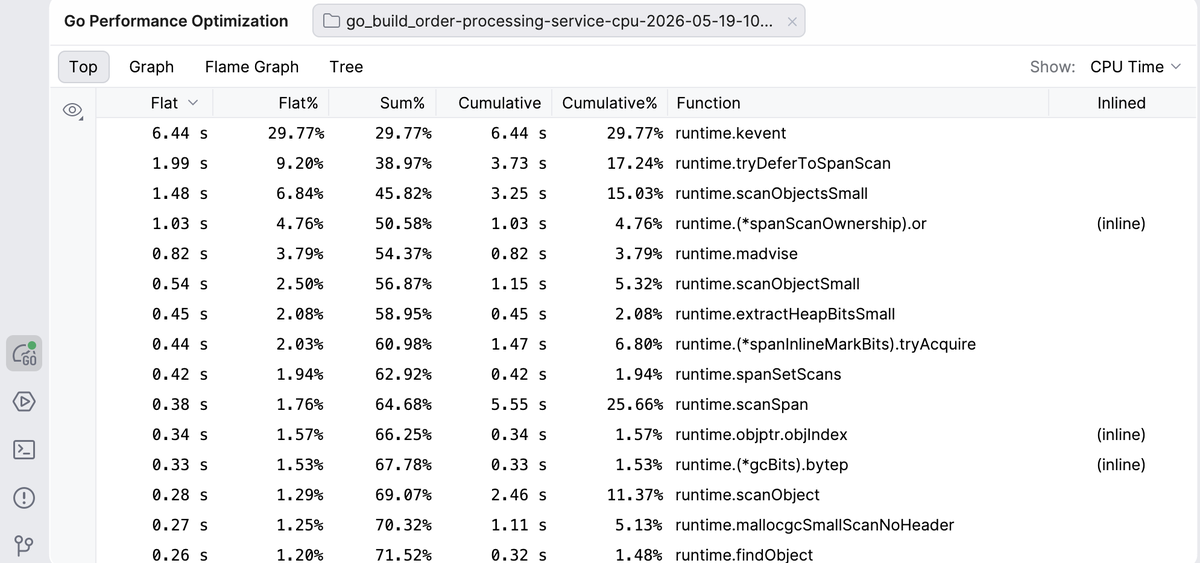
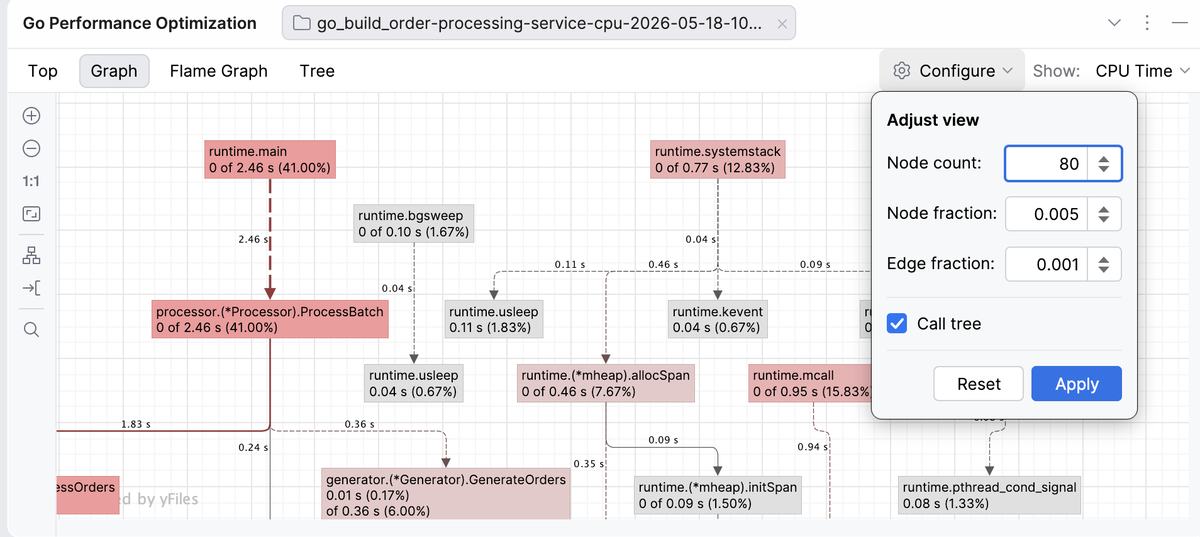
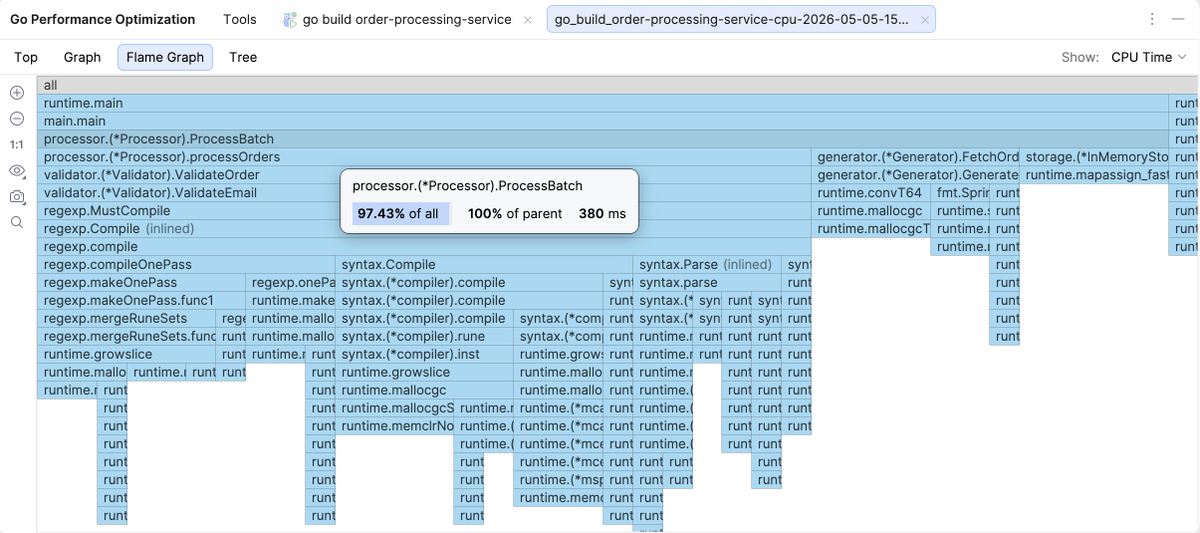
Exploring @golang profiles with GoLand is like exploring them with pprof’s web interface… but better! See what kinds of views are now available directly in your IDE 🧵
1
1
20
2,470
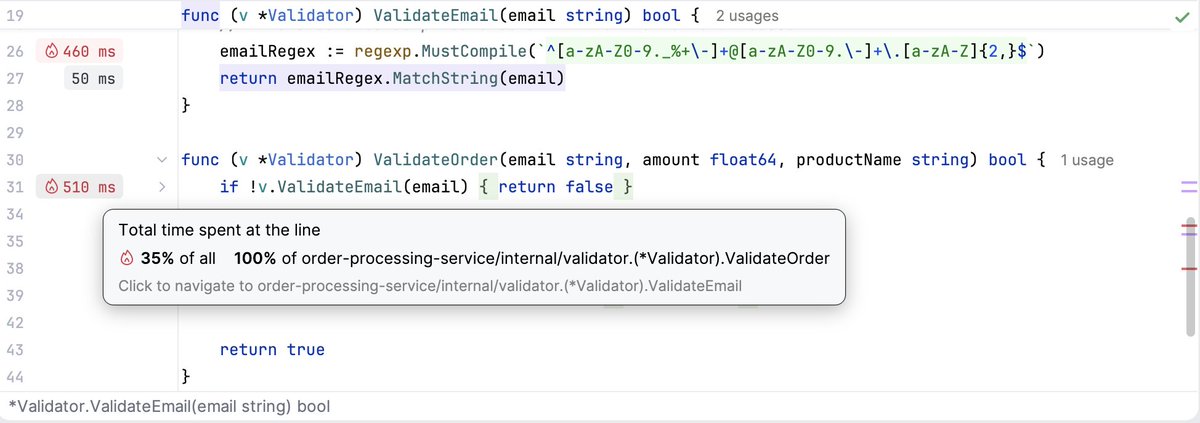
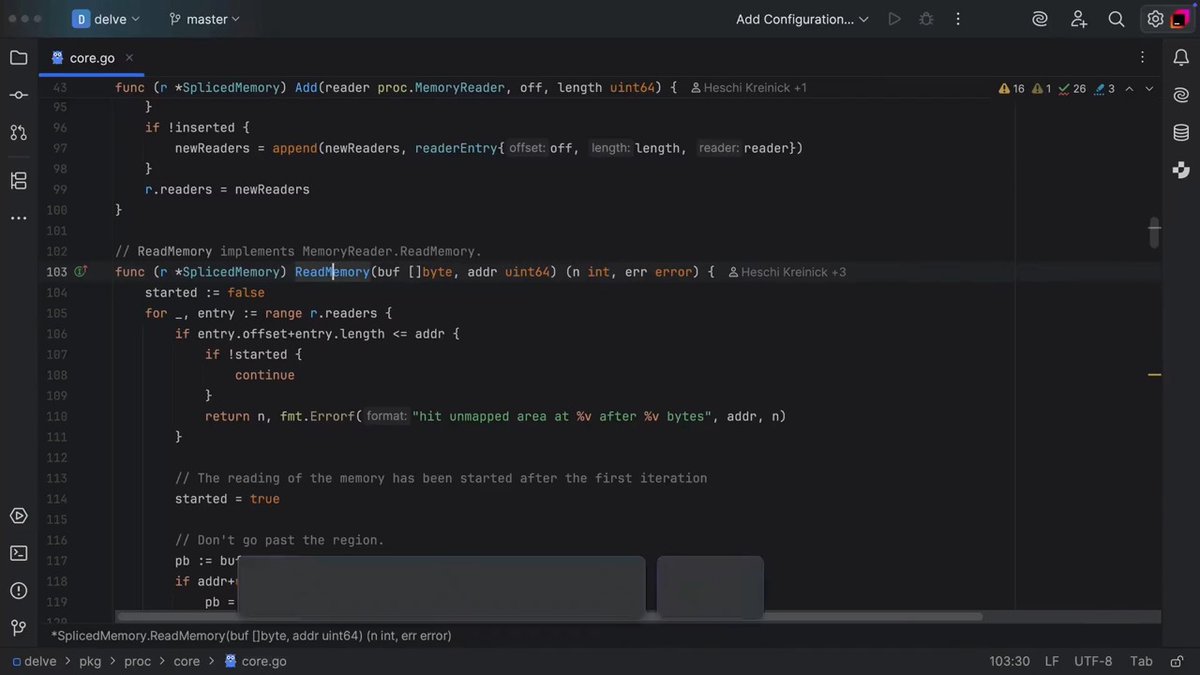
Whichever view you’re in, you can quickly navigate to the relevant line of code in your editor – just click on the function you’re interested in.
1
1
405
No more switching between the web interface and your IDE – GoLand has it all in one place!
Read more about our new profiling tool 👇 blog.jetbrains.com/go/2026/0…
2
2
416
At @GopherConSG, GoLand Engineering Lead Arseniy Terekhov gave a very well-received talk about teaching AI how to write modern Go.
If you couldn’t attend but want to unlock that ✨ skill ✨, head over to our blog to learn how: blog.jetbrains.com/go/2026/0…
2
4
48
1,703
Yesterday we celebrated Global Accessibility Awareness Day. Read more about the accessibility improvements in GoLand and other JetBrains IDEs 👇
May 21

Today is the 15th Global Accessibility Awareness Day.
In honor of it, we want to share recent improvements to compatibility with assistive technologies across different platforms, keyboard navigation, and non-visual feedback in JetBrains IDEs.
Some of these improvements are already available, and some are coming later this year. Check out the thread for more information.
#GAAD

3
857
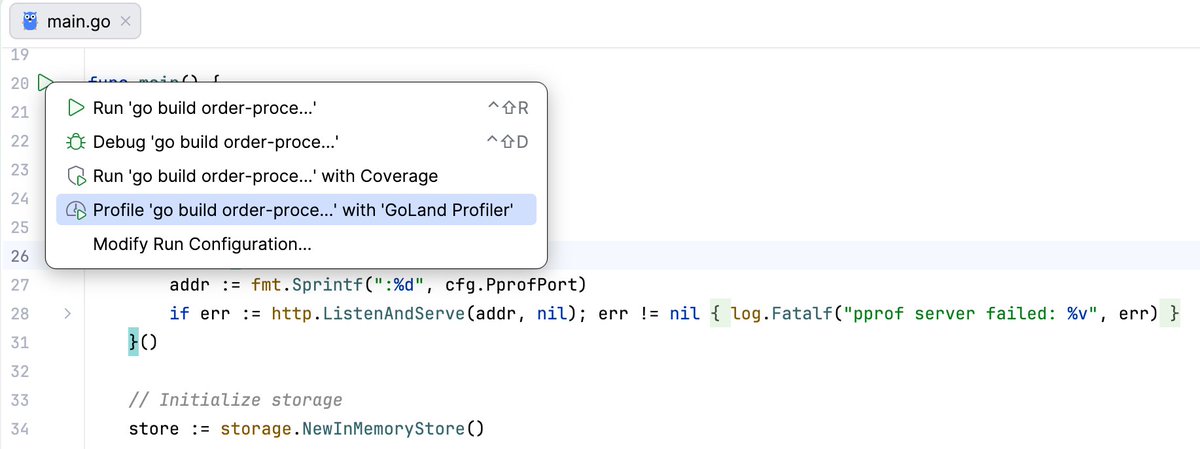
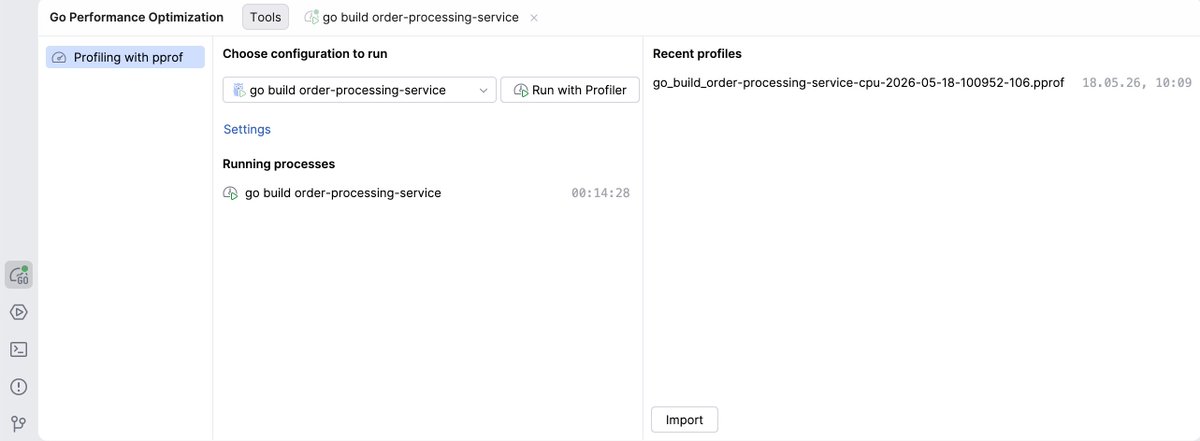
If you want to collect #Golang profiles easily, go to GoLand’s new “Go Performance Optimization” tool window. You can access it from several places 🧵
1
8
1,185
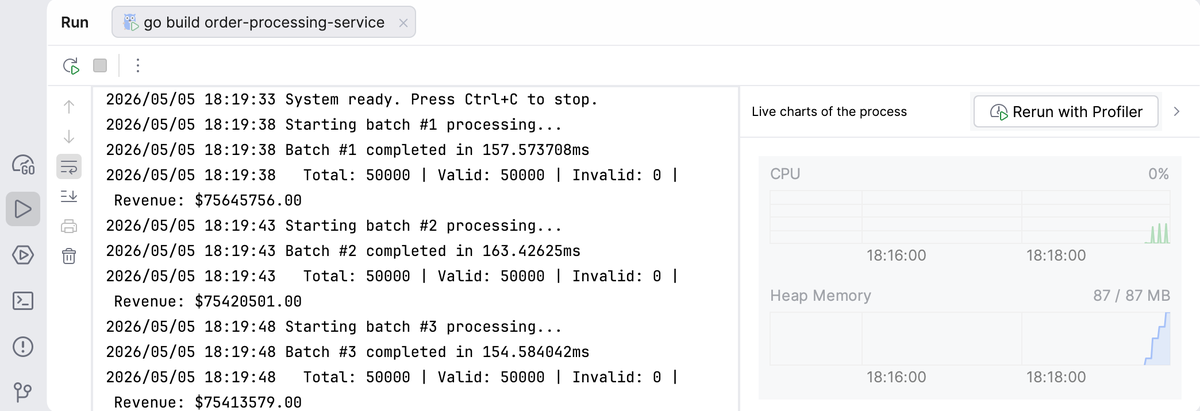
For services that are already running, you can click on the “Rerun with Profiler” option in the “Run” tool window.
1
2
283
Have you tried capturing profiles with GoLand yet? Tell us about your experience! 💬 We’re excited to make this new feature even better with your help!
2
261