
Joined February 2021
- Tweets 1,728
- Following 89
- Followers 353
- Likes 2,413
27 Photos and videos


Pinned Tweet

28 Sep 2021
@GraphMarket is the No. 1 community room for discussion around $GRT. We are traders, HODLrs & dedicated followers of @graphprotocol.
Join us!
👉🏽 t.me/GraphMarket
#grt #TheGraph #crypto #cryptonews #ta #Altseason2021
2
3
8
Graph Market retweeted

20 Nov 2025
$BTC Weekly
Not looking great tbh 😅
Why?
> Lost support @ 100k
> Lost the Weekly 50MA as bull run support
> Currently testing Golden Pocket support, an important Fib Retracement support zone on the HTF Weekly.
> Record ETF outflows.
BTC is macro bearish, for now.
Two major support levels to watch:
> 70Ks, previous ATH, already confirmed flipped to support last April.
> 50Ks, the Weekly 200MA is at 55k - this zone acted as a major pivot zone before the last leg-up to 100k.

2
8
22
887
Graph Market retweeted
19 Nov 2025
$BTC H4
First sign of strength on the 4 Hour, bullish divergence at 88k.
Local resistance at 94k - Bull will wanto to rip a hole through 94k and break this downtrend 🤞

8
20
650
Graph Market retweeted
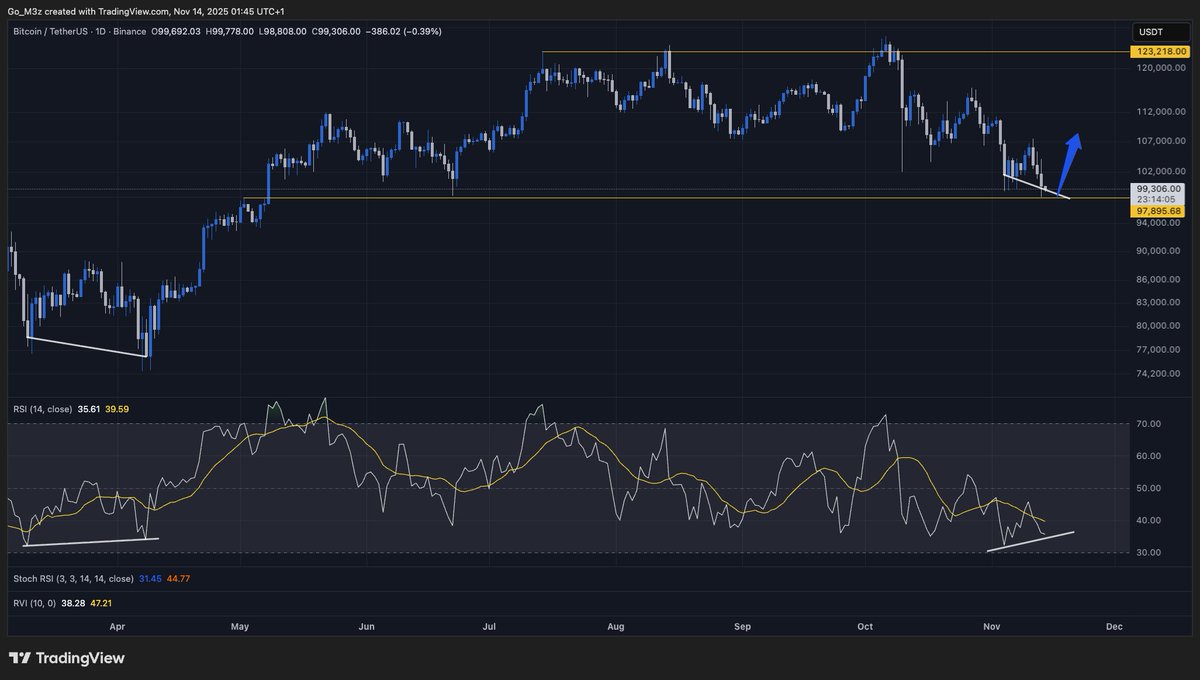
14 Nov 2025
$BTC Daily
Bitcoin printing a Bull Div at macro support 👀
The last time #BTC printed a Bull Div on the Daily was April, when the Weekly 50MA was backtested and confirmed as support.
The Weekly 50 has been backtested 4 times, each time a Bull Div has printed on Daily RSI.
Same technical setup, similar macro context, just a few more cracks, dents, and scratches. The liquidity tap remains on.
Plan for both scenarios - just because the Weekly 50MA has survived 3 other backtests, it doesn't guarantee it'll hold a 4th.
8
16
1,356
Graph Market retweeted
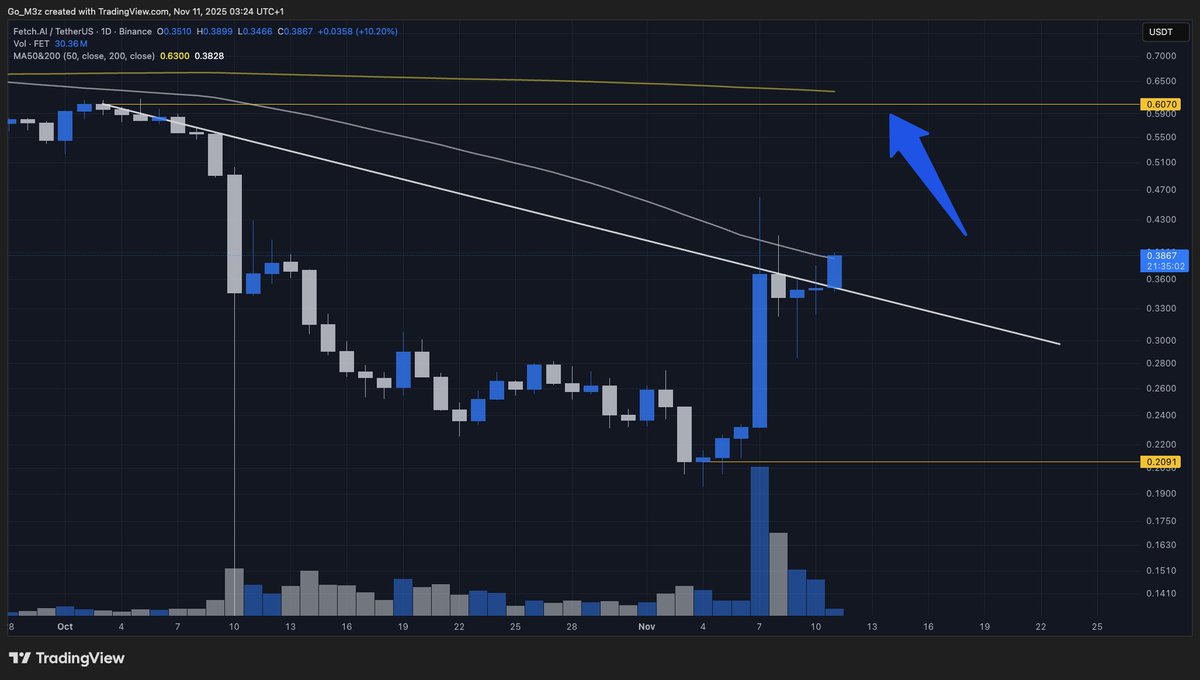
11 Nov 2025
$FET Daily
Breakout on the Daily 🫡
Retesting the Daily 50MA, bulls need to flip it to support and close the Daily in the 40s.
Confirm the flip and 60c is next up 🎯
4
14
87
4,576
Graph Market retweeted
8 Nov 2025
$BTC Weekly
Futures tapping the Weekly 50MA for the 3rd time this Bitcoin cycle, and holding to close the Week.
Let's see if spot can reciprocate on Sunday.

5
10
511
Graph Market retweeted
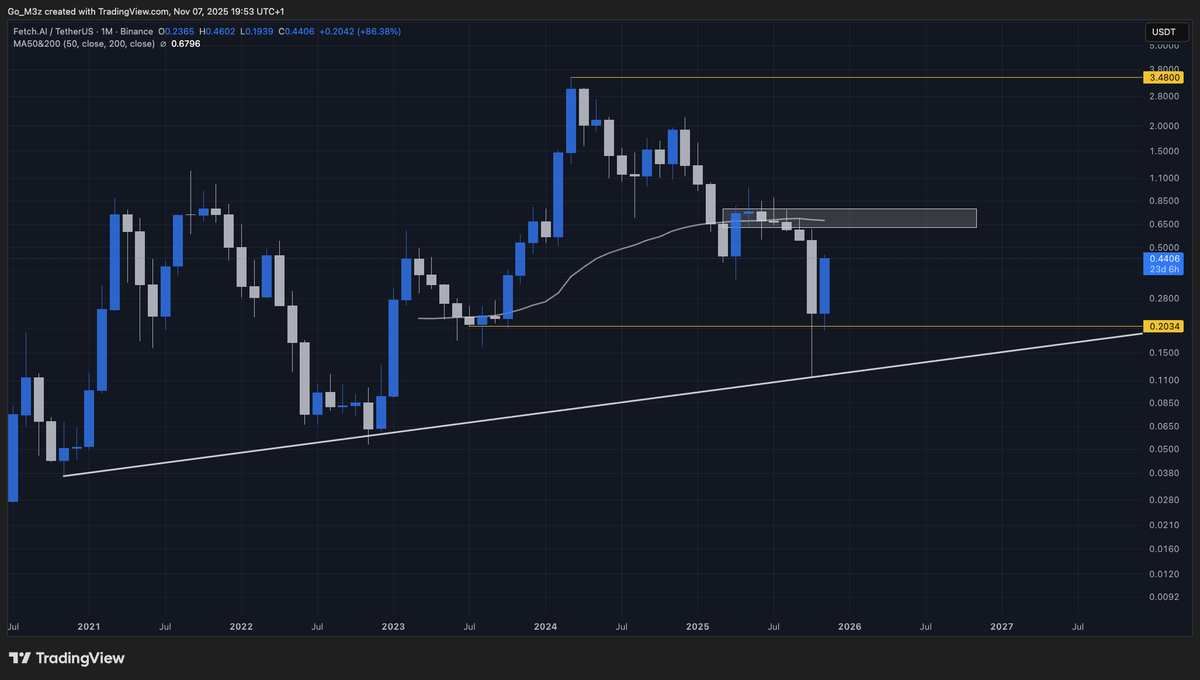
7 Nov 2025
$FET Monthly
Zoomed out for a better view:
> 70c is the next zone to watch, last summer's resistance.
> Monthly trend intact - 20c needed to hold, and it did.
4
17
82
3,774
Graph Market retweeted
7 Nov 2025
$FET Daily
Breakout confirmed with volume 🔥
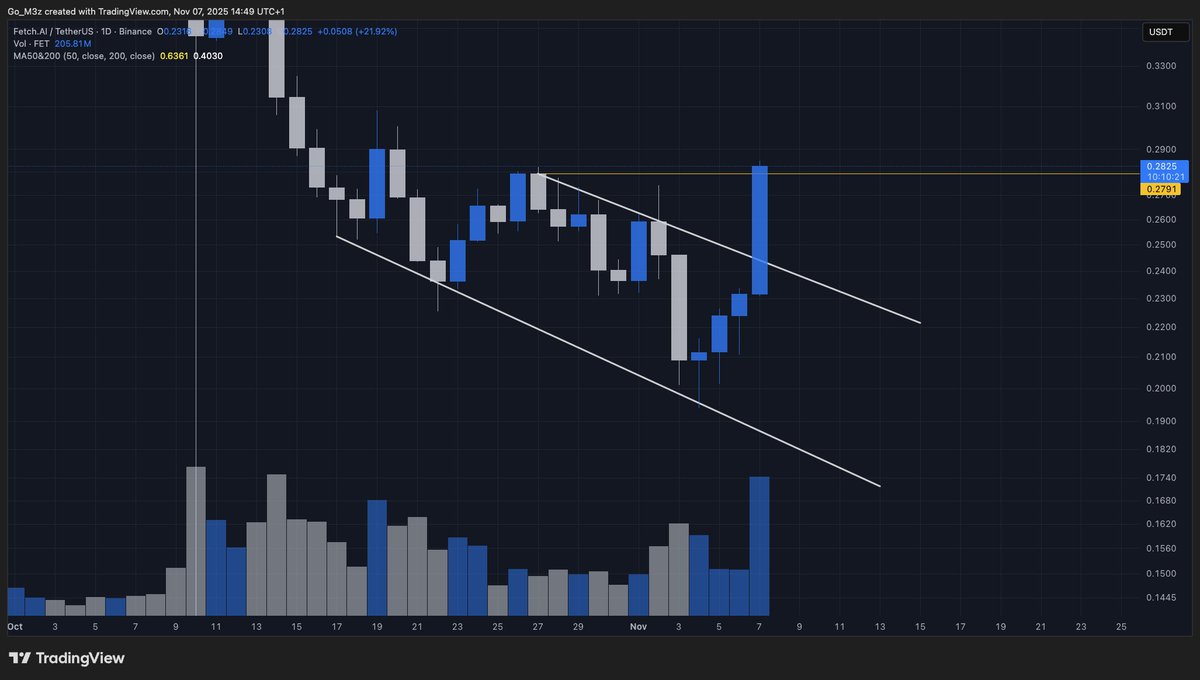
7 Nov 2025

$FET Daily
Technical breakout in progress:
> Bull Div on Daily RSI, now is where you want to see volume spike.
> Volume has been way up since the recent Black Swan event.
If you invert that chart, it'd be a sell all day.
Textbook setup, invalidated on a lower low.
6
25
1,957
Graph Market retweeted
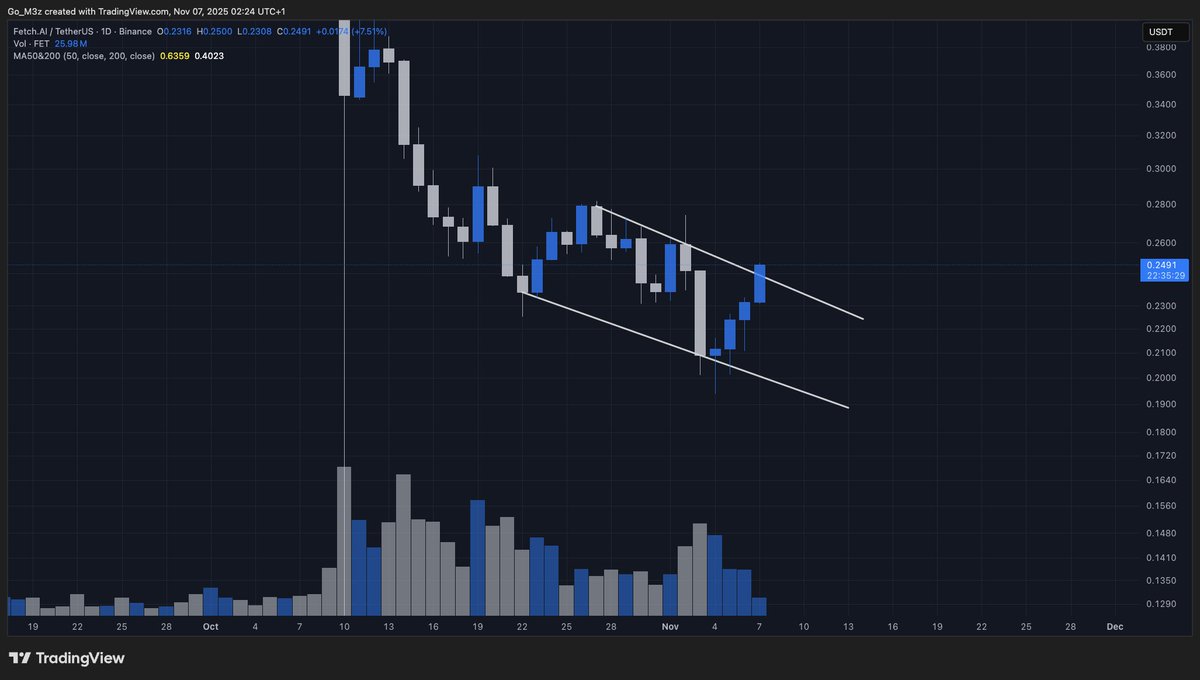
7 Nov 2025
$FET Daily
Technical breakout in progress:
> Bull Div on Daily RSI, now is where you want to see volume spike.
> Volume has been way up since the recent Black Swan event.
If you invert that chart, it'd be a sell all day.
Textbook setup, invalidated on a lower low.
1
15
55
5,301
Graph Market retweeted
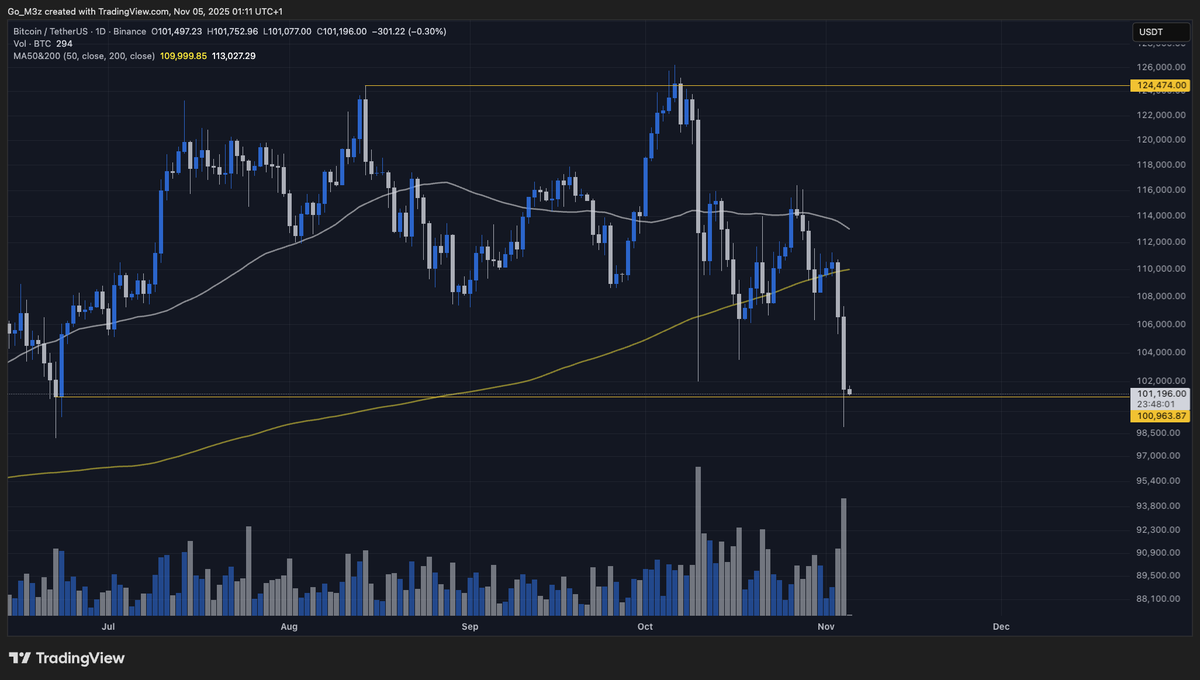
5 Nov 2025
$BTC Daily
This is what capitulation at $100k support looks like 👇
2
5
12
521
Graph Market retweeted
4 Nov 2025
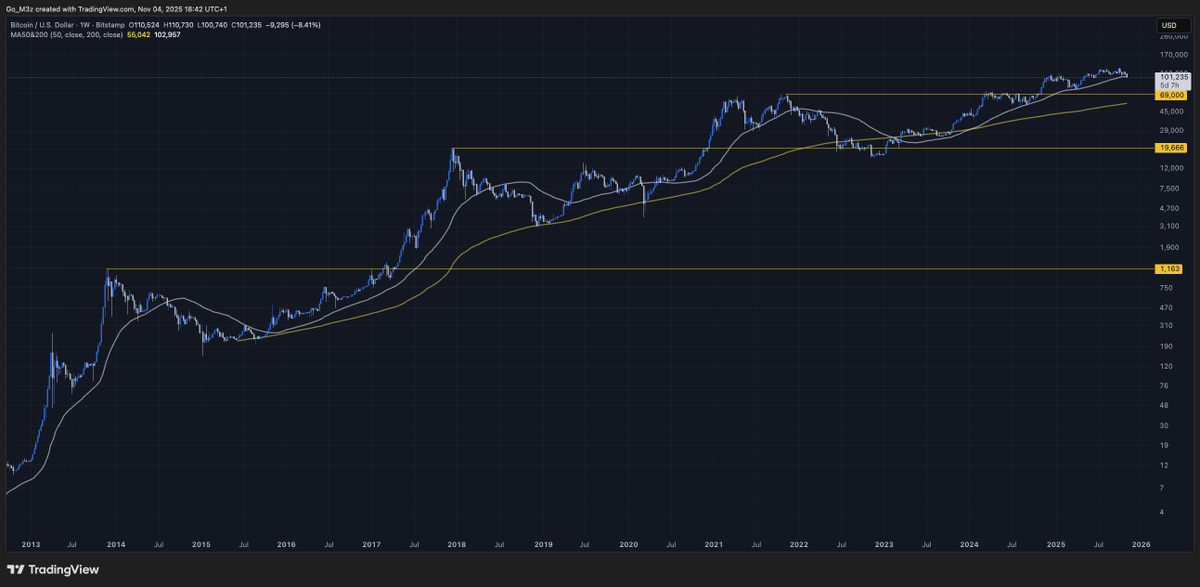
$BTC Weekly
Wicks are fine - a close under the Weekly 50MA is not.
If the 50 is lost, the real test will be the backtest. If that fails, it’s over for the cycle imo.
But context matters - every Bitcoin bear market has aligned with tightening liquidity and a stronger dollar.
Historically:
> Each major BTC top (2013, 2017, 2021) followed a liquidity squeeze - slowing M2 growth, rising real yields, and a stronger DXY.
> No bear market has ever started while global liquidity was expanding.
> Bitcoin peaks late in liquidity expansions and bottoms late in contractions.
Right now, liquidity is still expanding. Bitcoin has never entered a bear market under those conditions 🤷♂️
4 Nov 2025
$BTC Weekly
Decision time for #Bitcoin ⏰
Every cycle, when BTC loses the Weekly 50MA as support, it hasn't been a dip - it's marked the transition into a bear market, correcting down toward the Weekly 200MA (now sitting in the $50Ks).
Price is testing the 50MA again.
Either bulls defend it as they have since March 2023 - or they don’t.
This pivot matters for #ALTs too.
If #BTC holds here, that likely marks the bottom across the board.
5
14
1,021
Graph Market retweeted
4 Nov 2025
$BTC Weekly
Decision time for #Bitcoin ⏰
Every cycle, when BTC loses the Weekly 50MA as support, it hasn't been a dip - it's marked the transition into a bear market, correcting down toward the Weekly 200MA (now sitting in the $50Ks).
Price is testing the 50MA again.
Either bulls defend it as they have since March 2023 - or they don’t.
This pivot matters for #ALTs too.
If #BTC holds here, that likely marks the bottom across the board.
4
12
1,431
Graph Market retweeted
4 Nov 2025
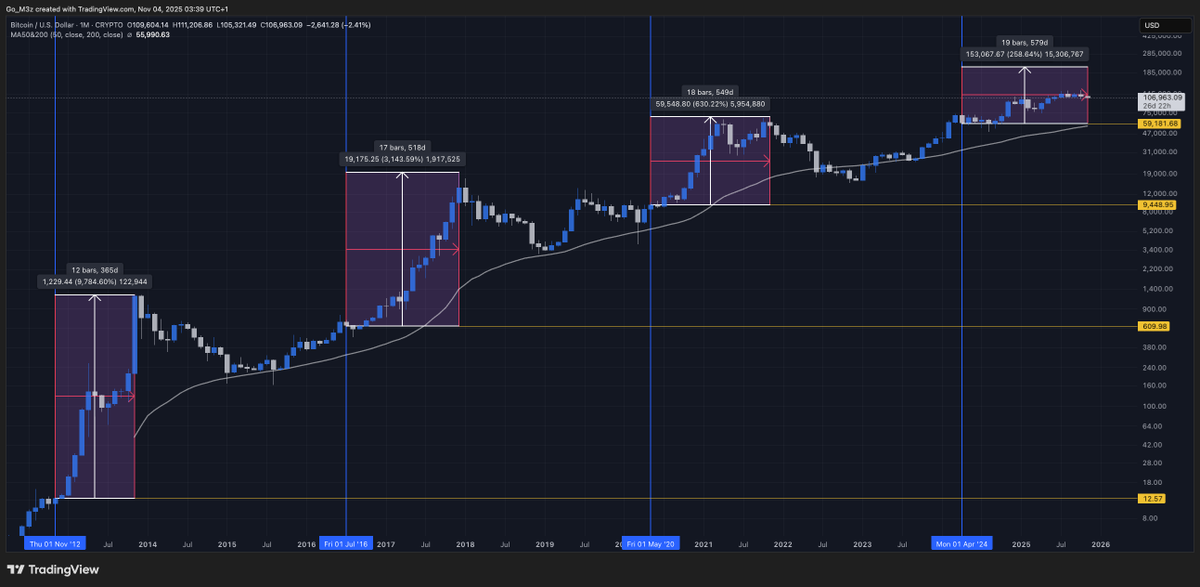
$BTC
The 4-year cycle is extending.
But it’s less about the Bitcoin halving - and more about the liquidity cycle.
Cycle length keeps expanding: 368d > 526d > 548d - while ROI compresses.
The halving effect is fading - liquidity is the new driver.
Each cycle = more time, less multiple, deeper integration with the global liquidity tide.
The liquidity cycle keeps stretching because debt keeps growing.
More liquidity must be injected just to sustain the system - to roll debt, to backstop growth, to avoid deflation.
The US (and most G7 economies) can’t tighten meaningfully without breaking something.
Until the tap gets turned off, that liquidity will keep looking for a home.
And that home is still assets. #Bitcoin
7
15
785
Graph Market retweeted
2 Nov 2025
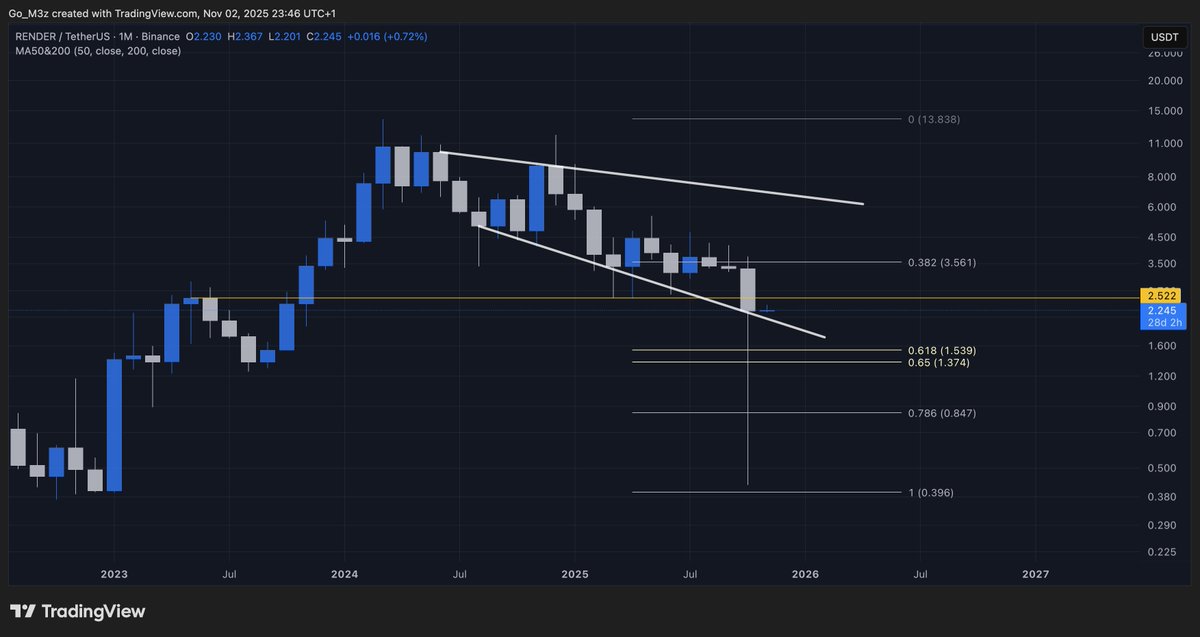
$RENDER Monthly
Keep an eye on #RENDER over the next few months 👀
When a quality project gets obliterated, long term holders capitulate, and revisits historic macro support, that’s when you start paying attention - Buy the blood.
A bullish broadening wedge is forming on the Weekly after nearly two years of bleed. Price currently is tapping wedge support.
The $2.5 zone was key Monthly support - now lost after last month’s black swan. It’ll take time for #alts to recalibrate, not just RENDER. Hard to even tell who’s solvent after that kind of flush.
But once this distribution phase is complete… the next markup could be violent. Unless $2.5 is reclaimed short-term, keep an eye on the Golden Pocket @ $1.5 🫡
4
17
95
12,804
Graph Market retweeted
31 Oct 2025
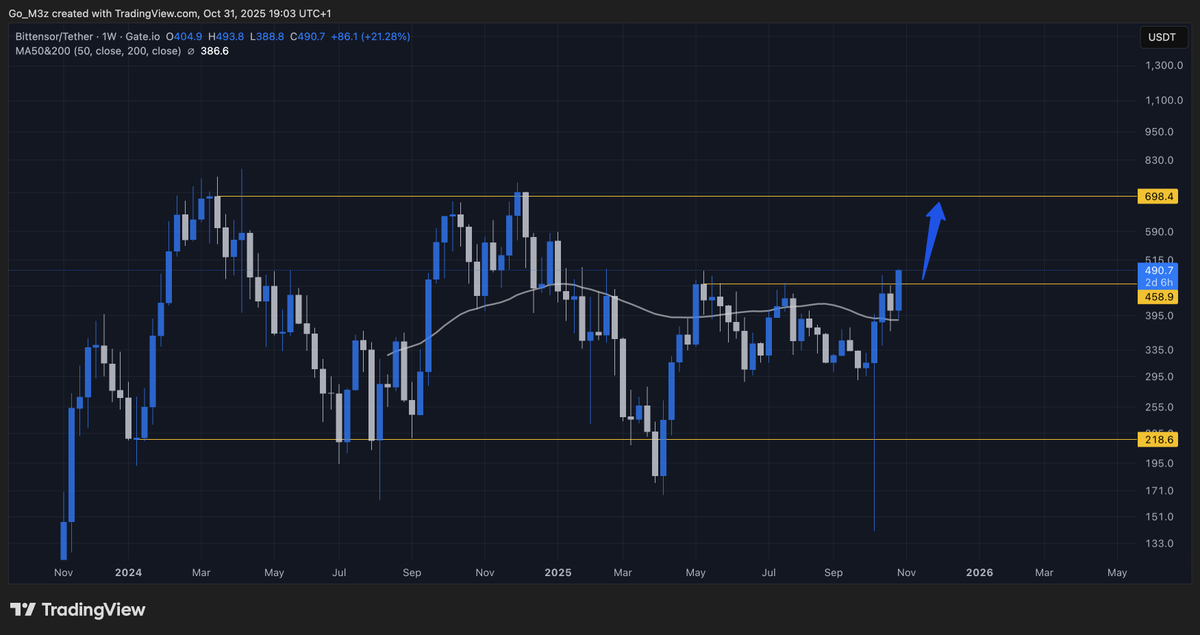
$TAO Weekly
A rare bullish Weekly chart 👀
After the recent 10/10 deleveraging event, VERY few #ALTs have fully recovered, #TAO is one of those, and in the process of printing its first higher high since Dec 2024.
If the #crypto market picks up in Nov, keep and eye on coins like this that are already showing early signs of strength 🫡
4
10
1,030
Graph Market retweeted
30 Oct 2025
$BTC Weekly
Bitcoin doing what it’s done after every other “market shock” this cycle - grinding and chopping around the Weekly 50MA.
After a major deleveraging event, the pattern repeats:
> several weeks of sideways grind
> market climbs a "wall of worry"
> liquidity rebuilds as new players step in
> the system recalibrates resets
It’s not weakness - it’s market dynamics.
The macro backdrop is a mess: Fed confusion, policy paralysis, and the U.S. government still in shutdown - all colliding with the end of the theoretical 4-year cycle.
When the macro gets this noisy, structure takes over.
And structure says #BTC is doing exactly what it should.
If there is to be another leg up (or two), this is how the market prepares.
For now though... "Patience" is the edge.

5
8
547
Graph Market retweeted
23 Oct 2025
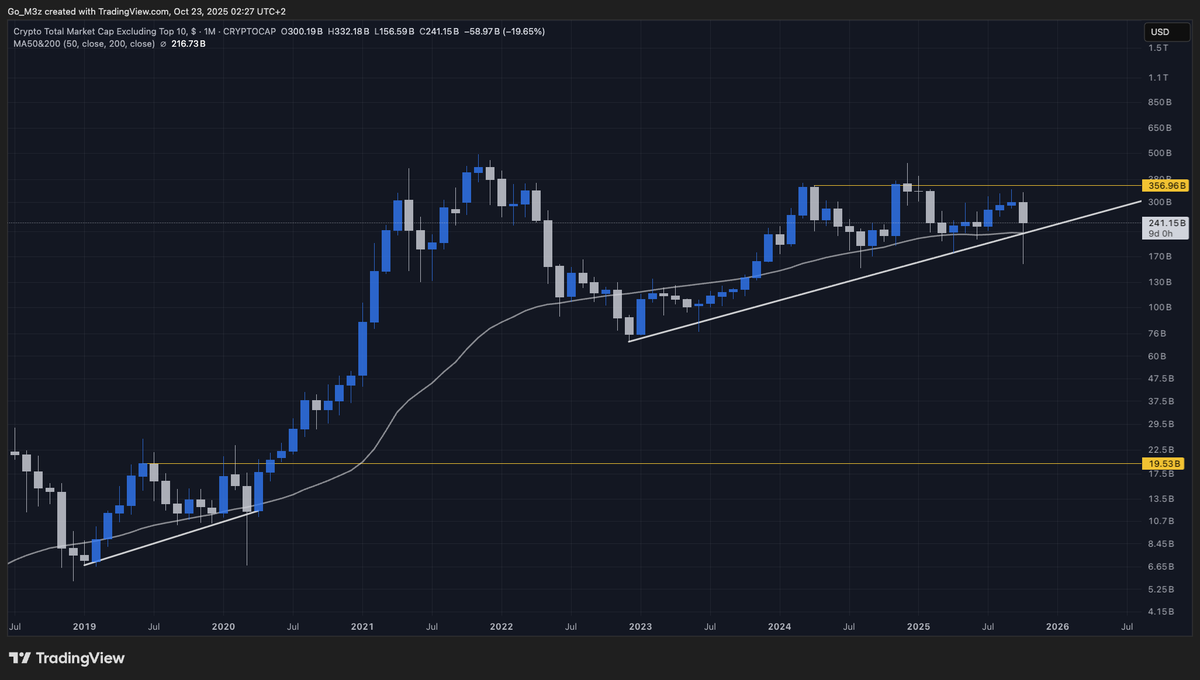
$OTHERS Monthly
The Monthly 50MA has acted as bear market support since 2018.
Every past ALT cycle ended with a "blow-off the top" moment, peak leverage, and a huge deviation between price and the Monthly 50MA.
Scenario A) Bottom is in, and alts bounce off of a multi-year support. Or B) Bottom is not in, alts lose a multi-year support, and a double top plays out. Not even a new all-time-high.
Hope for A. Plan for B.
5
10
954
Graph Market retweeted
17 Oct 2025
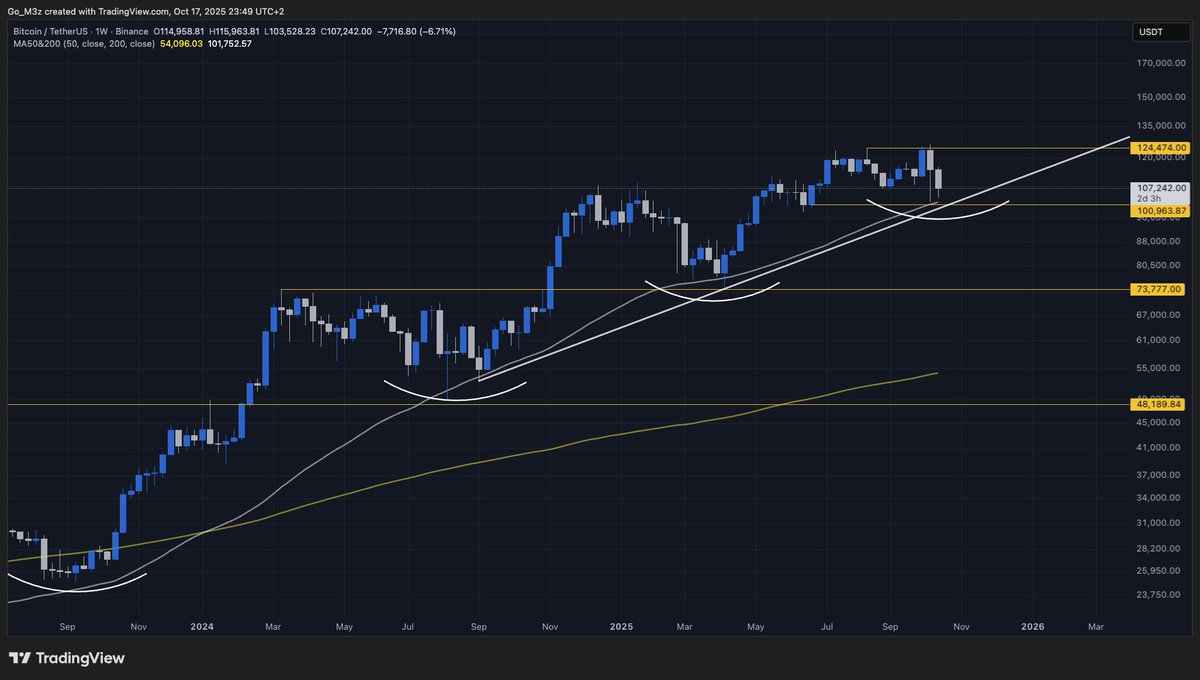
$BTC Weekly
This is the 4th major backtest on the Weekly 50MA - A solid bull market indicator that's held the entire Bull cycle.
We don't want to be losing the W1 50MA, that's a macro bearish flip, the start of a longer term downtrend.
But bulls haven't lost it yet - On each occasion the Weekly 50MA was needed for support, it was on the back of a bearish macro event: bank crisis, geo-political, trade wars etc. And after volatility had dried up, this current "crisis" was on the back of record low volatility from Bitcoin.
I personally don't think we are headed into a longer-term bear trend, the macro doesn't support that. Let's see if BTC can spring from this support zone with volume over the next couple of weeks.
The Gold trade is getting very over-crowded, when you start seeing retail lining up to buy Gold you know you're nearer a top than a bottom 😂
5
15
667
Graph Market retweeted
14 Oct 2025
The uncomfortable truth:
The October crash didn’t expose a flaw - it exposed the naked truth about the majority of #crypto assets.
Assets with genuine market depth and liquidity - $BTC, $ETH, $SOL - handled it.
The assets propped up by synthetic market-maker scaffolding imploded.
That’s not a tragedy. That’s price discovery.
Propping up worthless #altcoins with guardrails and circuit breakers isn’t stabilization -
it’s keeping the corpses on life support.
A free market has to be allowed to clean its own rot - otherwise it stops functioning as a market.
Circuit breakers make sense for systemically important assets. For everything else, extinction is and should be the safeguard.
And let’s be real - how many of those worthless tokens were being used as collateral for leveraged positions? That’s an implosion waiting to happen.
In traditional finance, collateral means hard assets - Treasuries, cash equivalents, instruments with intrinsic stability. In crypto, we’ve been using vapor as collateral.
If the industry wants to mature, step one is simple:
only assets that meet strict liquidity, volatility, and market-depth criteria should qualify as margin collateral.
Until then, every crash isn’t just volatility -
it’s a stress test on assets that shouldn't exist in the first place.

5
14
969
Graph Market retweeted
11 Oct 2025
A historic $20B crypto collapse wiped almost $1T from total market cap in under an hour.
So who’s to blame? Exchanges? Market makers?
Neither.
The system behaved exactly as designed - it just should not exist in that form to begin with. Would you blame a scorpion for stinging you? No, as that is what a scorpion does - that is its nature.
Same with a high leverage, low liquidity casino calling itself a market.
Exchanges created the conditions - absurd leverage, thin books, opaque liquidation logic - and market makers exploited them, because that is what they do. The real fault lies in the architecture that allows a single imbalance to cascade into a $20b margin implosion.
So no, it is not the fault of the exchange or the market makers individually.
It’s the fault of a market structure that incentivizes fragility and calls it “innovation”.
Regulators are just as complicit too imo, they’re too fkn slow. I’ll frame it like this:
Exchanges built the weapon, the market makers loaded it, but the regulators left the safety off.
Everyone played their part. The only ones without protection are us, the traders/investors.

2
5
17
1,129
Graph Market retweeted
6 Oct 2025
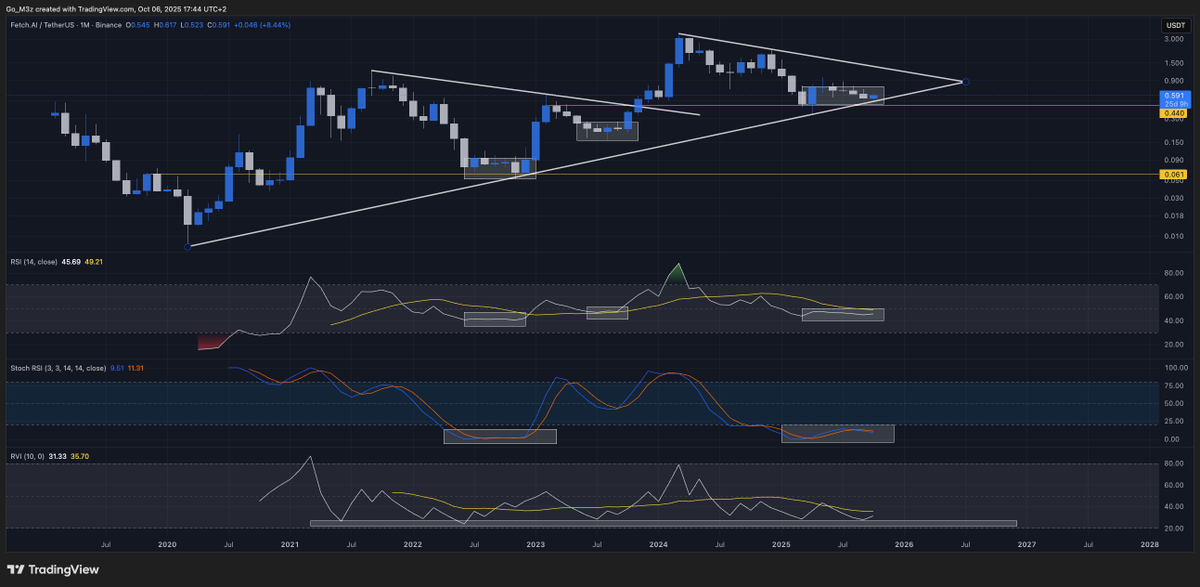
$FET Monthly
Macro structure remains bullish 🫡
Every major swing low since 2020 has formed the same way – extremely low volatility, flatlined RSI/Stoch/RVI, and repeated defenses of long-term trend support.
Right now, price is sitting exactly on that same multi-year trendline.
Monthly volatility is near cycle lows, RSI anchored around 45, Stoch RSI coiled at the floor.
Current structure mirrors EVERY previous accumulation phase before a violent expansion.
Macro uptrend still intact. Volatility compression complete... Now it’s just a waiting game ⏰
8
13
202
8,256