
World's most popular interactive #JavaScript chart library. Get support: highcharts.com/support #charts #dataviz
- Tweets 12,859
- Following 154
- Followers 5,643
- Likes 4,234
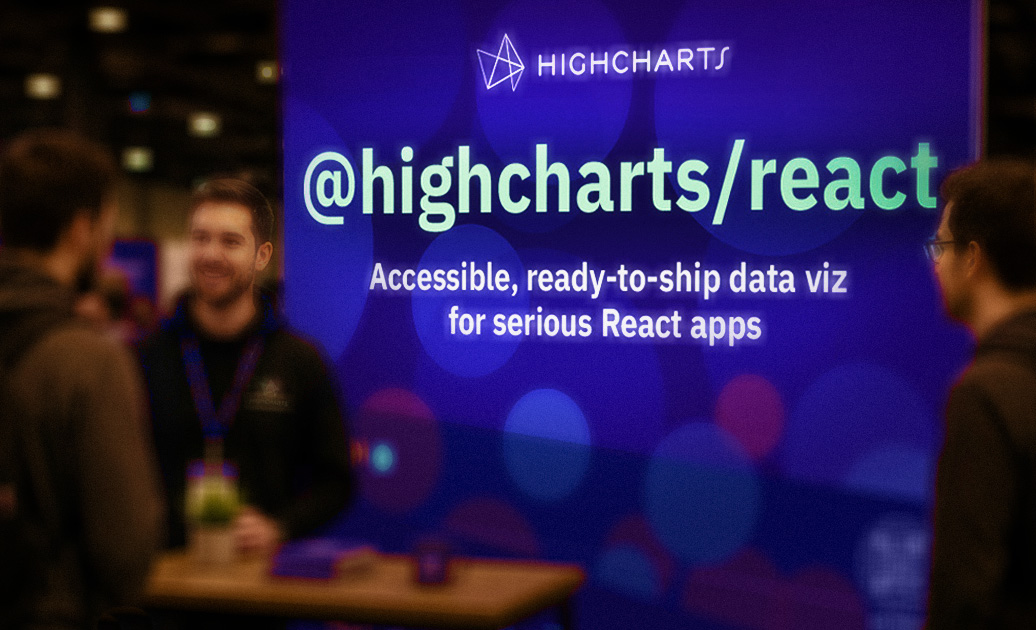


ALT A Highcharts booth display at a conference showing a purple banner with the text "@highcharts/react – Accessible, ready-to-ship data viz for serious React apps." Two people are visible in the foreground, slightly out of focus, appearing to be in conversation.
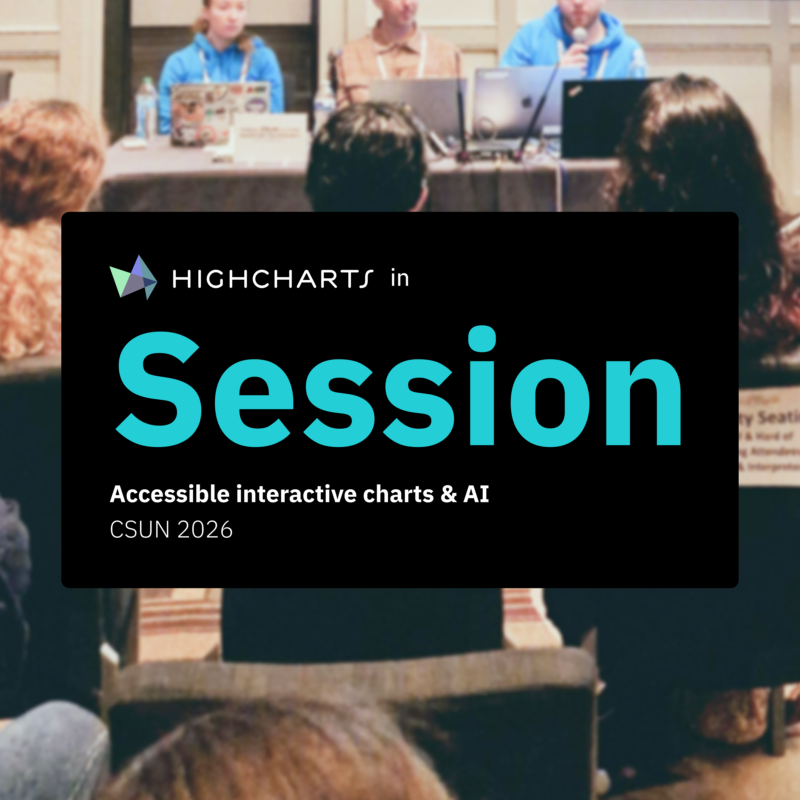
ALT Promotional graphic for Highcharts at CSUN 2026. A dark overlay reads "Highcharts in Session: Accessible interactive charts & AI, CSUN 2026." The background shows presenters at a conference table speaking to an audience.
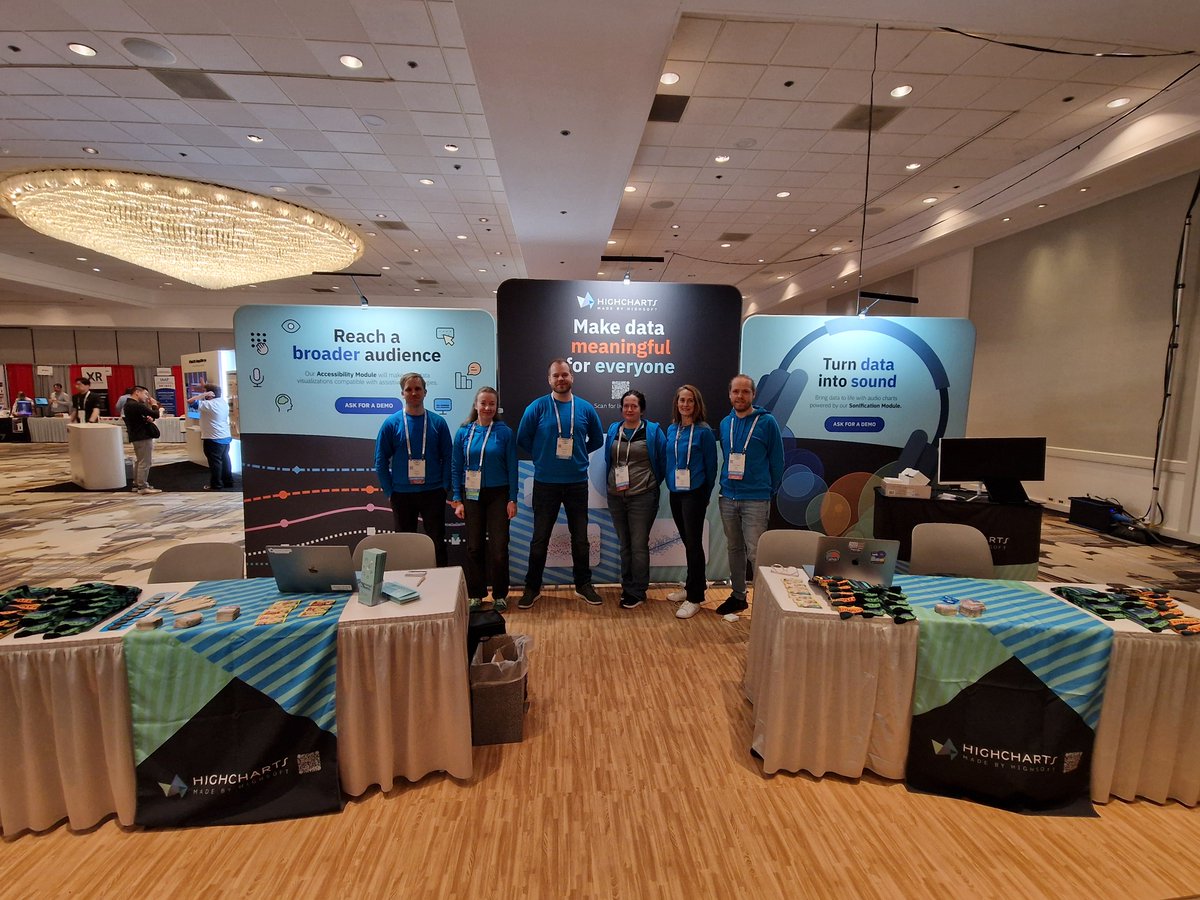
ALT The Highcharts team at their booth at the CSUN Assistive Technology Conference. Five team members in blue Highcharts hoodies stand in front of booth displays reading "Reach a broader audience," "Make data meaningful for everyone," and "Turn data into sound." Tables display colorful socks and Norwegian chocolates.