
Power BI reports that make a difference 🚀 training 1.1M followers in Power BI across social platforms 👉🏼datatraining.io datatraining.io
Joined September 2020
- Tweets 5,362
- Following 225
- Followers 22,600
- Likes 1,452
3,393 Photos and videos


4
17
1,047
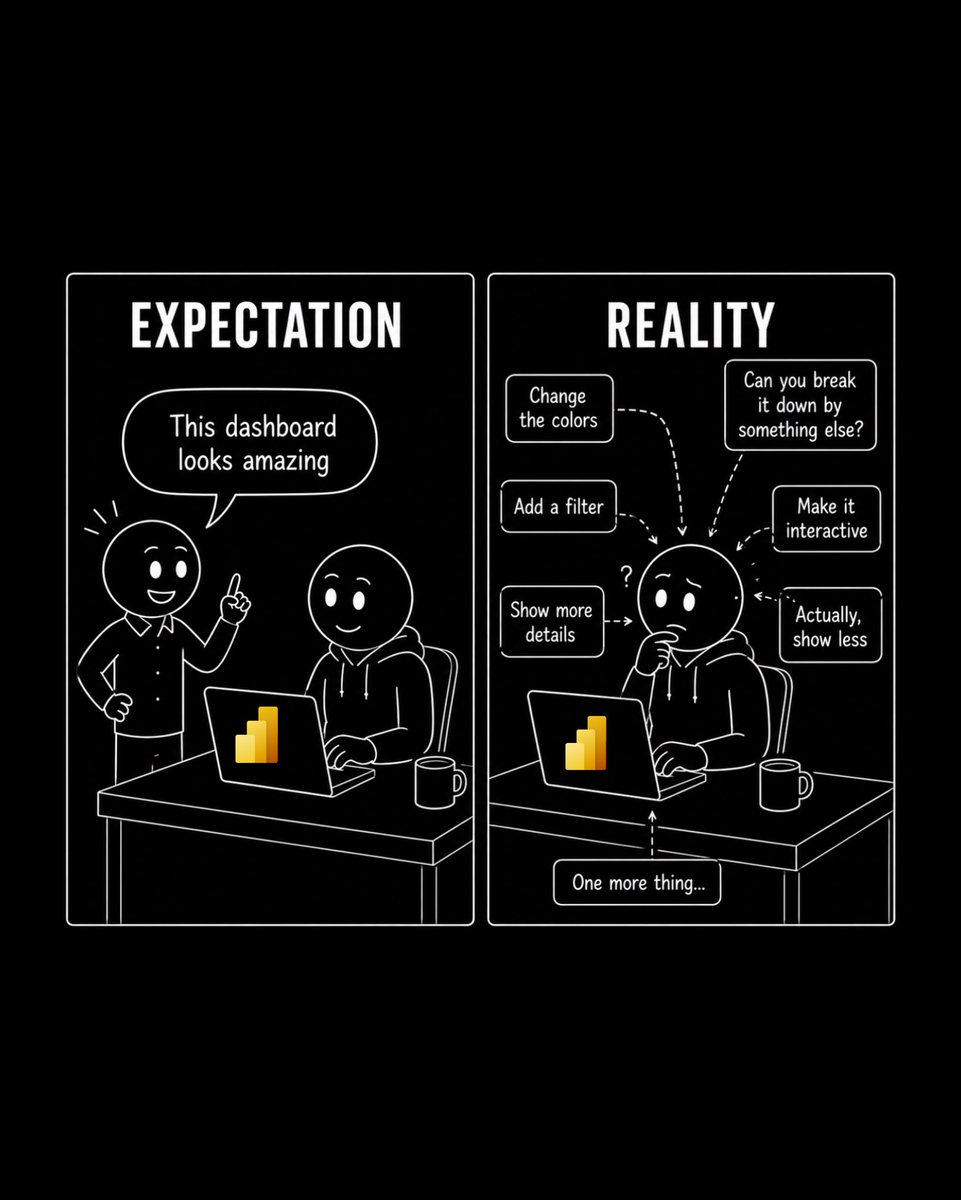
There is no such thing as a temporary fix in Power Bl. 😅
And the worst thing? You only figure it out when you find that hardcoded date someone added "just for the demo".
#powerbi #report #design #data #analytics
15
791
1
9
566
4
30
1,650
What’s the #1 reason data analysts leave their jobs?
33%
Bad management
33%
No growth or learning
17%
Underpaid vs. market rate
17%
Toxic culture / politics
6 votes • Final results
1
522
1,181
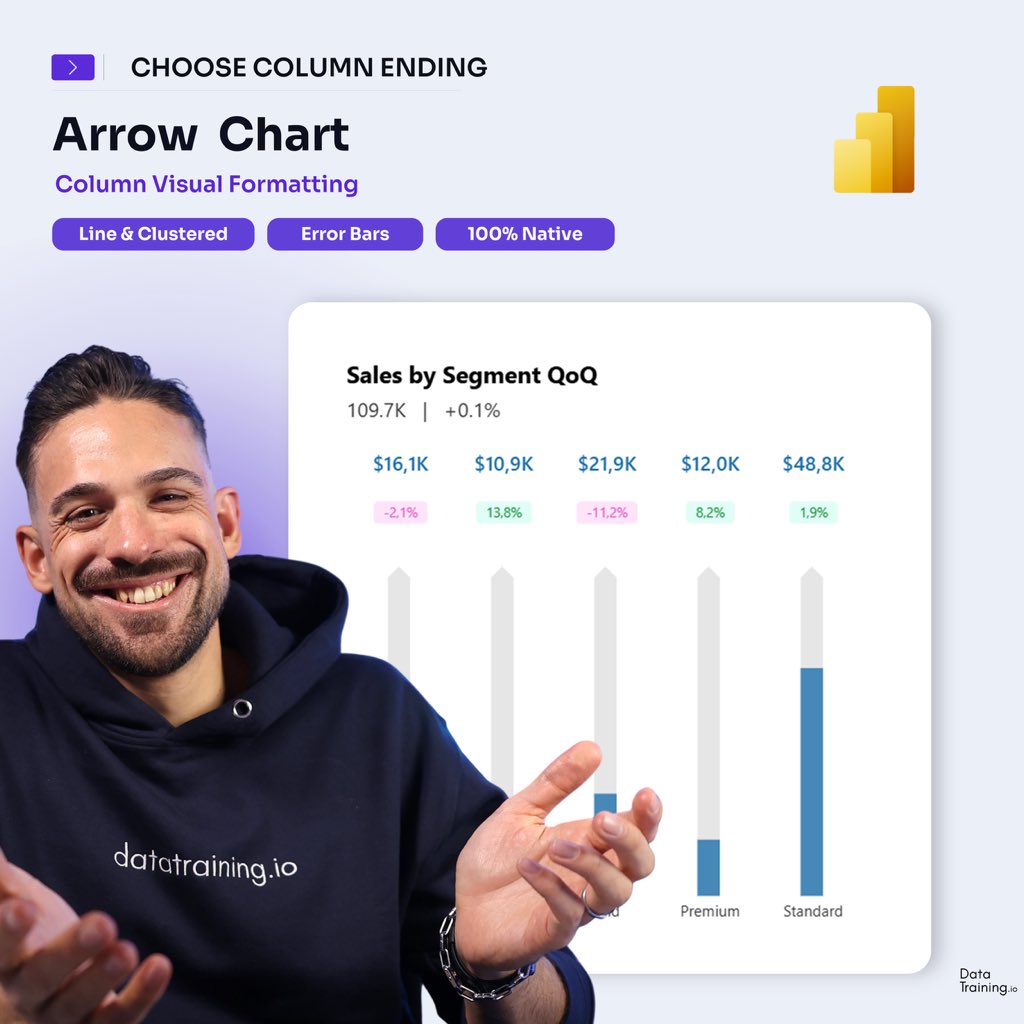
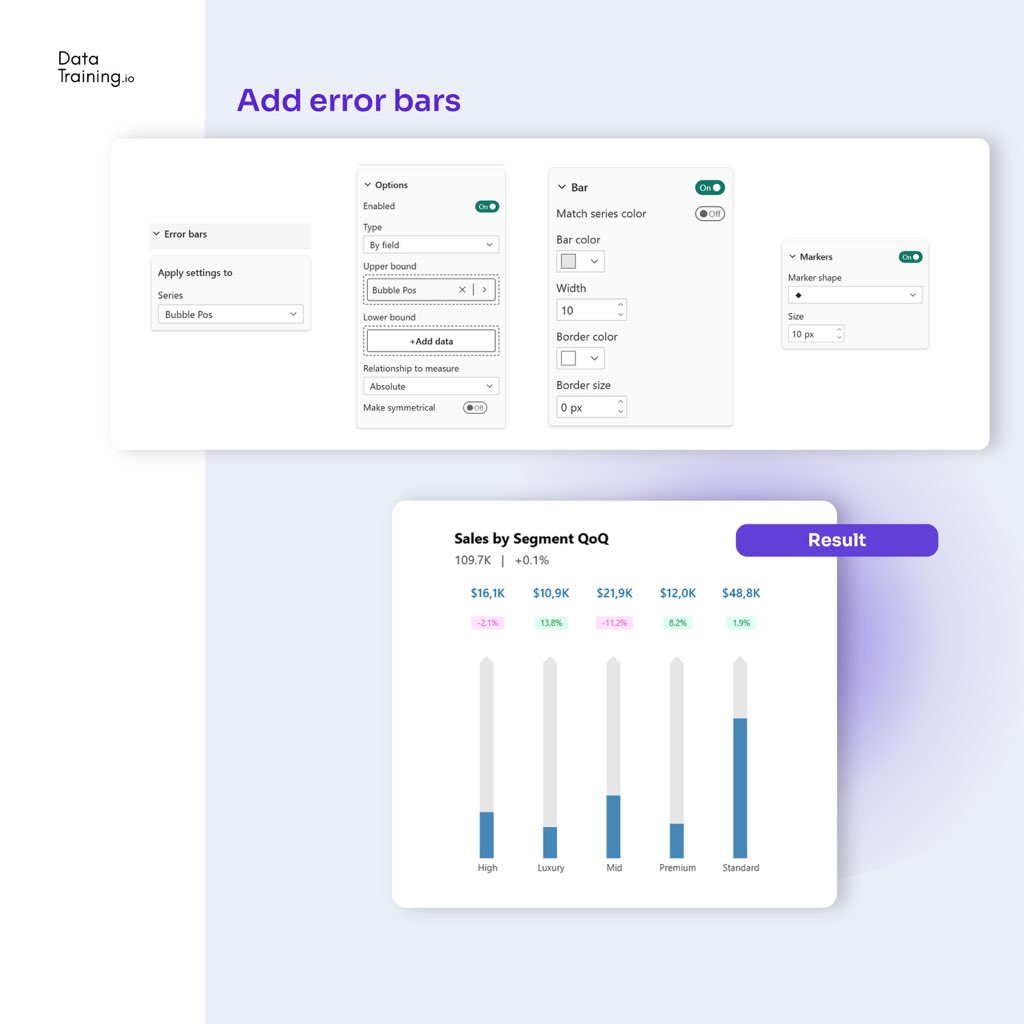
Top Indicators in Power BI
You need to know this trick in Power BI!
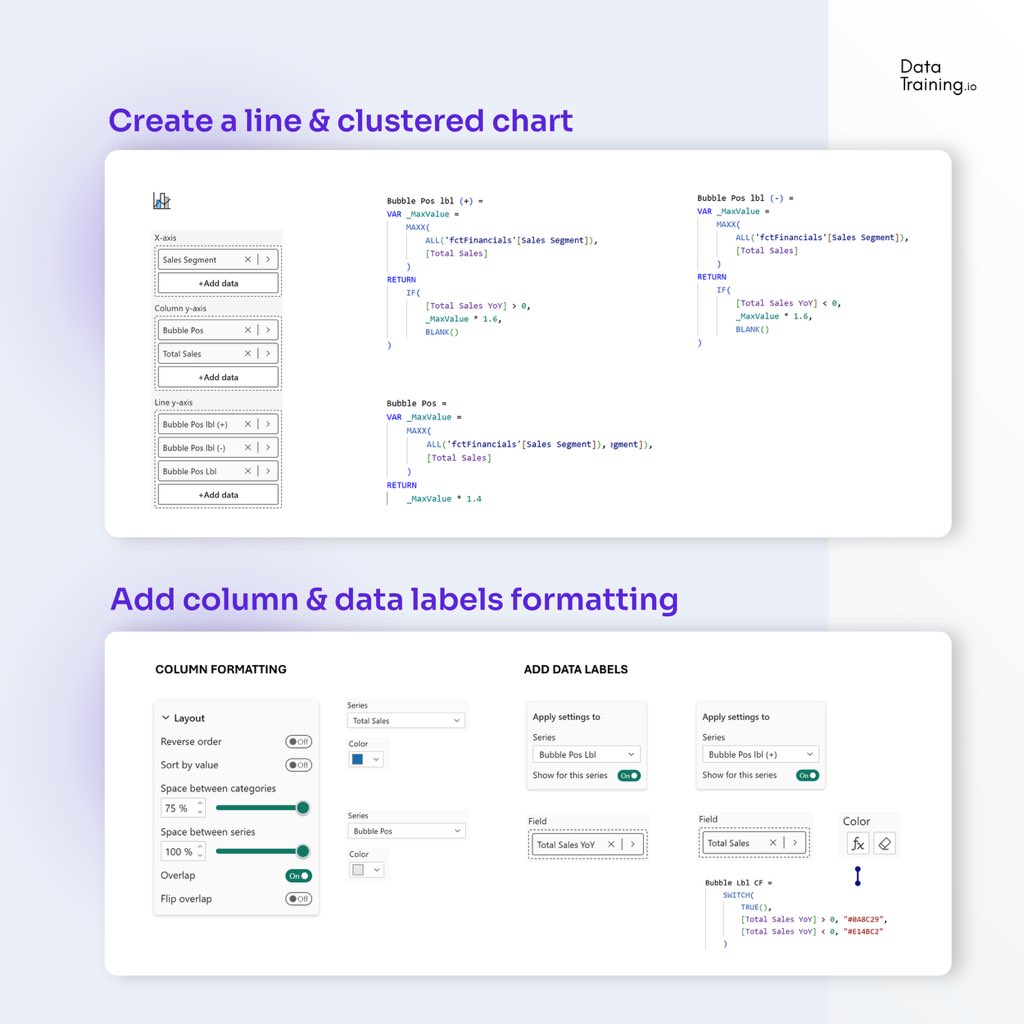
Step 1: Create a Line & Clustered Chart
Build two invisible bubble series that float above each column. Each measure returns a position value only when its condition is met, otherwise BLANK. Set Y-Axis Max to _MaxValue × 2.2 to create enough space for the markers.
Step 2: Add Markers ( trick)
Both series use a triangle marker shape. The trick is rotation - 0° for an upward green triangle on positive values, 180° to flip it into a downward pink triangle for negatives.
Step 3: Add Error Bars
Repurpose error bars for labels.
#powerbi #dax #trick #uxui #ux #design
1
27
1,011
1
36
2,012
4 quiet signs you’re getting good at Power BI:
1️⃣ You can explain a measure you wrote easily to anyone.
2️⃣ An unclear request worries you more than a complex one.
3️⃣ You know choosing the visual based on data type leads nowhere.
4️⃣ You try to understand as much about the stakeholders and the jobs the report will be used for as possible
#powerbi #skills #datamodel #performance #learning
1
562
0%
Constantly 😩
100%
Occasionally
0%
Rarely (access is open)
0%
Never, we have great gov.
2 votes • Final results
416
16
891
2
26
1,104
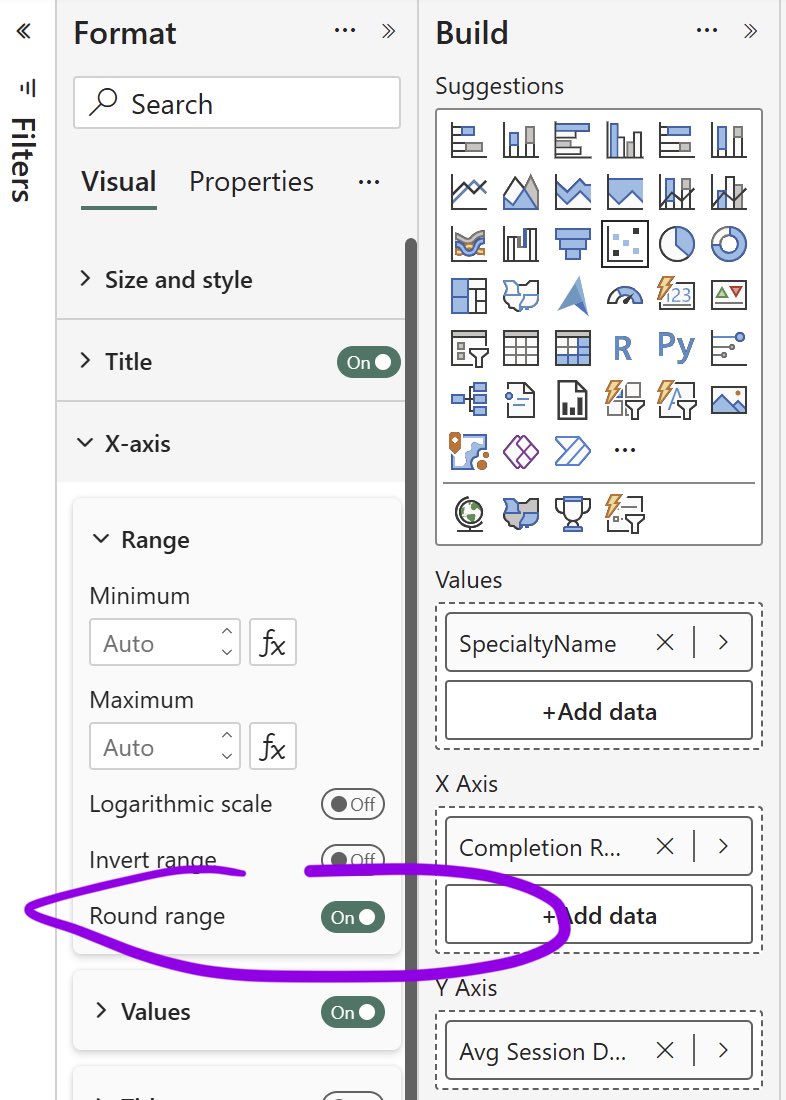
Round Range Toggle for x-axis in Power BI.
New in June 2026 Power BI Update
Tip: it is also available for Scatter & Line charts, not only Columns & Bars (as notes suggest )
What it does: lets you turn off the extra padding Power BI normally adds to the value axis.
#powerbi #june #update #tip #range #uxui #design #analytics
12
843
UDFs are now generally available in Power BI time to master this topic!
User-Defined Functions in Power BI
Build once. Reuse everywhere. 🚀
Join the developers who’ve already made the switch (Link below)
#udfs #powerbi #dax #udf #analytics
1
1
13
870
3
409
3
400
Do you test AI-generated insights before sharing them?
100%
Always cross-check man.
0%
Spot-check occasionally
0%
Trust but add a disclaim.
0%
I just ship it and hope 🤞
2 votes • Final results
323