We empower businesses and cities with on-demand insights to improve mobility from the first mile to the last.

Joined November 2008
439 Photos and videos
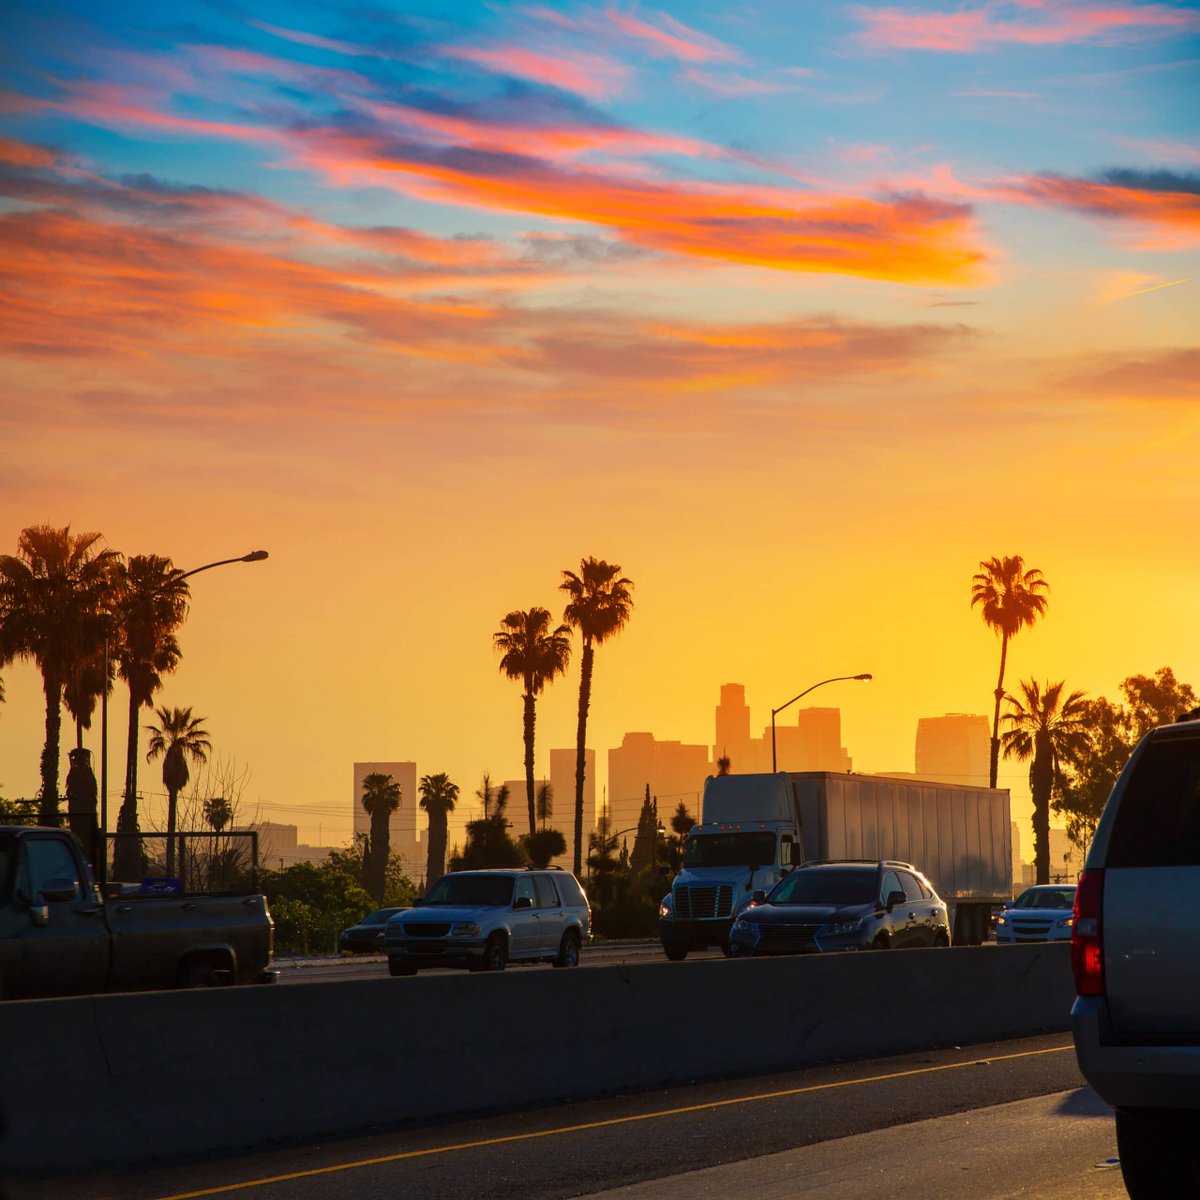
Seattle drivers should continue to expect heavy delays around Revive I-5 through the year, with officials preparing for World Cup traffic in June and July. Southbound I-5 work is expected to follow in 2027. #ReviveI5 #SeattleTraffic
80
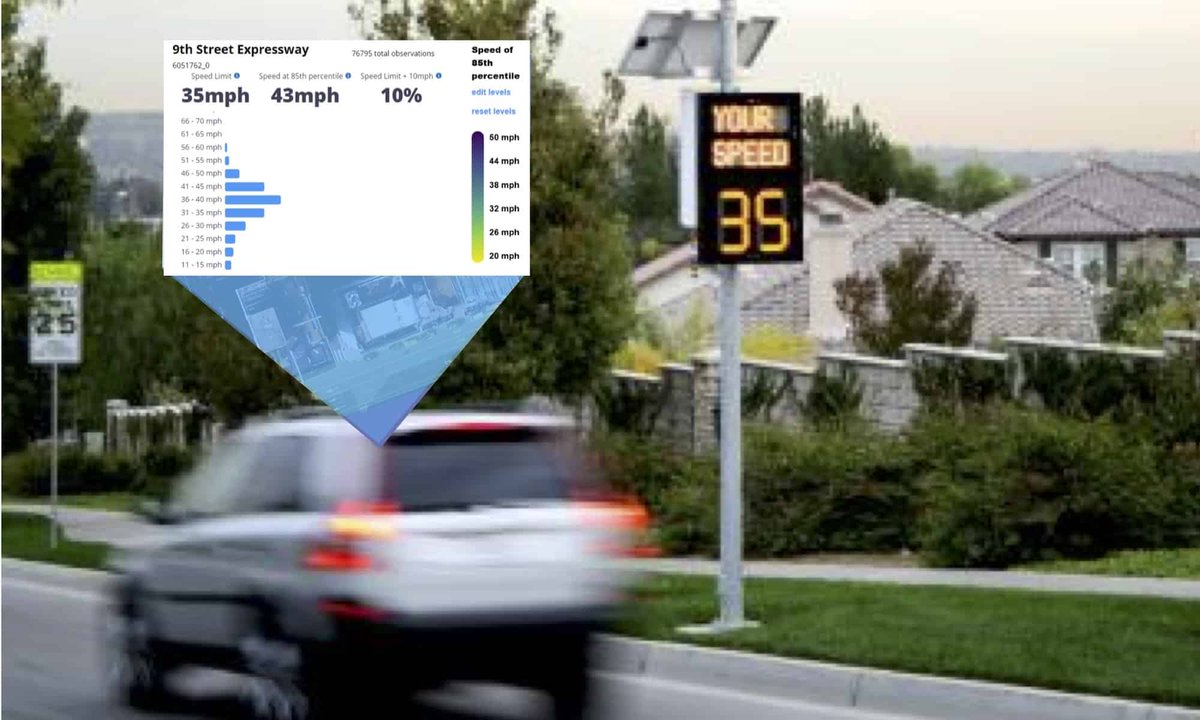
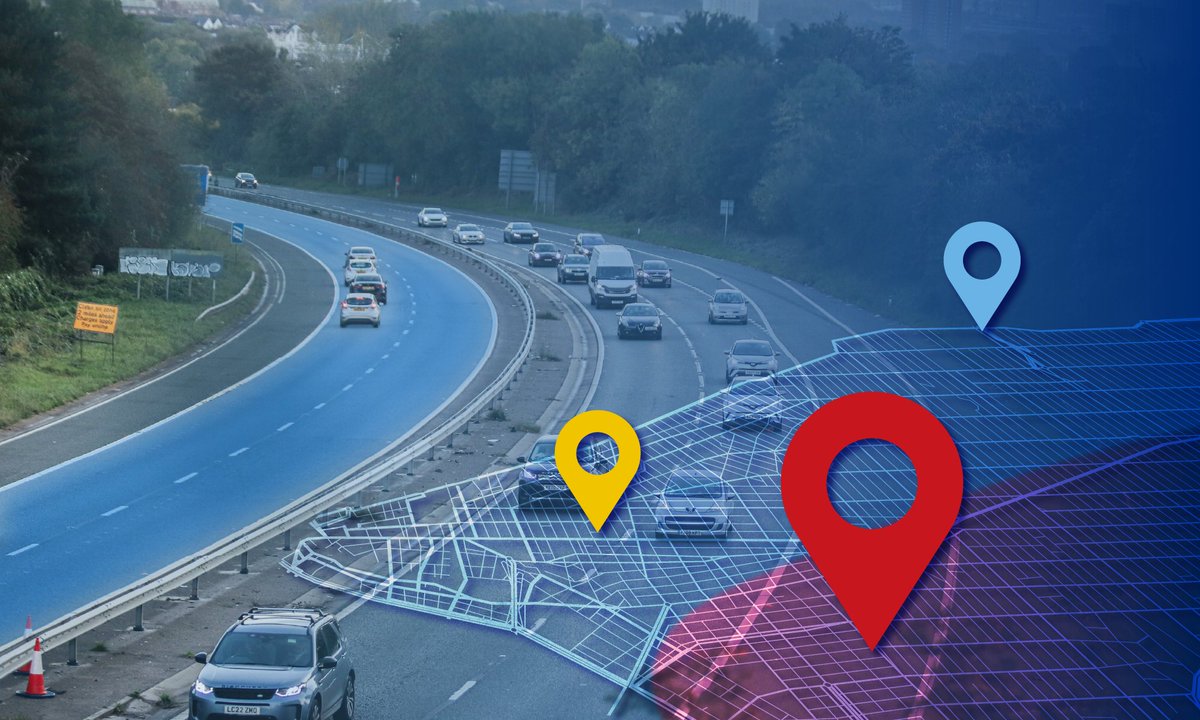
Traffic backups do not always start with major crashes. Police activity, debris, disabled vehicles, or lane blockages can quickly create miles-long congestion that affects thousands of drivers. #RoadSafety #TrafficData
44
Revive I-5 is keeping pressure on Seattle’s morning commute. Drivers saw speeds down 17% on I-5 during rush hour, while SR 99 experienced speeds 25% slower. #TrafficTrends #Seattle
75
I-5 continues to dominate Seattle’s congestion story. Most of the region’s top bottlenecks last month were on I-5, with southbound I-405 also making the list. #SeattleCommute #Transportation
74
Parking policy shouldn’t rely on guesswork. INRIX On-Street Occupancy Predictions estimate curbside parking demand by time of day and day of week, helping cities identify where demand is highest—without relying only on meters, cameras, or manual counts.
51
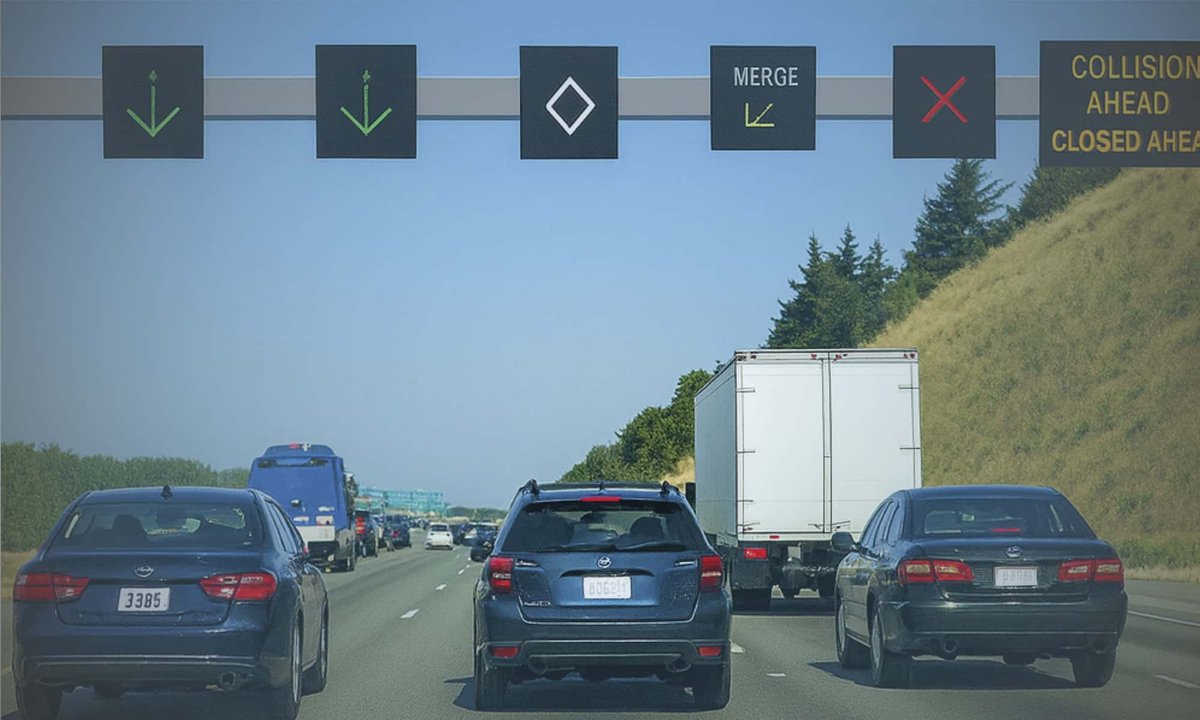
What makes a bottleneck so disruptive? When speeds drop sharply on a corridor, that slowdown can send shockwaves miles behind the source, impacting commuters, freight movers, and surrounding routes. #TrafficData #Mobility
36
May 28
Real-time occupancy can help cities and mobility providers understand where curb space is actually available. INRIX’s expanded integration with Automotus adds verified, block-level parking and loading zone occupancy data to support smarter curb management.
42
May 27
Finding parking impacts more than drivers—it affects congestion, safety, deliveries, and curb access. INRIX parking data helps users find, compare, pay, and navigate to parking while giving cities and businesses insights to improve parking operations.
44
May 26
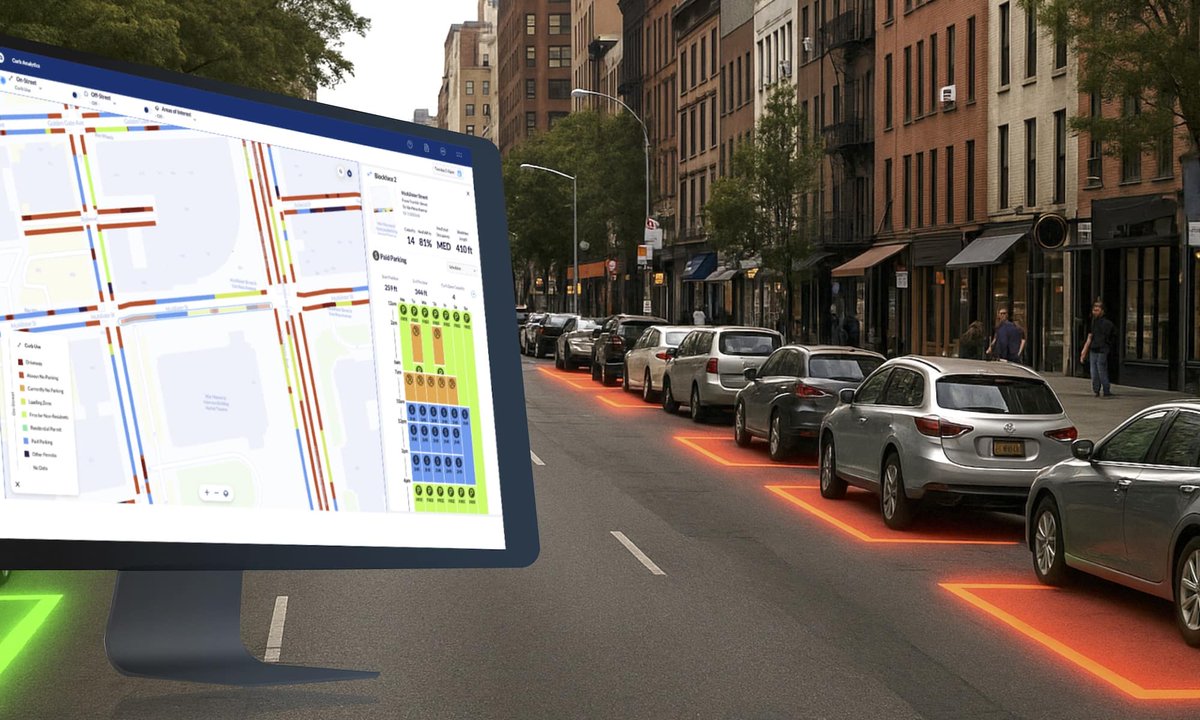
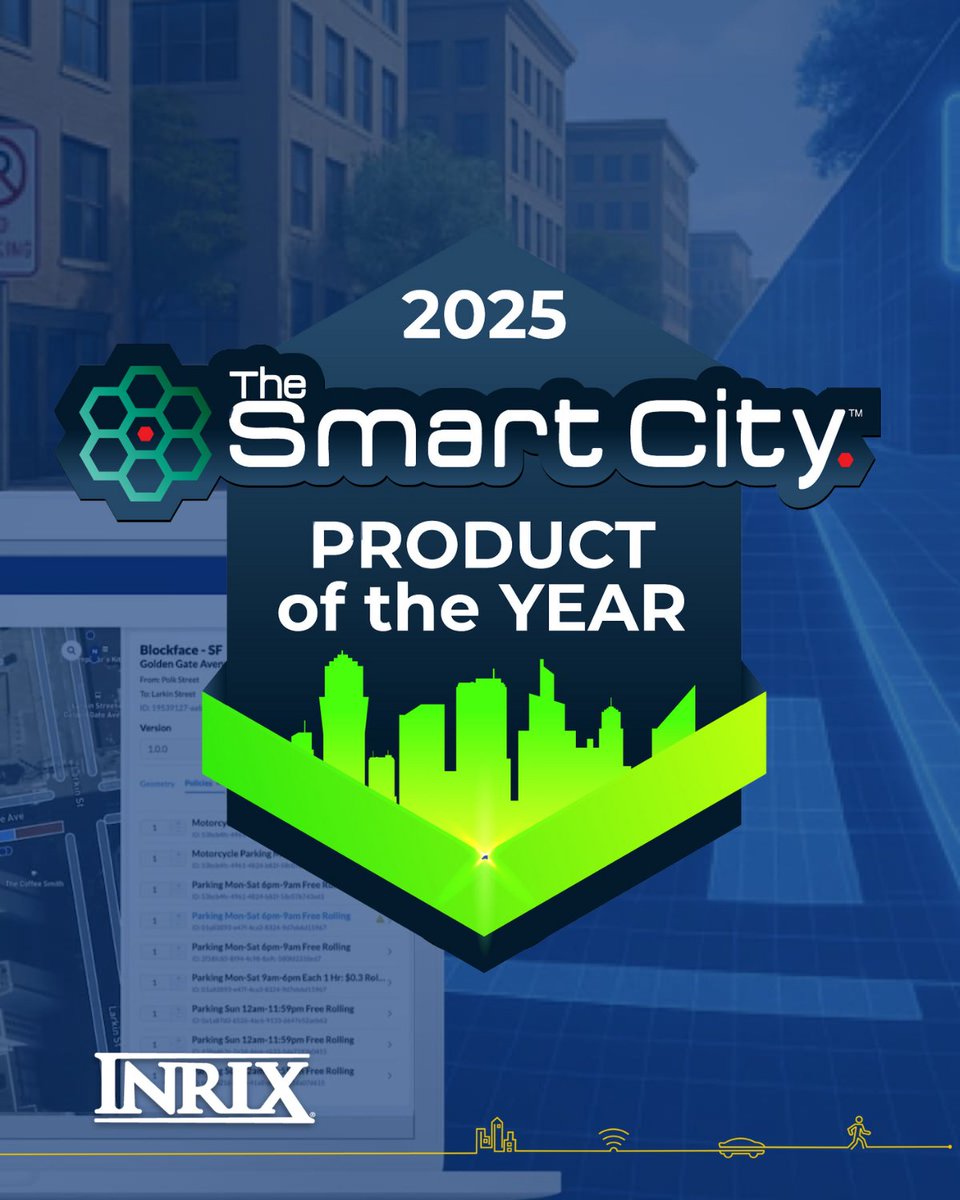
From loading zones to EV charging, paid parking, driveways, and curb restrictions, cities need a clearer picture of how curb space is actually being used. Curb Analytics helps digitize and classify curb use so agencies can plan, price, and manage the right-of-way more effectively.
1
61
May 21
The curb is one of the most valuable—and most contested—spaces in a city. INRIX Curb Analytics helps agencies understand on-street parking occupancy, availability, cost, and demand so they can make more informed curb management decisions.
48
May 20
Better shared mobility decisions start with better visibility. Ride Report gives cities tools to launch, manage, and evaluate shared scooter, bike, and carshare programs while supporting compliance, invoicing, and historical trend analysis.
47
May 19
Micromobility is no longer a side conversation—it’s part of how cities manage the public right-of-way. Ride Report helps agencies monitor vehicles in real time, analyze travel patterns, automate reporting, and turn fragmented mobility data into actionable intelligence.
38
May 18
INRIX Signal Analytics API delivers signal performance metrics in 15-minute granularity, giving agencies flexibility to build dashboards, automate reporting, integrate with existing tools, and support special studies.
36
May 14
Signal retiming doesn’t just affect one corridor. With network-wide visibility, agencies can measure impacts on adjacent corridors too—helping tell a more complete before-and-after story.
51
May 13
Shared mobility programs generate a lot of data—but cities need more than raw numbers. Ride Report helps agencies manage scooters, bikes, carshare, delivery robots, and emerging modes with analytics that support policy, compliance, reporting, and program evaluation.
54
May 13
Probe-based signal analytics gives agencies scalable insight across intersections, approaches, and movements—helping teams move from reactive signal management to more proactive, data-backed operations.
41
May 12
For regional planning agencies, arterial performance data can unlock a clearer picture of where delay is happening, when it’s happening, and how conditions vary across neighborhoods, corridors, and subareas.
42
May 11
Construction, special events, incidents, and unexpected disruptions can all change how a corridor performs. Signal Analytics gives agencies a way to measure those impacts before, during, and after.
44
From daily reports to deeper corridor analysis, Signal Analytics helps traffic teams quickly identify intersections that are performing worse than usual and understand why.
35
“Complaints” from the public? City of Mesa calls them eyewitness accounts. Signal Analytics helps agencies validate what’s happening on the roadway with data they can use to investigate, prioritize, and respond.
46