
Each Monday through Friday, get a tip for using @JMP_software. Feed is managed by G. Massari and #JMP User Enablement team.
- Tweets 2,477
- Following 50
- Followers 725
- Likes 25


ALT Based on the F2 similarity factor, four of the tablets (A02, A04, A07, and A13) have similar dissolution profiles to the reference tablet, w/ 90% confidence limit for F2 greater than 50. Tabs in the Comparisons section let you view individual comparisons between each test group and the reference group.
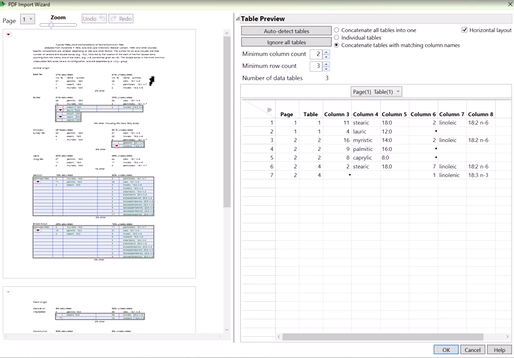
ALT Importing data from PDF to #JMP may be tricky, but you can easily learn how.
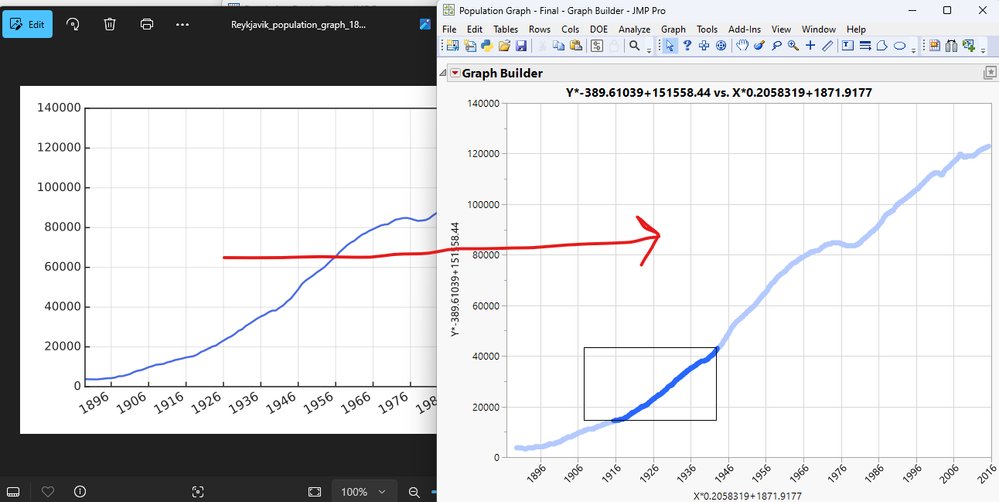
ALT Hmm.. I need the data from the points in the picture on the left and want to get it into JMP for analysis.
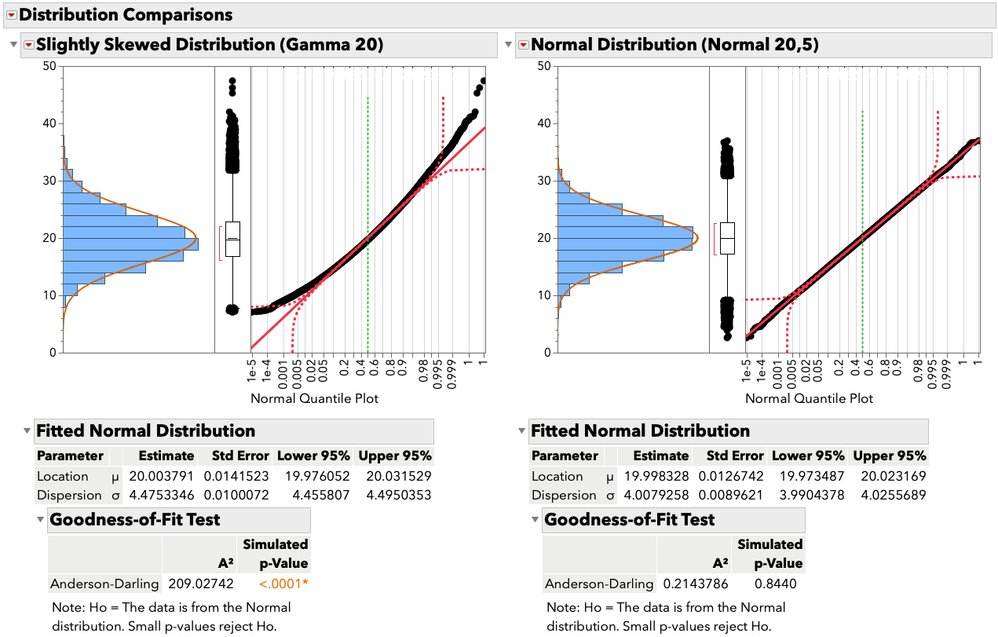
ALT With a large sample size the tails of the gamma distributed population (left panel) clearly fall outside the 95% confidence intervals (red dashed lines) of the normal probability regression line in the normal quantile plot.
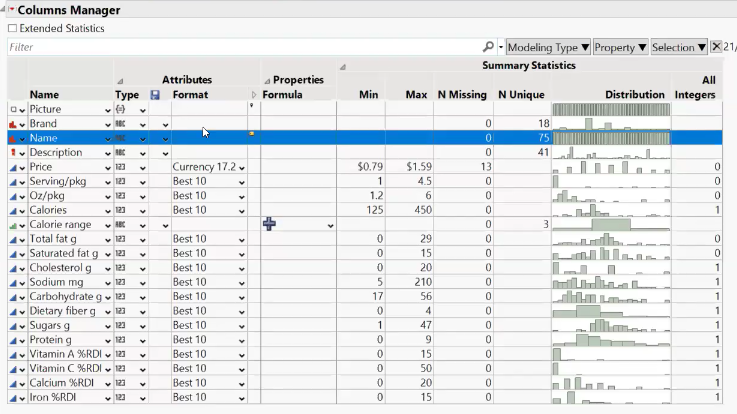
ALT Invoke JMP Colums Manager to view and edit 1 column characteristics at one time.
ALT Use #JMP Model Comparison to compare predictive ability of different models. Get measures of fit and overlaid diagnostic plots for each model.
ALT Learn how to use free #JMP DMAIC add-in for MSA 12 November.
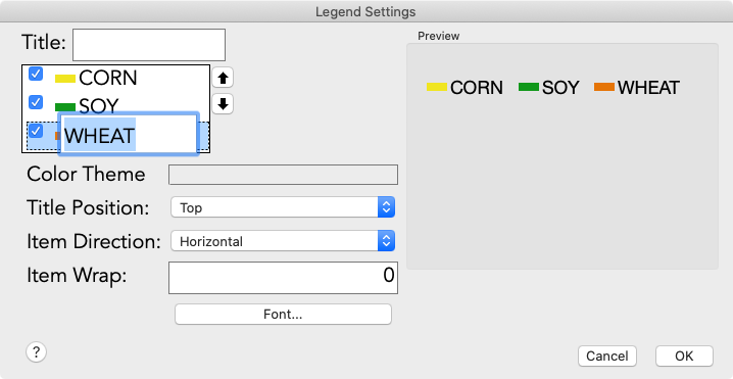
ALT In JMP Graph Builder. graph legends can be customized by right-clicking on the legend title and selecting Legend Settings or by double-clicking on the legend itself.
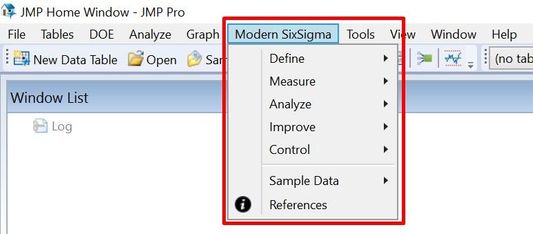
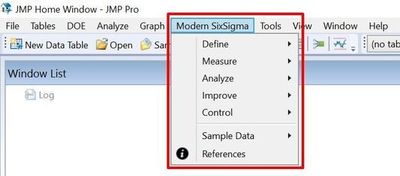
ALT Menu of shortcuts integrating the relevant JMP tools expands to simplify steps in DMAIC process.
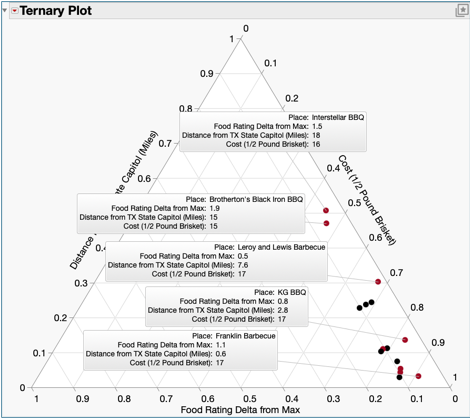
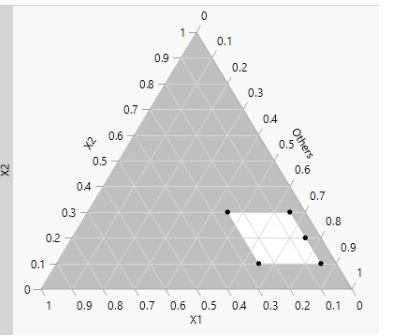
ALT To choose between things involving multiple options, don’t be afraid to get the anser from JMP using three dimensions.
Learn JMP Events
Events designed to further your knowledge and exploration of JMP.
community.jmp.com
ALT JMP Max Diff (maximum difference scaling) is an alternative to standard preference scales to determine the relative importance of items being rated.
ALT Partial Output of #JMP Ternary Plot for Five-Factor Design.
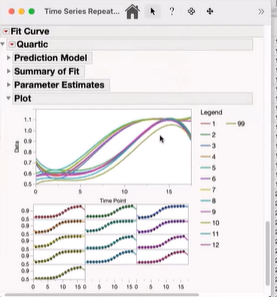
ALT Build, interpret and refine non-linear models using JMP software.
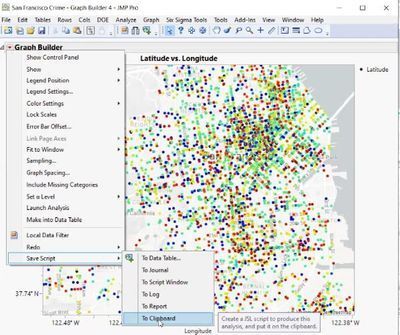
ALT Use hover lables to drill into, pin, view, and save details of JMP reports. Save Script to Clipboard to start nesting graphlet Hover Label code.
ALT One type of mixture is bread dough, where a designed experiment can help identify ingredients and process for the highest rising bread.
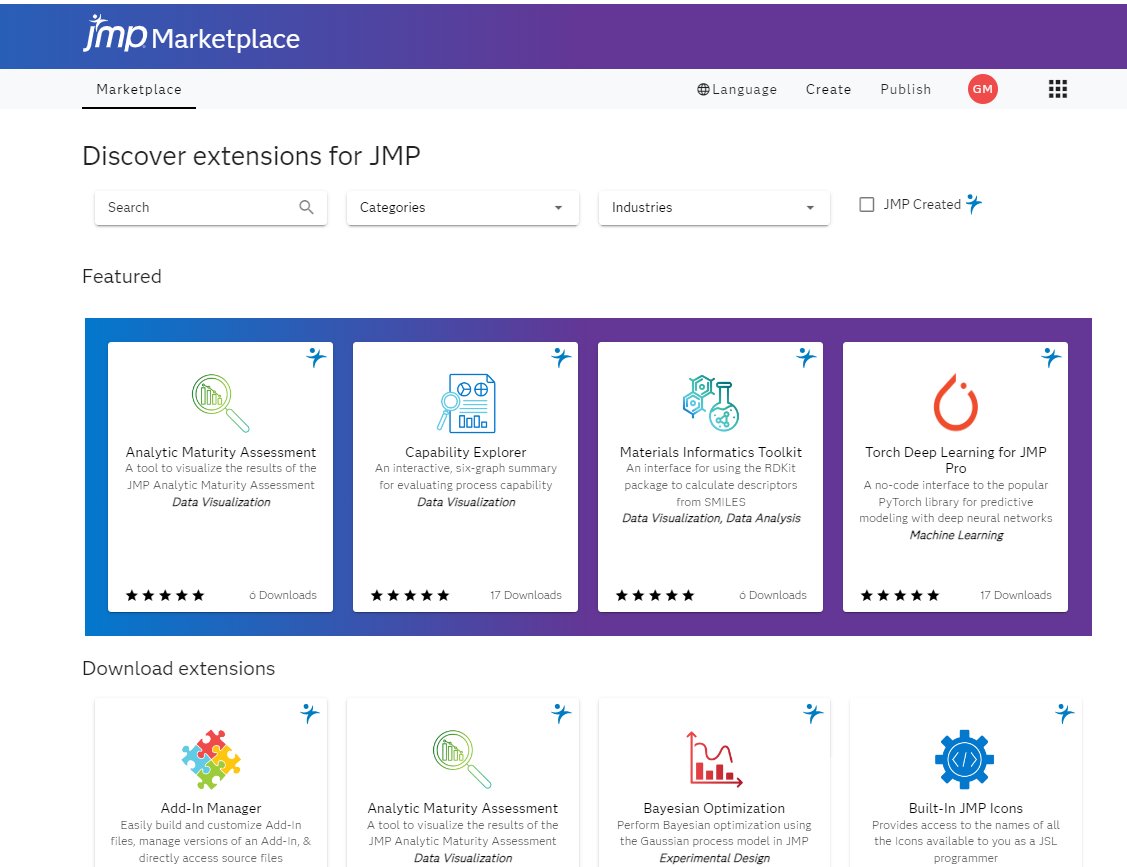
ALT JMP Marketplace is updated regularly to include Add-Ins for extending your JMP capabilities.
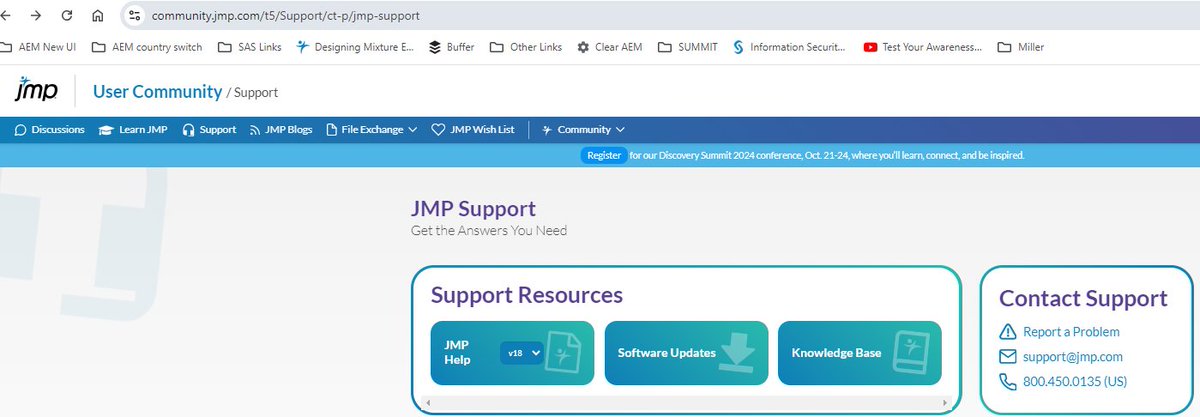
ALT Software testing and CQI is important at JMP. We also make it easy to report bugs (and answer technical questions online, by phone, or by email.

ALT JMP Scripters meet monthly online to share and learn about enhancing JMP using JSL (JMP Scripting Language)

ALT Subscribe to montlhy JMP Newswire. US and European editions are based on where you live.