
Joined May 2019
- Tweets 520
- Following 236
- Followers 304
- Likes 3,514
30 Photos and videos


May 12
Adidas just shared Frances news suits for next year ! Leaking everything before an announcement from the federation is amazing.
New colour, new design. What's everyone thoughts on this 👀
instagram.com/p/DYPiugoiB7s/…
4
2
10
1,088
Jacques Jefferies retweeted

🎙️❤️ Un débrief de la saison 2025/2026 qui finit en discussion à bâtons rompus ( "bravo" @biathstats 😂 ) 2 intervenants au top : @Jacquesjeff_ et @ChronicBiathlon = top épisode ! On en profite pour faire un point sur la saison de Jacques ( merci ) !
➡️ ballesdepioche.podbean.com/e…
2
5
272
Apr 15
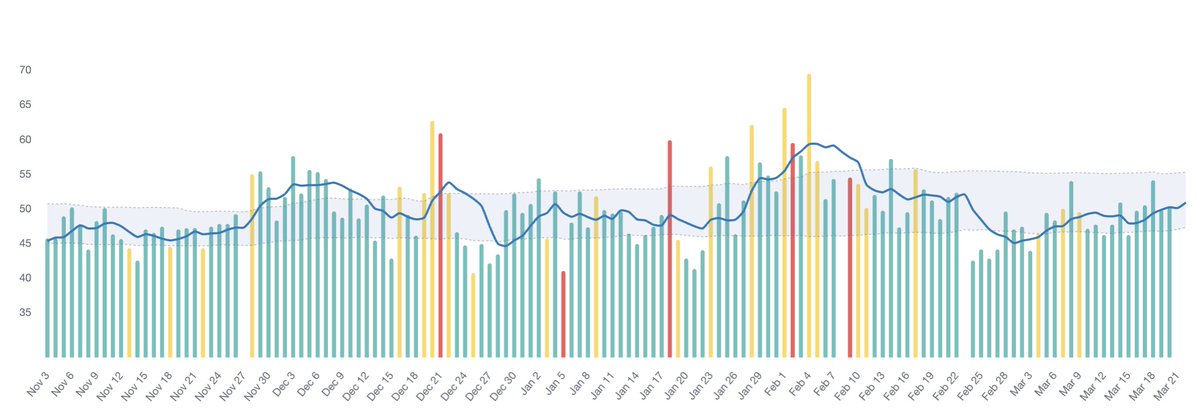
I was staring at this data every single day. I had no idea what it was trying to tell me.
Every morning from November to March, I woke up, lay still for three minutes, and measured my resting heart rate. The app is HRV4training , it tracks your physiological stress day by day and helps you understand how recovered your body actually is.
Here is what the graph shows:
November: stable and healthy. A body ready to race.
Late November into December: a rise around the first IBU Cup races in Austria and Italy. Race excitement. Normal.
December 21st: a sharp spike. That was Le Grand-Bornand, my World Cup debut and the illness that followed over Christmas.
January: relatively flat. The German World Cups. Tired, but managing.
February: look at what happens in February.
The bars climb and keep climbing, peaking right around my Olympic training camp and the Games themselves. The highest point on the entire graph. Every morning I was looking at these numbers and telling myself: this is normal, the plan is working, keep going.
I believed it. I had no reason not to.
What the data could not tell me was why.
On the Tuesday after my final race in Oslo, I took a blood test. The result explained everything.
The full deep dive, the season, the graph, and what the blood test revealed, is in my latest newsletter, Running on an Empty Tank.
Link in bio or reply to this and I'll send it to you. Worth the read.
1
1
13
793
Apr 14
Two days after my final race of the season, I took a blood test. What came back explained everything. 👇
We knew something was wrong. The tiredness all winter that wouldn't lift. Sessions that felt harder than they should. A whole winter of pushing through something we couldn't name.
The result came back positive for Epstein-Barr virus.
The virus that causes glandular fever. The one where the treatment is: stop. Rest. Do not push through it.
I had raced an entire World Cup season with it in my system.
I had competed at the Olympic Games with it in my system.
And I hadn't known.
Today, the full story of this season is live in my newsletter Off The Range, published on Substack.
Running on an Empty Tank: My 2026 Season Recap.
Every race. Every country. Every moment. And what that blood test finally explained.
Link in bio. Go read it. Or reply with your thoughts from this winter and I'll send it to you !
3
2
24
1,949
Apr 13
I found out I was going to the Olympic Games in the back of a car. How did this happen ?
Seven-hour drive home from Ruhpolding, Germany. Exhausted, post World Cup. Half asleep.
My phone lit up. A WhatsApp from the CEO of British Biathlon, Elizabeth Winfield
The IBU had confirmed it. I was on the wildcard list for Milano-Cortina 2026.
I didn't cry. I didn't shout. I just stared at the screen for a while.
Because I knew what it had taken to get there.
The nationality switch. The surgery in May. The races.
The points, one by one.
All of it, for that message.
Tomorrow I'm publishing the full story of this season in my newsletter Off The Range, on Substack.
Running on an Empty Tank: My 2026 Season Recap.
Comment BIATHLON so I can DM you the link. See you tomorrow.
2
3
17
1,263
Apr 12
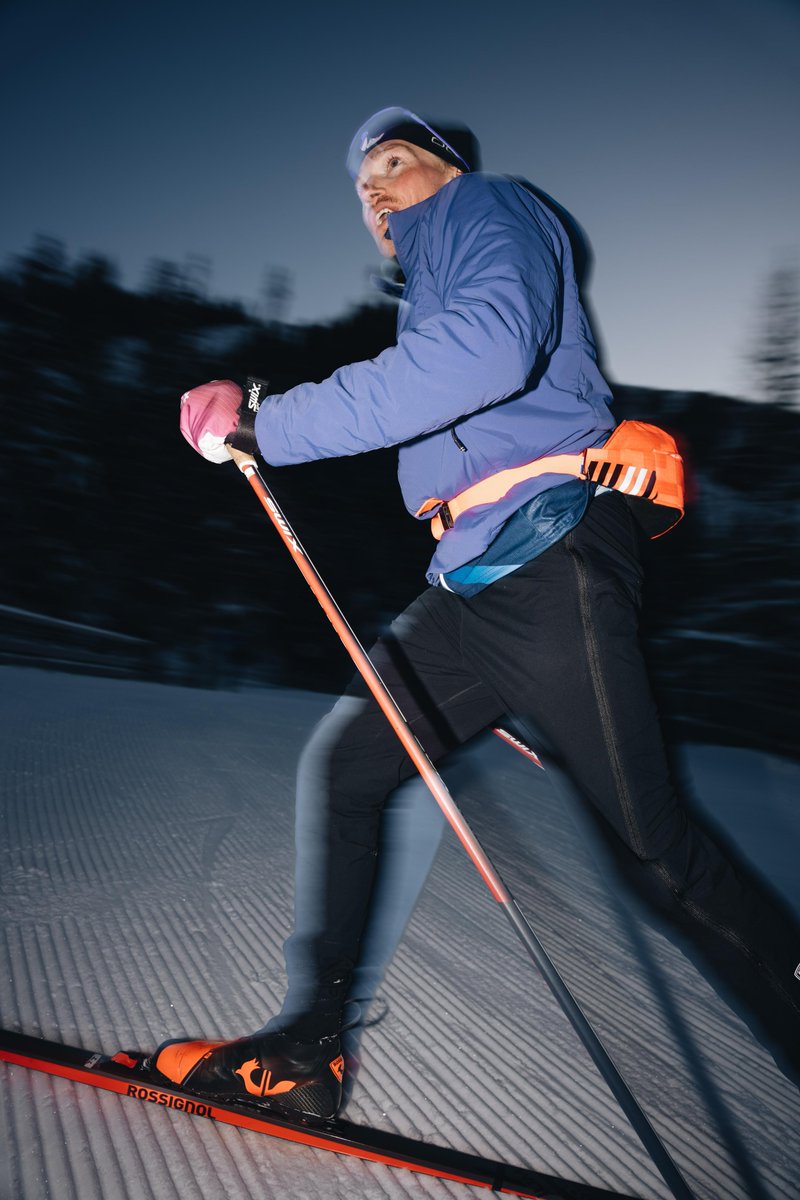
Today I was meant to be running the Paris Marathon. But I'm still siting on my sofa....why?
42 kilometres through one of the most beautiful cities in the world. I ran it last year. I had my place for this year. I was looking forward to it.
However I'm not on that start line today.
Because this winter took more out of me than I knew at the time. A full World Cup season, an Olympic Games, thousands of kilometres of travel across six countries.
And something I only found out about after my final race that explained why I was so much more exhausted than I should have been.
I'll be watching from the sofa instead. Cheering everyone on. And recovering.
The full story of this winter drops Tuesday in my newsletter Off The Range, published on Substack. If you want to understand why I'm not in Paris today, that's where you'll find the answer.
Send me a message in DM to receive the link !
#parismarathon #newsletter
1
12
1,273
Apr 11
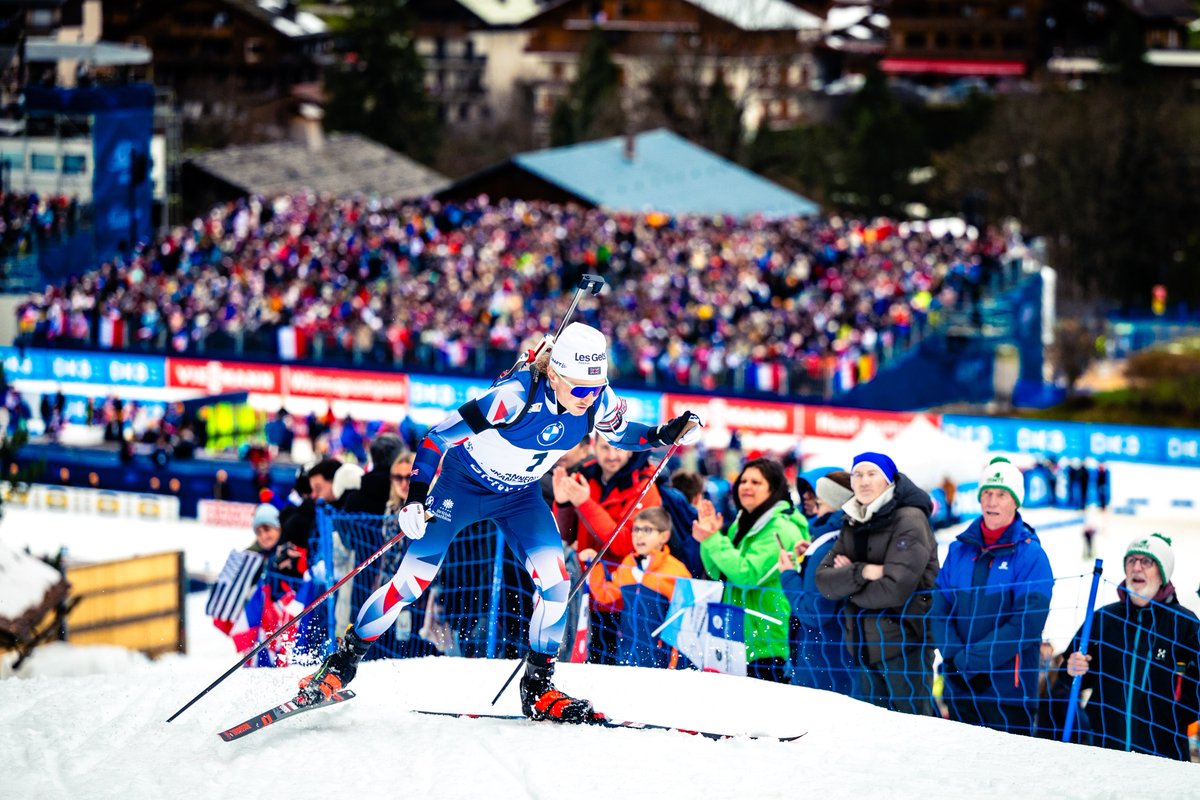
The night before my World Cup debut, I found out I had the scariest but most amazing bib number:
Number 1.
First athlete out of the gate. First one on the shooting range. First one the crowd would see.
I was shaking when I wrote about it that night. I couldn't sleep. I didn't know what to do with myself.
The next morning I walked into a stadium of 20,000 people, waved at the crowd, and they waved back.
Then the beep started and off I went.
I shot clean on the first prone. Five out of five. Alone on the range, with every pair of eyes in that stadium watching.
I finished 53rd. Made the pursuit. Had my parents and sisters at the finish line.
I have watched Le Grand-Bornand on TV my entire life.
That day I lived it.
The full story of this season; every race, every country, every moment; is coming Tuesday in my newsletter Off The Range, published on Substack.
Reply with BIATHLON to receive the link.
14
579
Apr 10
My 2025/26 season, but in numbers.
18 races.
7 countries.
1 World Cup debut.
1 Olympic Games debut.
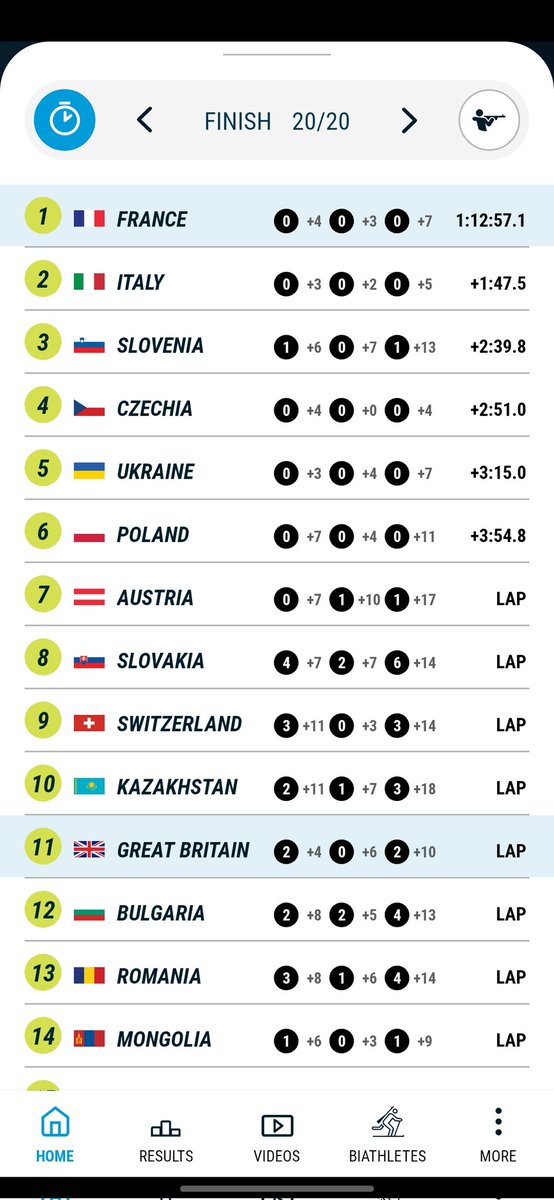
2 relays in British colours.
Top 25 in the IBU Nations Cup standings.
3,000 km on skis.
5,000 rounds fired on the range.
Over 14,000 km travelled across Europe.
And 1 blood test result, taken the Tuesday after my final race, that reframed the entire winter.
The full story drops Tuesday in my newsletter Off The Range, published on Substack.
If you're not subscribed yet, now is a good time.
Photo by Quentin Joly
3
3
37
2,406
Mar 19
It's your women's sprint weather update! You are all going to like this one 😉
1
2
42
3,134
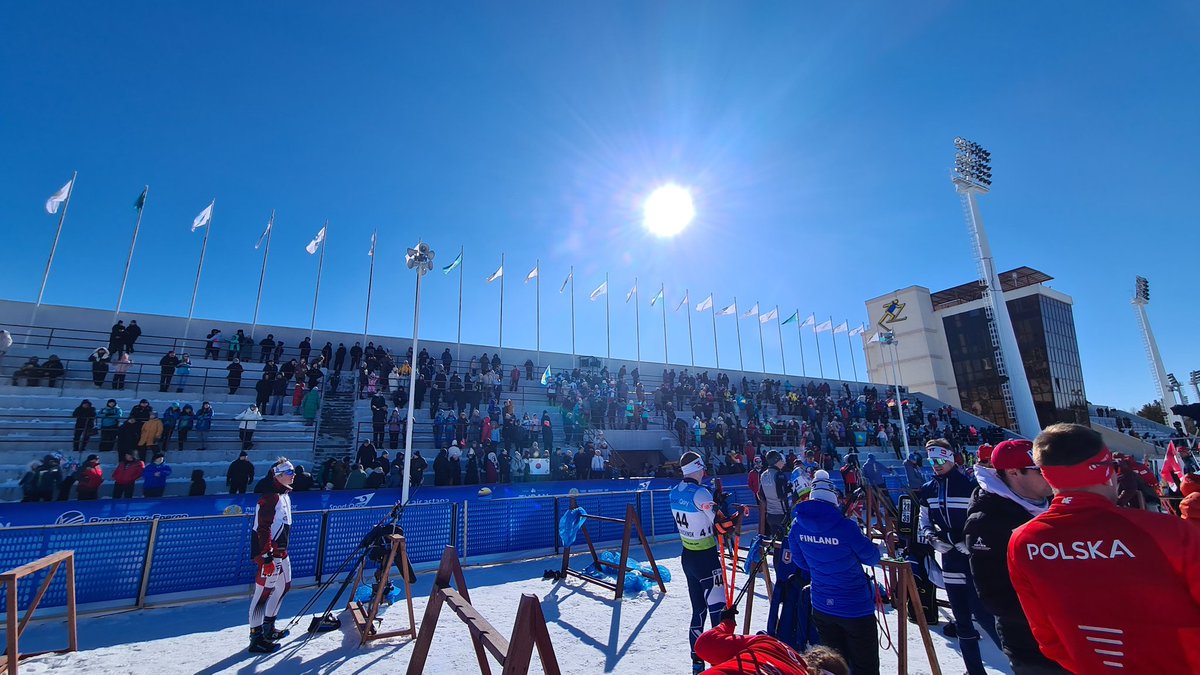
Mar 18
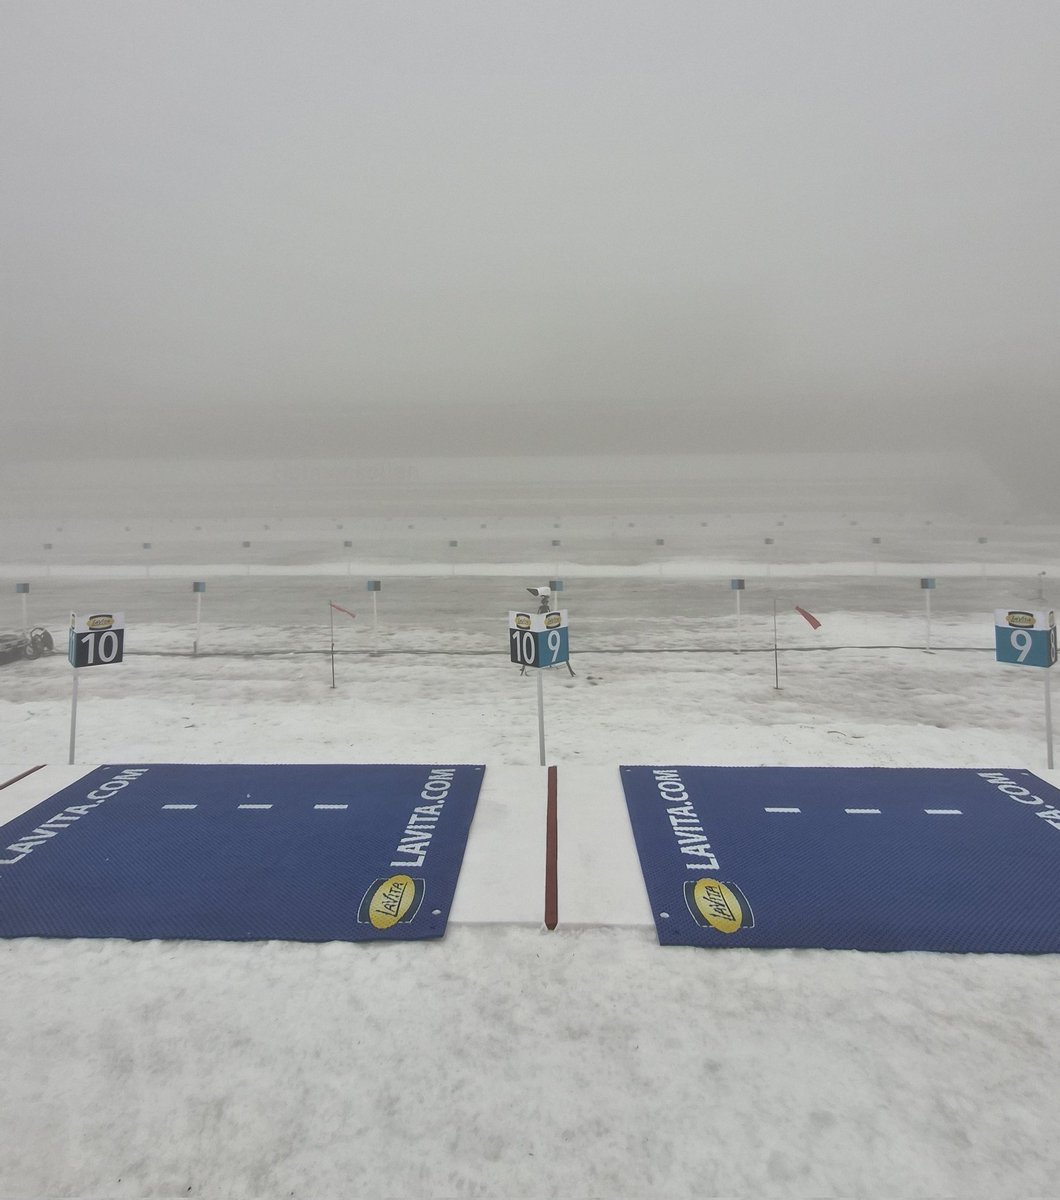
Can you see a Biathlon target? Because I sure couldn't. Just to put into perspective. It's worse when looking down the rifle sights 👀
4
105
6,684
Mar 18
Access to the range has just been banned for today at the Biathlon World Cup. This means some athletes will be competing tomorrow without having ever practiced on the range.
This fog is getting hard to manage. Fingers crossed 🤞
4
9
72
10,335
Feb 14
Turned the TV on and heard Rob Hatch's amazing commentary voice and thought I was watching some cycling. But no. He's also commenting on the Olympic Short Track. Absolutely love it. The diversity 🫶🏼 @cyclingontnt @tntsports
1
5
952
Perks of being a futur Olympian, my name now has a little bleu checkmark next to it ! Let's go this. Time for me to try and figure out how X works and provide some good content for you all!
3
33
2,323
Jan 30
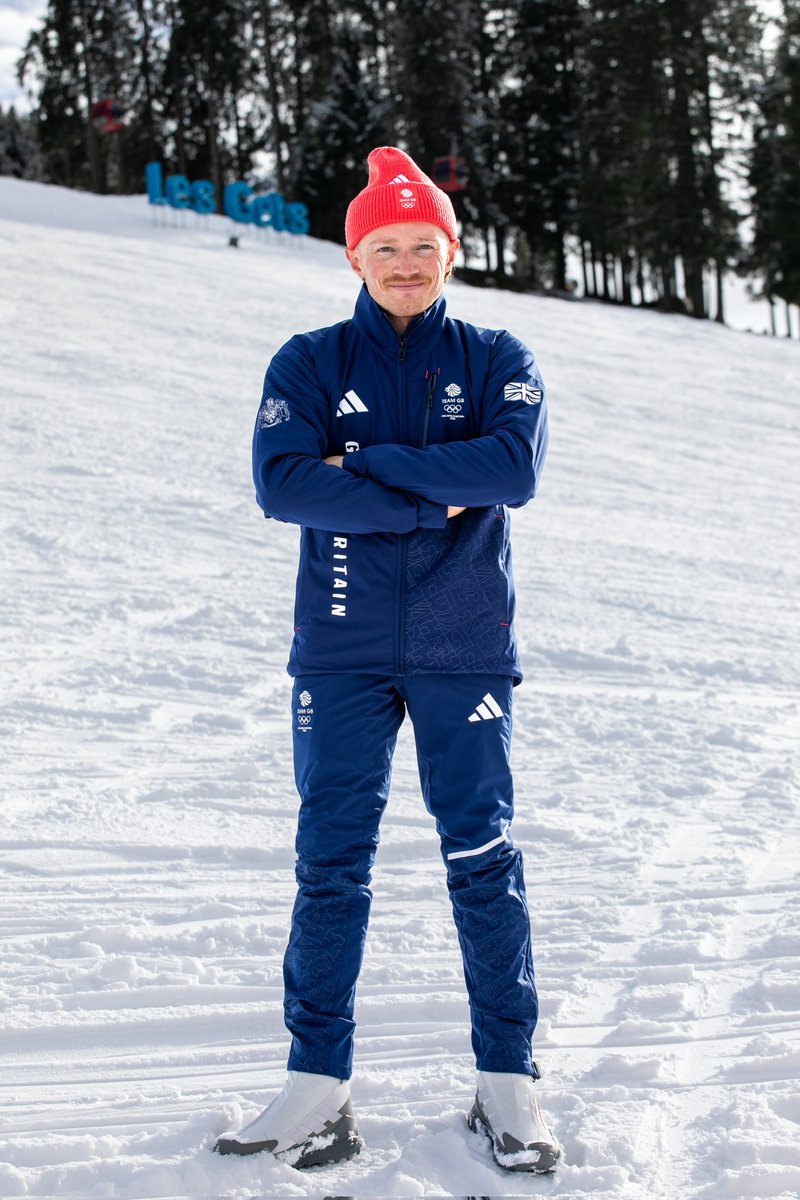
I don't how well videos do on X but this is definitely worth the watch. 👀 @TeamGB kit, it's amazing, the design from Adidas is top quality and I'll be looking on fire out at the Olympic Games in February! 🧥🇬🇧
2
1
16
1,090
Jan 26
I'm going to the Winter Olympic Games. 🇬🇧
Hard to put into words what this means. The biggest stage in the world. Competing for @TeamGB in Milano-Cortina. I'm incredibly grateful for this amazing opportunity! Thanks for everyone on X who has believed in me this past winter 🫶🏼❄️
8
5
60
1,887
Jacques Jefferies retweeted

19 Dec 2025
🇬🇧Jacques Jefferies makes his World Cup debut wearing bib #1 in the sprint at Annecy-Le Grand-Bornand. The three-time Junior World Champs medalist leads off a field of over 100 athletes.
Remember to tune in on biathlonworld.com/watchlive
10
65
3,604
Jacques Jefferies retweeted

16 Dec 2025
🇬🇧🇫🇷 Sous les couleurs britanniques depuis cet hiver, le Haut-Savoyard Jacques Jefferies disputera sa première course de Coupe du monde vendredi au Grand Bornand.
biathlonlive.com/coupe-du-mo…
1
12
1,620
16 Sep 2025
5 months of silence. Rumors everywhere. Everyone seems to know, but I've never officially said anything.
Thursday, I explain why a world junior champion had to take the hardest decision of his athletic career.
Some secrets can't stay hidden forever.
1
12
1,228
18 Aug 2025
Speaking up is the best thing we all go do to provide a better training environment for everyone!
18 Aug 2025

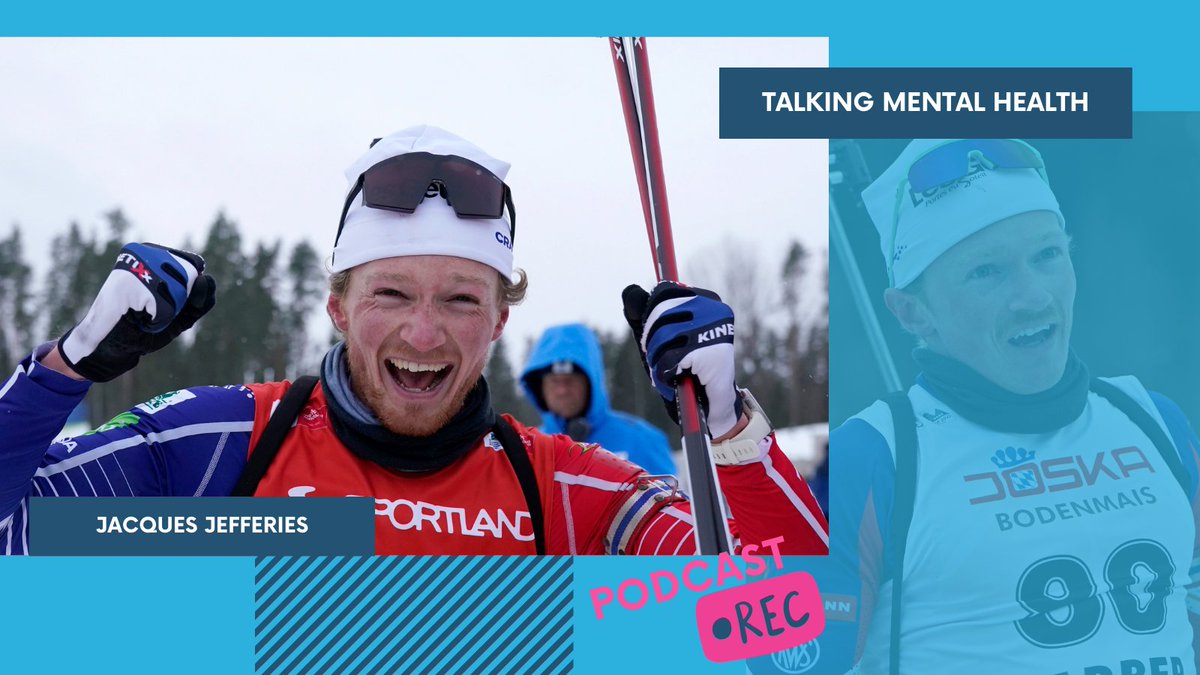
Mental health isn’t a side note — it’s part of performance. Talking about it is hard, but it can help more people than we imagine💬
Don't miss our latest podcast on #MentalHealth with @Jacquesjeff_ 👇
open.spotify.com/episode/2BN…
📷 Koksarovs/IBU #SummerOfMentalHealth #Biathlon
6
1,115
6 May 2025
Le 13 avril dernier, j'ai couru le Marathon de Paris. 42km dans les rues de la plus belle capitale du monde. 3h12 au chrono final.
Une expérience hors du commun que je raconte à travers une édition spéciale de ma newsletter en français disponible ici:
jacquesjeff.substack.com/p/p…
1
1
568
6 May 2025
Du biathlon au marathon, de la préparation express aux sensations sur le parcours, je vous partage tout.
Les pavés des Champs-Élysées, le vent dans Bercy, la foule à Bastille, les derniers km dans le bois de Boulogne... chaque moment de cette course restera gravé.
1
550