Creating visual solutions that support research in sustainability, climate change, and ecology. Tweets by @JamieKapitain Instagram: bit.ly/2SgtIol
Joined June 2009
- Tweets 389
- Following 215
- Followers 284
- Likes 213
126 Photos and videos


Mar 31
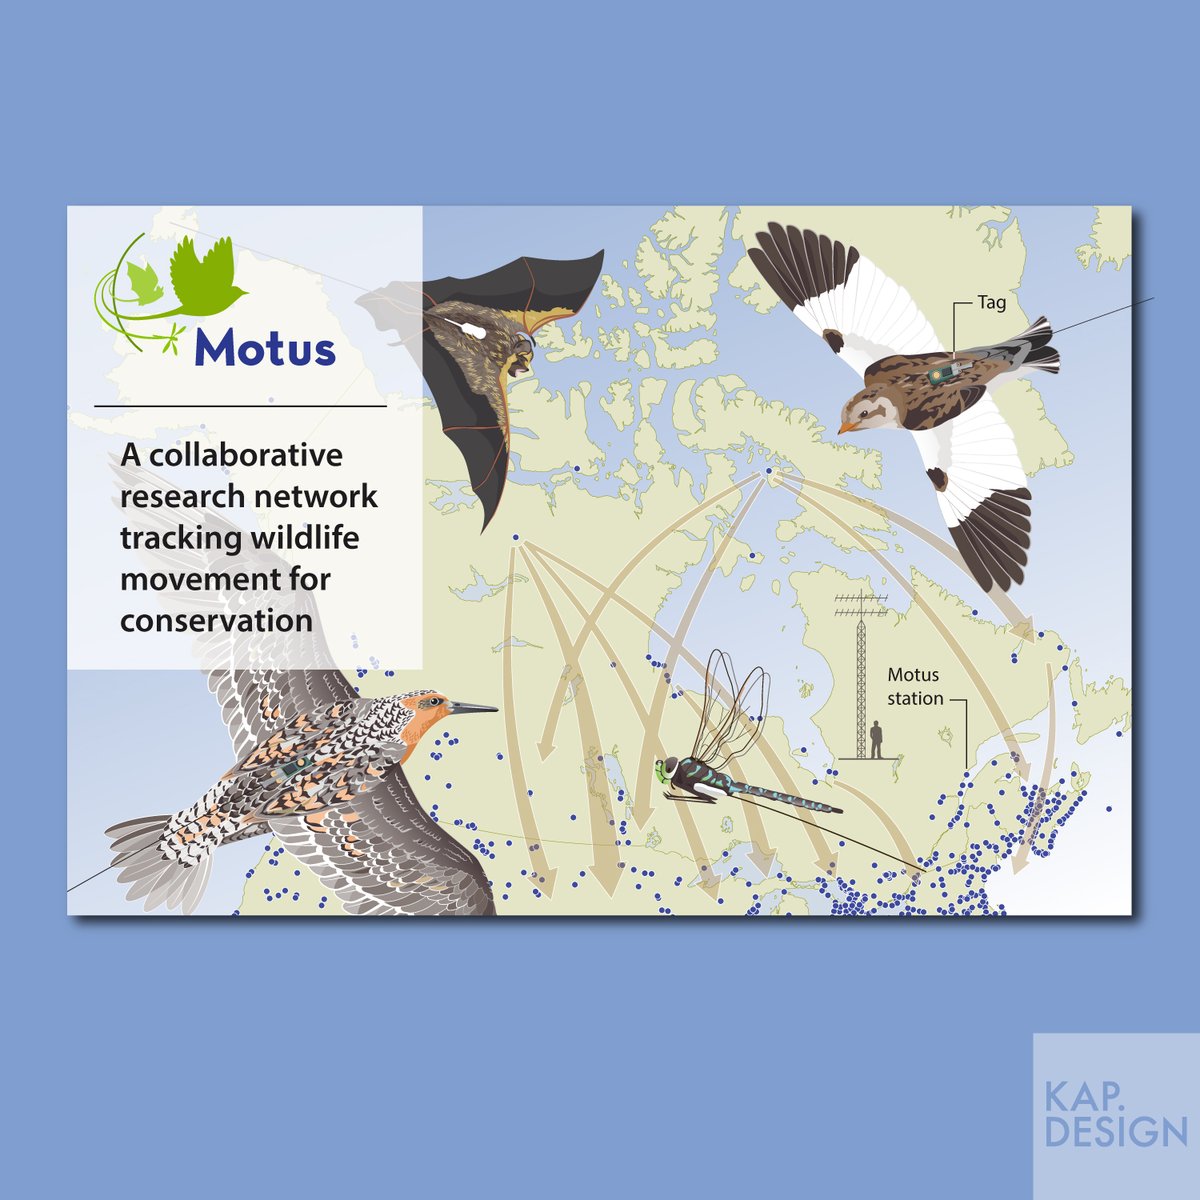
KAP created a new postcard with @BirdsCanada to spread the word about Motus, a wildlife tracking system and community for the conservation of birds, bats, and insects. #wildlife #birdmigration #scicomm
13
Mar 4
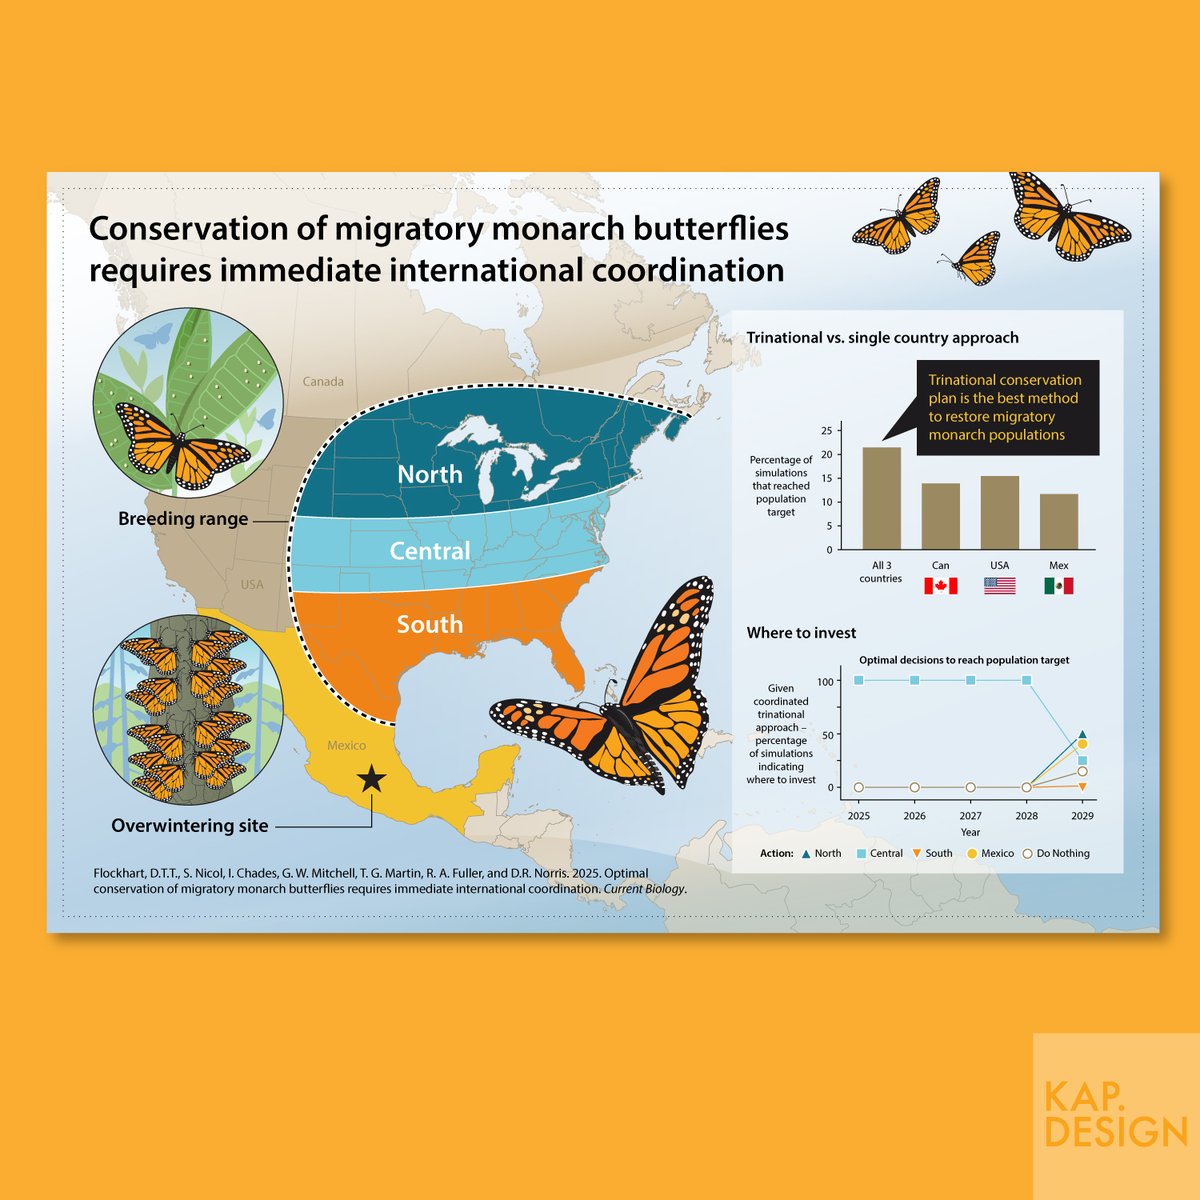
We collaborated again with @RyanNorrisSci to create a research dissemination package that included this #infographic about monarch butterfly conservation. #knowledgemobilization #scicomm
1
17
KAP. Design retweeted
6 Oct 2023
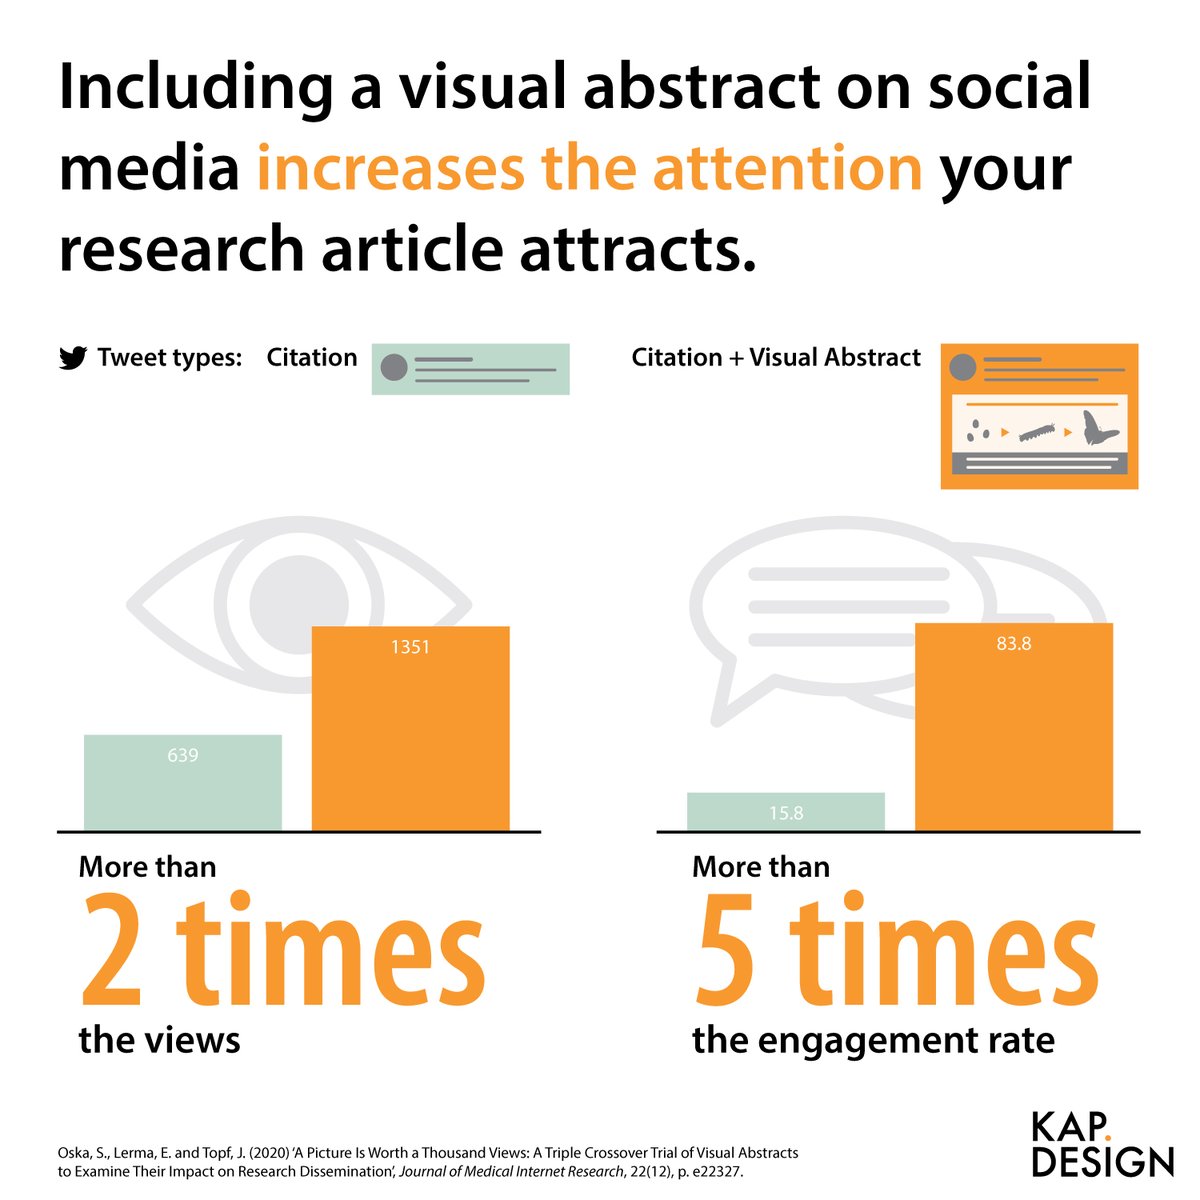
KAP has collaborated with many researchers and organizations to create visual abstracts and infographics that increase engagement. #infographics #visualabstracts #scicomm
2
173
17 Oct 2025
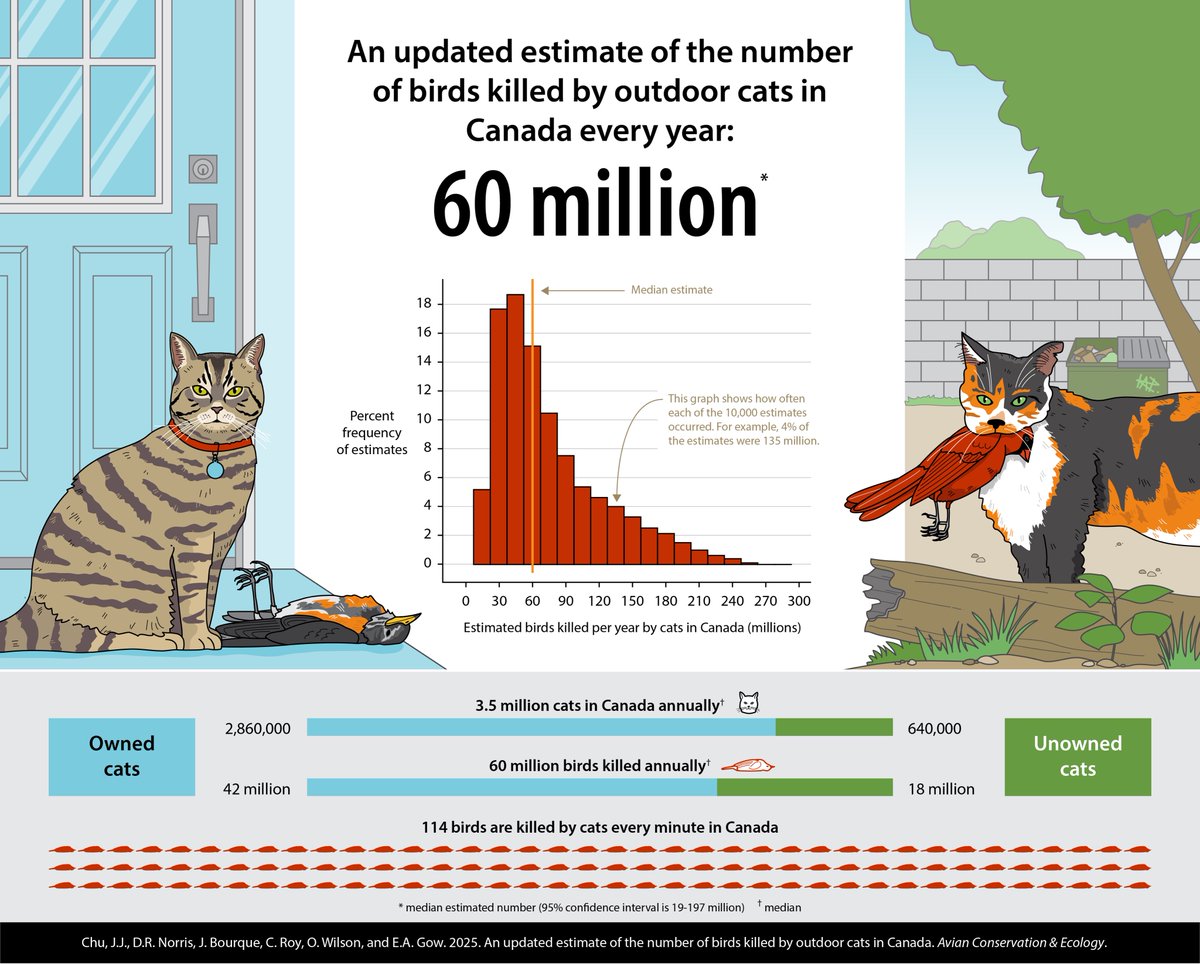
KAP has collaborated with @RyanNorrisSci to create another infographic about research into the number of birds killed by outdoor cats. Read the research paper in @AvianAce at doi.org/10.5751/ACE-02926-20… #infographic #scicomm
36
KAP. Design retweeted

29 Jul 2025
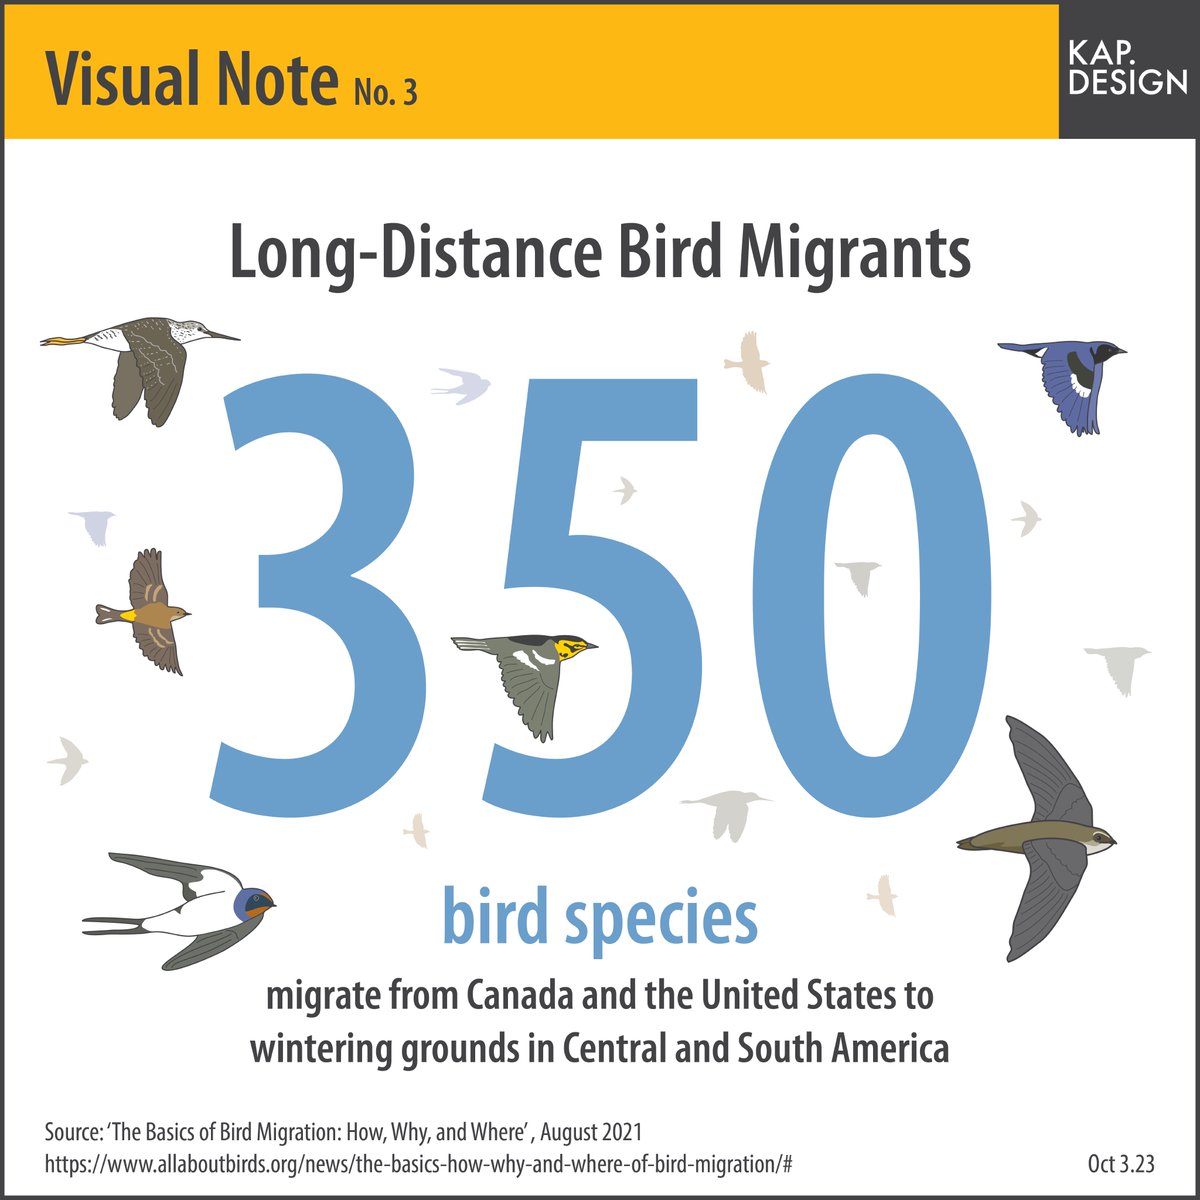
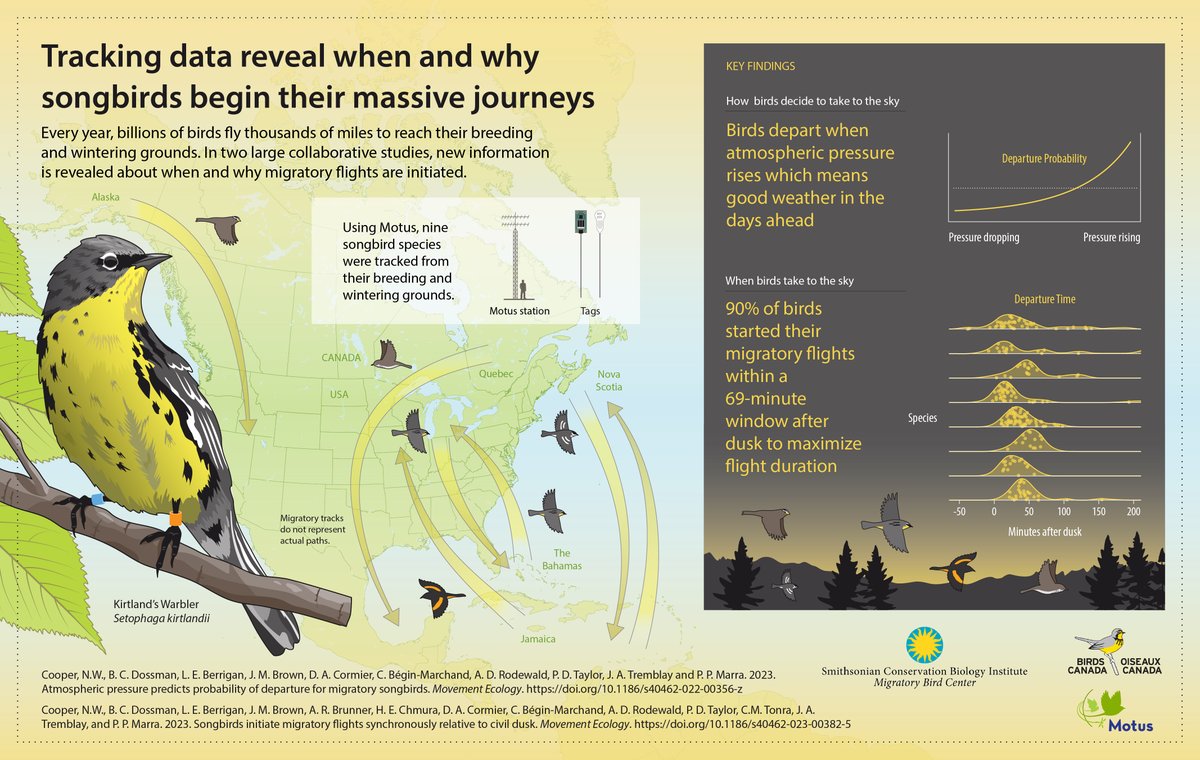
Every year, billions of birds fly thousands of miles to reach their breeding and wintering grounds. In two large collaborative studies, new information is revealed about when and why migratory flights are initiated.
Learn more here: s.si.edu/43Xgf85
7
10
834
10 Oct 2024
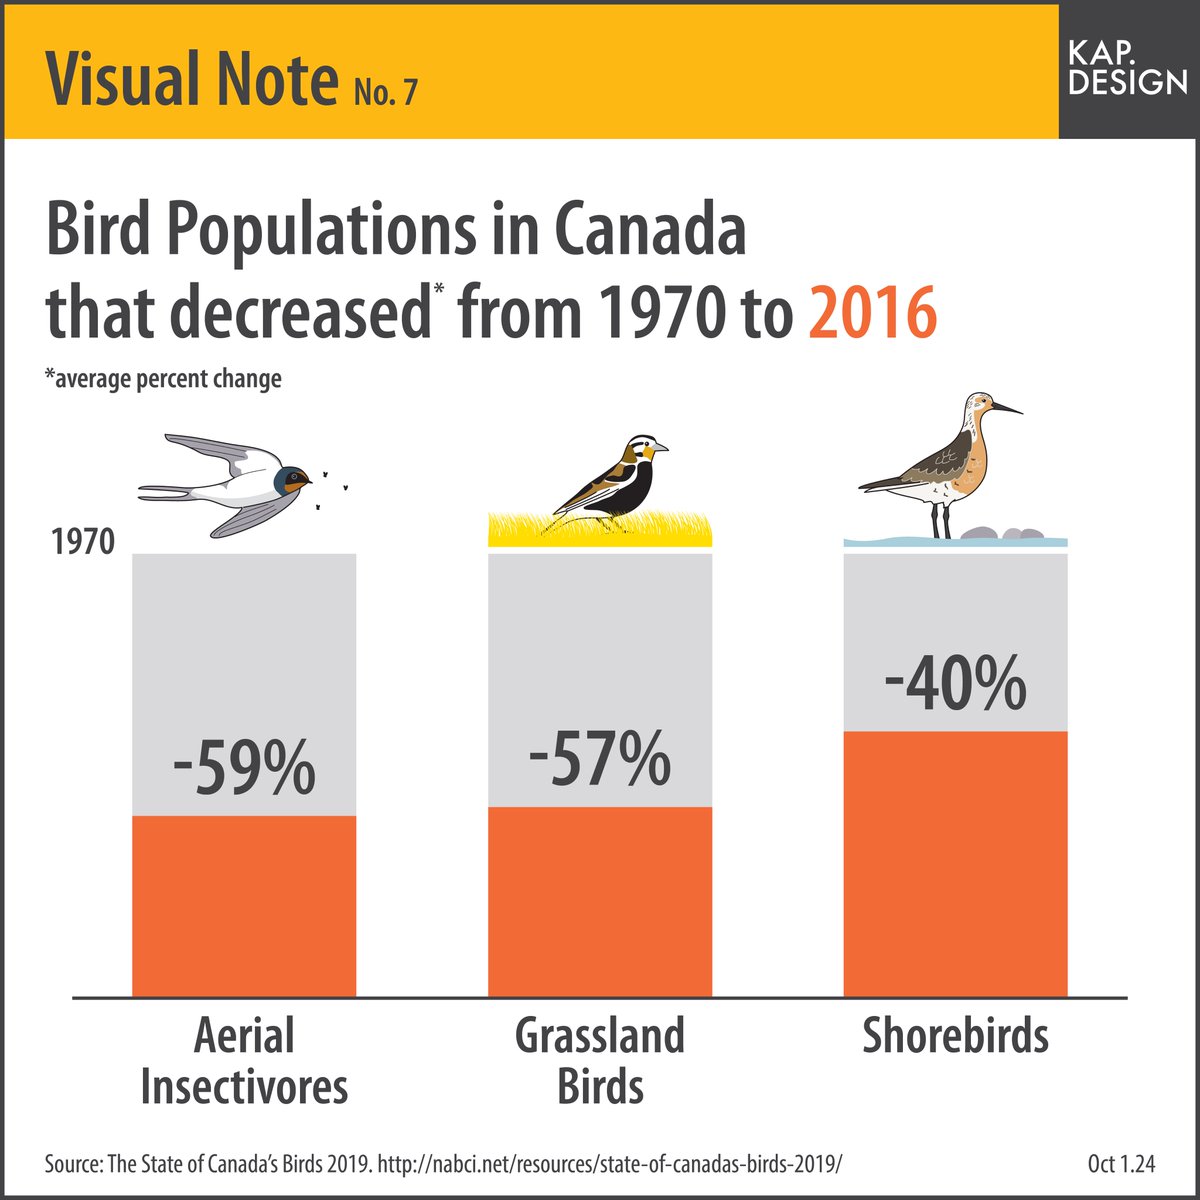
Visual Note 7. Three bird populations in Canada have significantly declined since 1970. Visual Notes is a series of infographics created by KAP to visualize information discovered during the day-to-day rigmarole. #infographic
38
23 Sep 2024
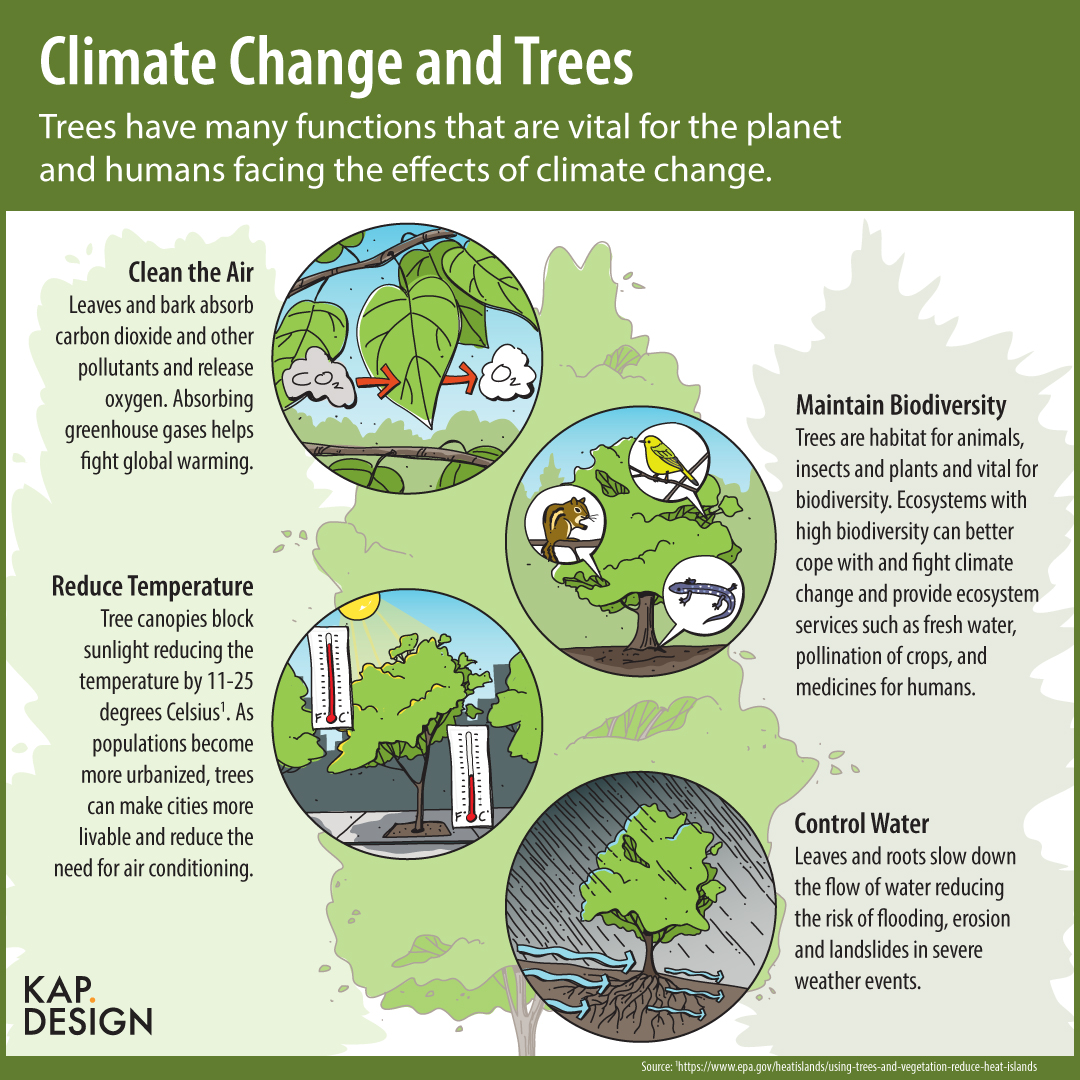
Happy National Forest Week! Here's an illustrated 'value of trees''.
#NationalForestWeek
35
3 Sep 2024
We collaborated with @UofGCBS to create this campus map for 300 incoming students at the @uofg. #illustratedmap
1
57
9 Jan 2024
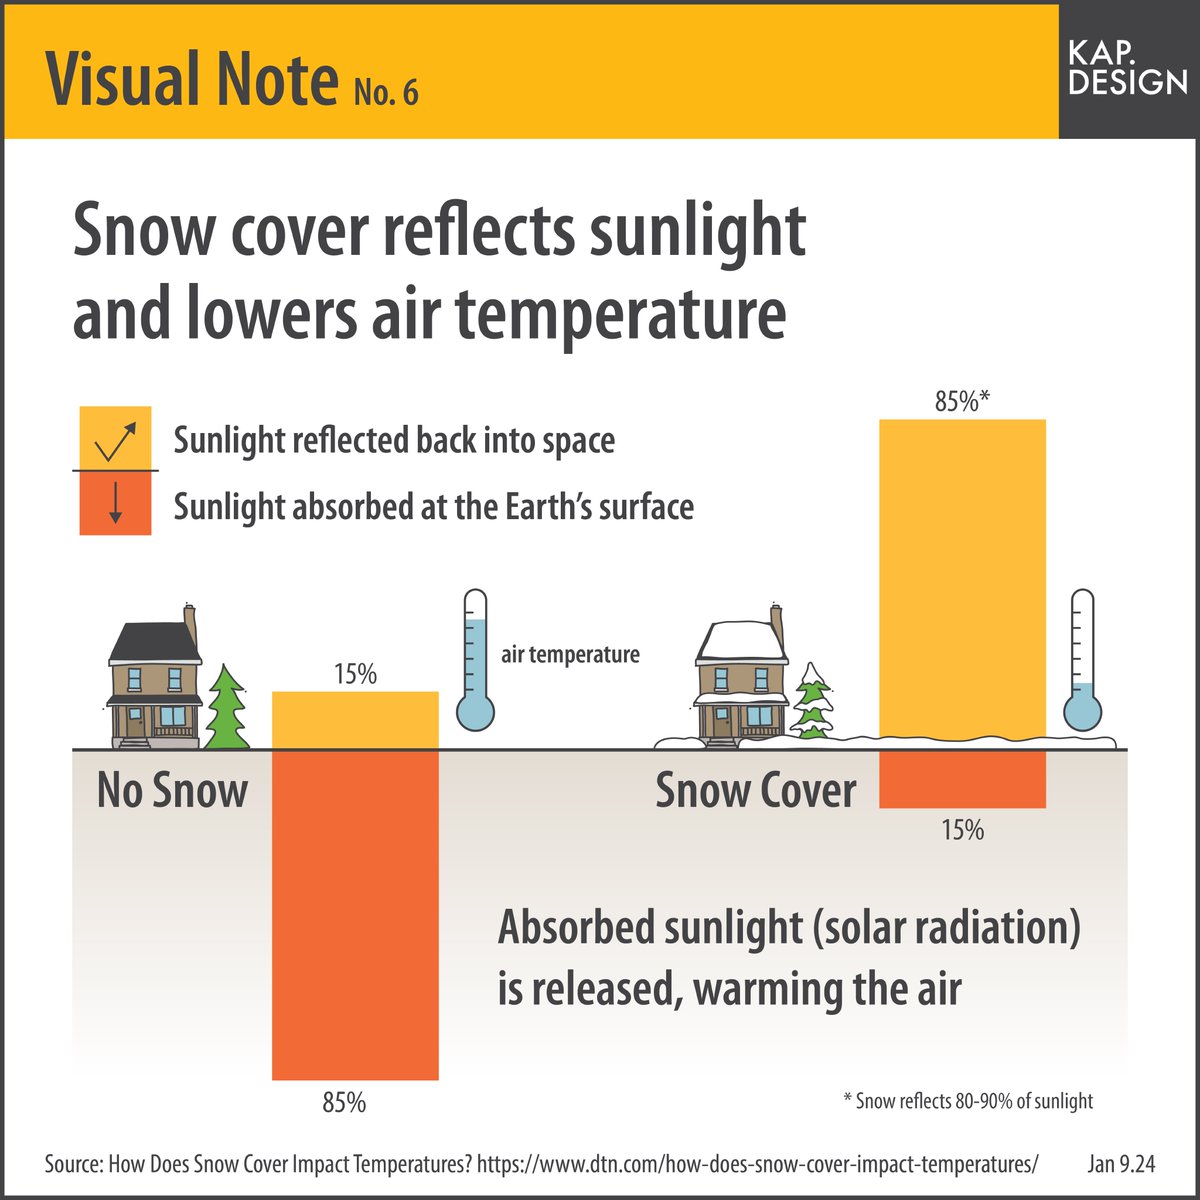
Visual Note 6. Did you know that snow cover impacts air temperature? Visual Notes is a series of infographics created by KAP to visualize interesting information discovered during the day-to-day rigmarole. #infographic
72
KAP. Design retweeted

11 Oct 2023
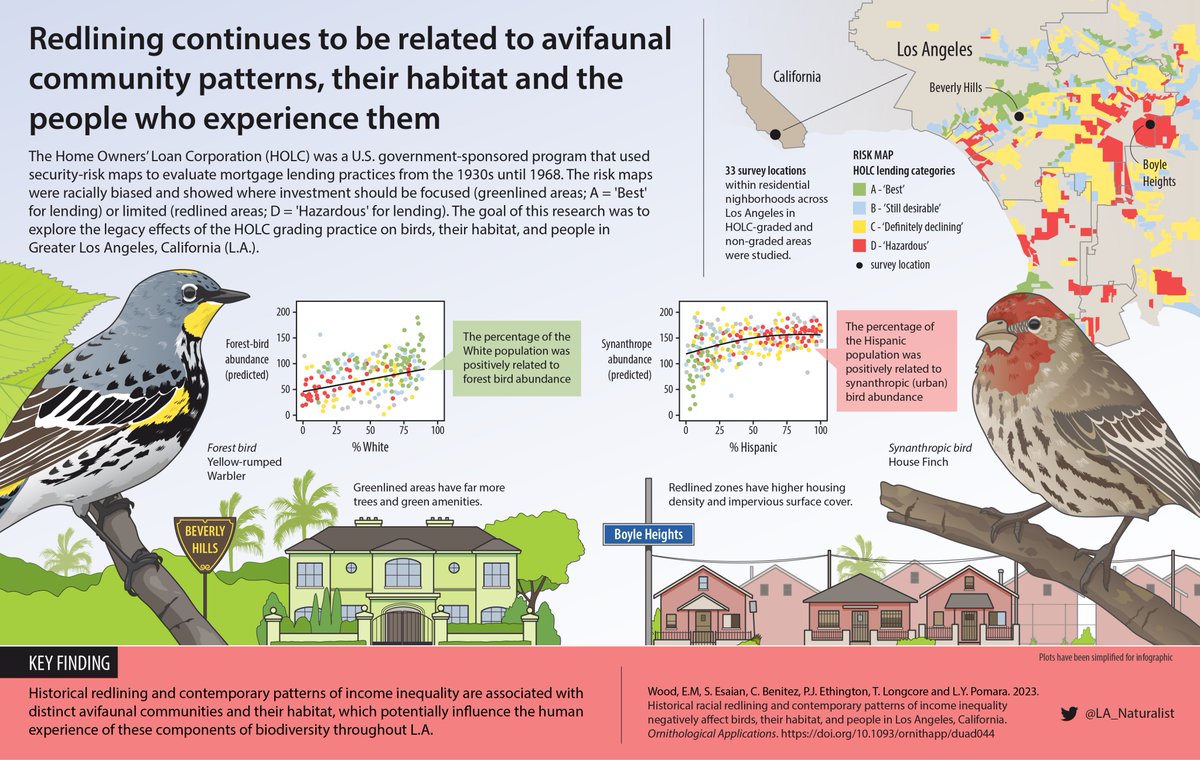
Happy to share our new monograph on redlining, birds, their habitat, and people in Los Angeles just out in @AmOrnith. Please see the infographic below, put together by @KAPdesign, for details
If you're unable to access the paper (see link) please DM me
academic.oup.com/condor/adva…
8
73
233
40,522
1 Nov 2023
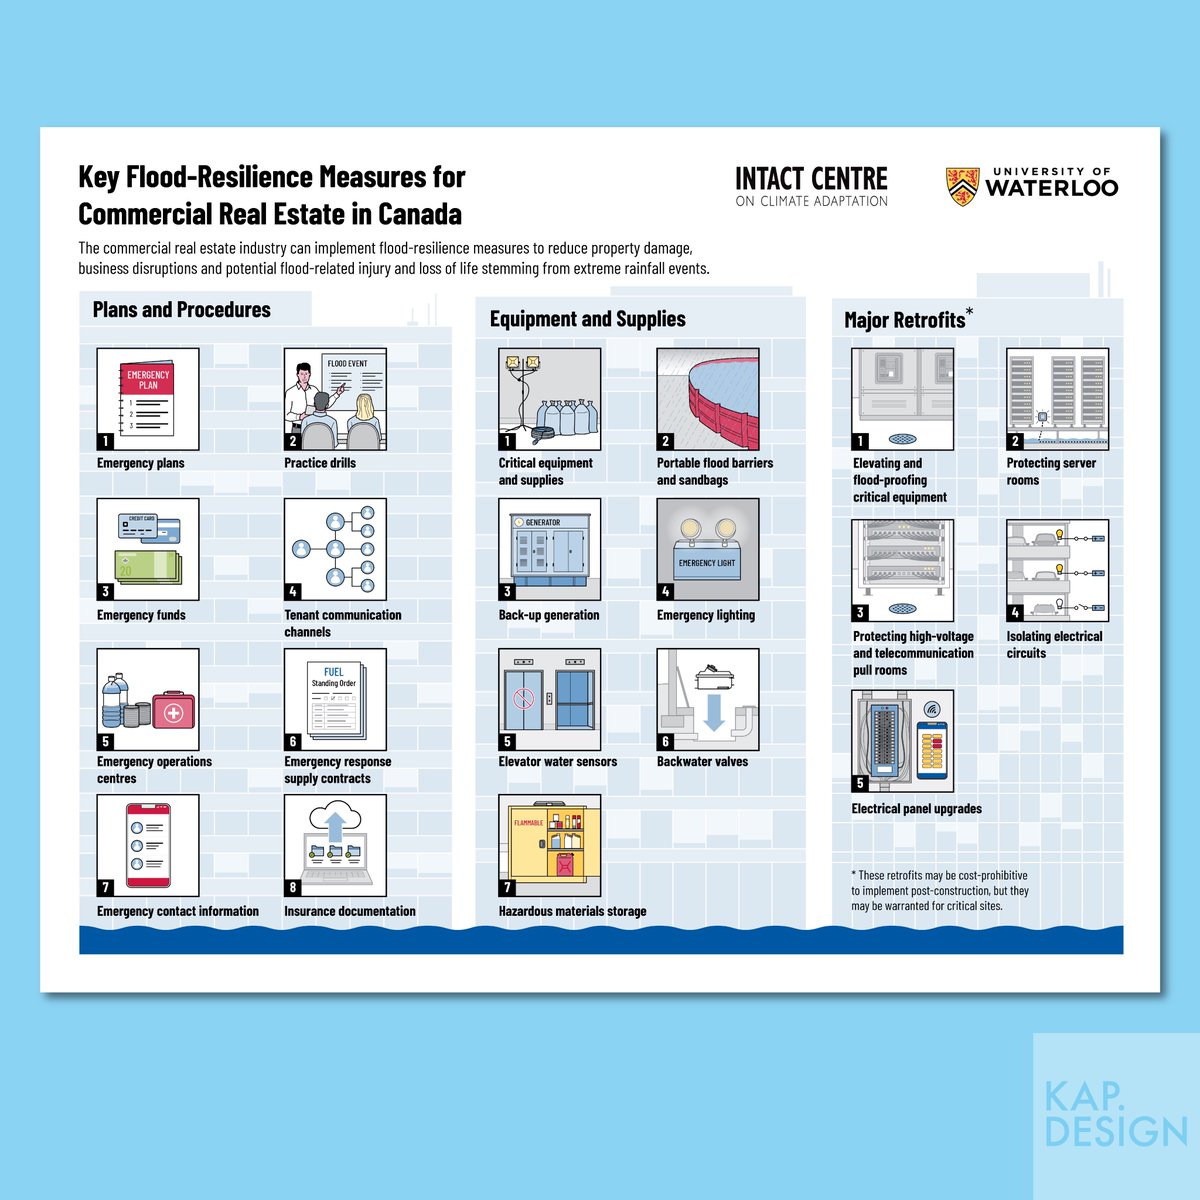
We've collaborated with @ICCA_Canada to create this infographic sheet about flood-resilient measures that can reduce damage from extreme rainfall events in commercial real estate. See all of the climate-ready infographics at intactcentreclimateadaptatio… #infographics
1
1
172
16 Oct 2023
A new infographic collaboration with @LA_Naturalist about research into the effects of redlining on birds, their habitat, and people in Los Angeles. #scicomm #visualabstract #ornithology
1
2
208
13 Oct 2023
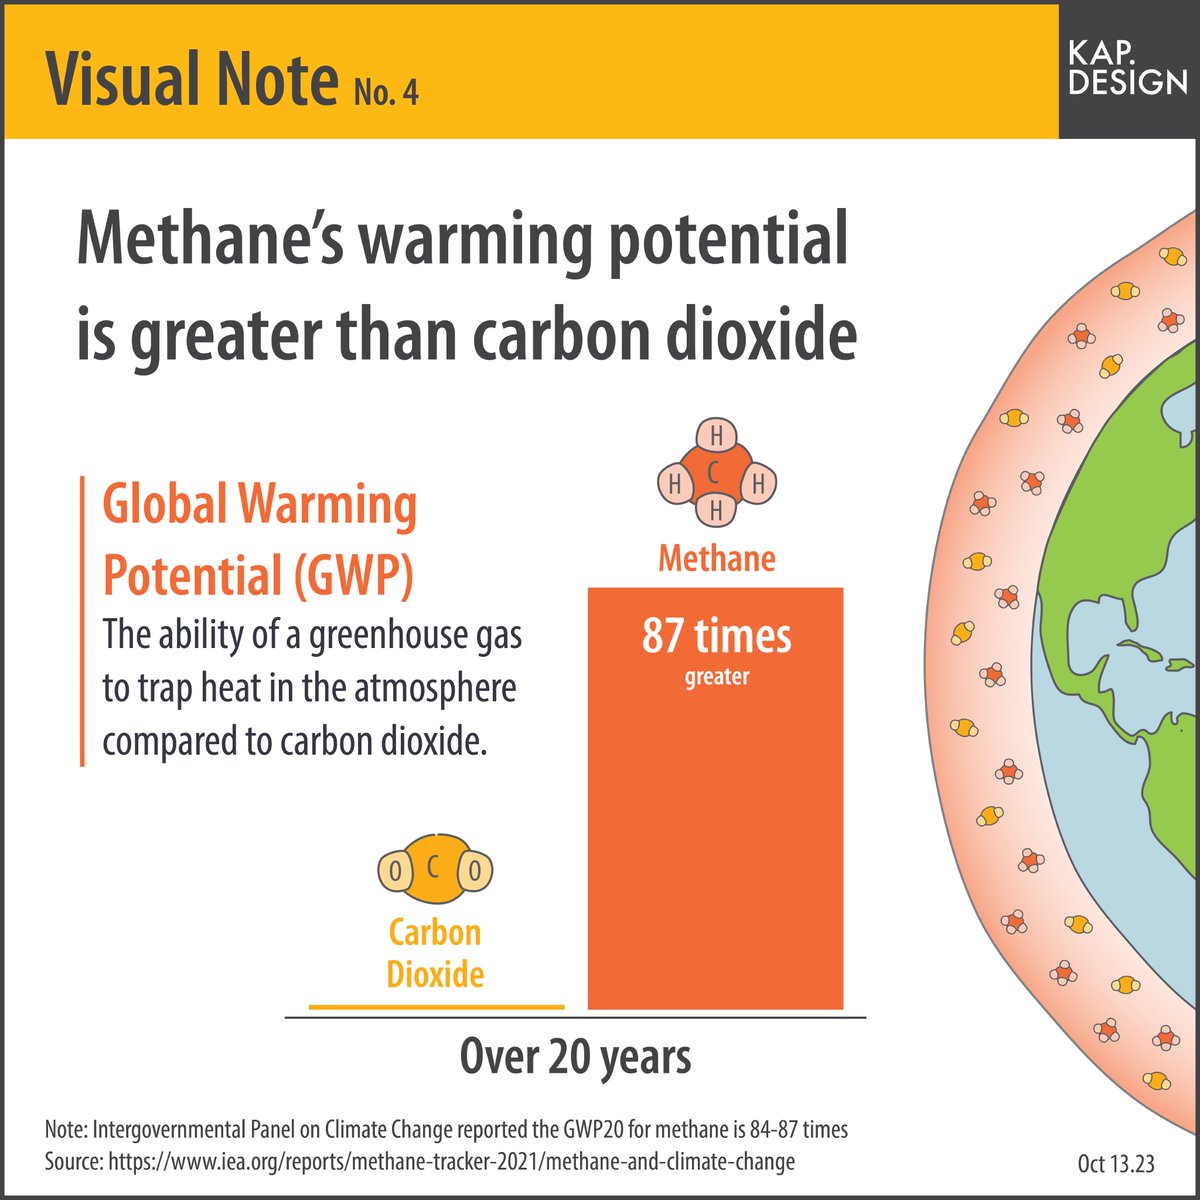
Visual Note 4. Not all greenhouse gases have the same ability to trap heat. #infographic #climatechange
82
27 Sep 2023
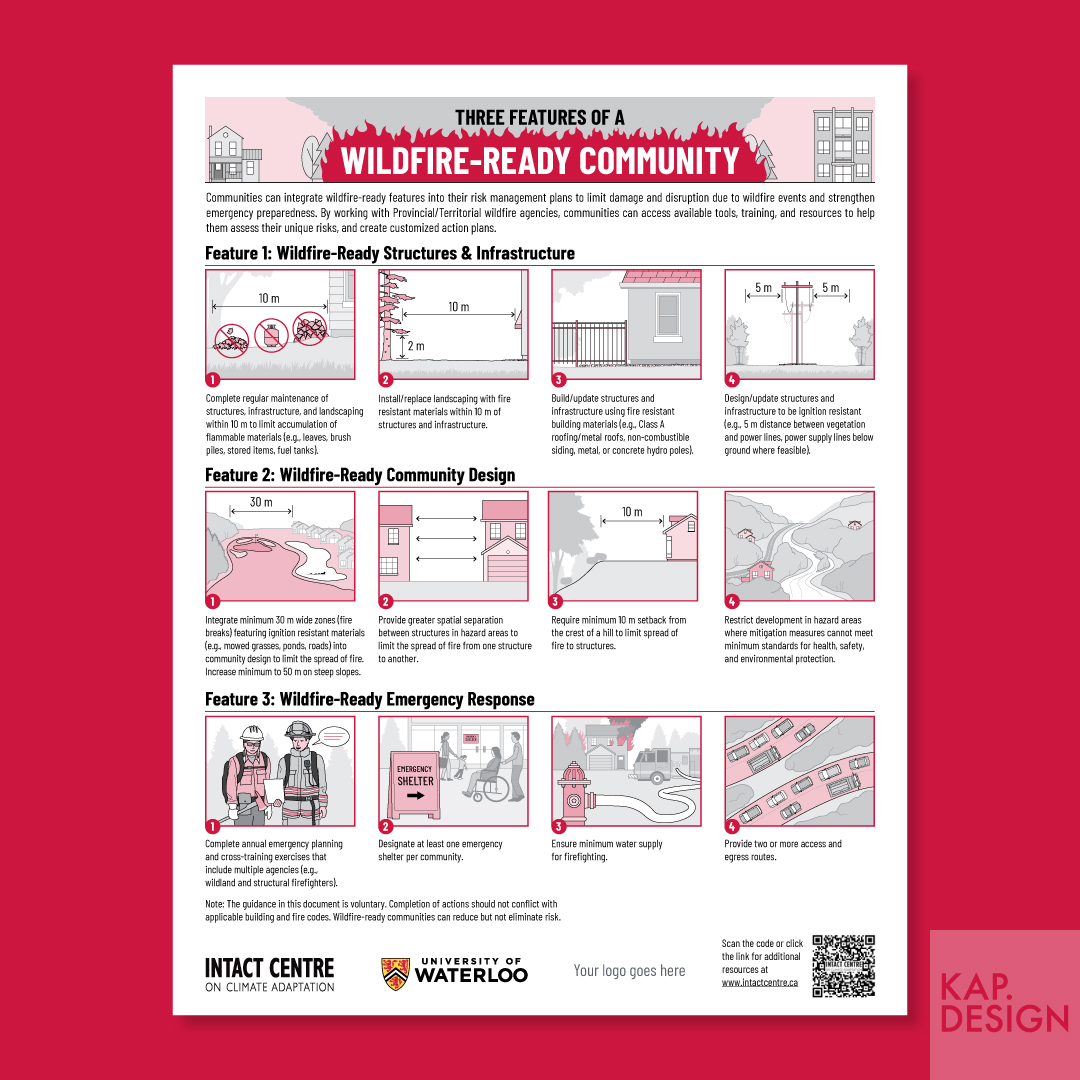
This Wildfire-Ready Community infographic is one of six in the 'Climate-Ready' infographic series KAP has created with the @ICCA_Canada. See all six at intactcentreclimateadaptatio… #wildfireprotection #climateready #infographic
60
25 Sep 2023
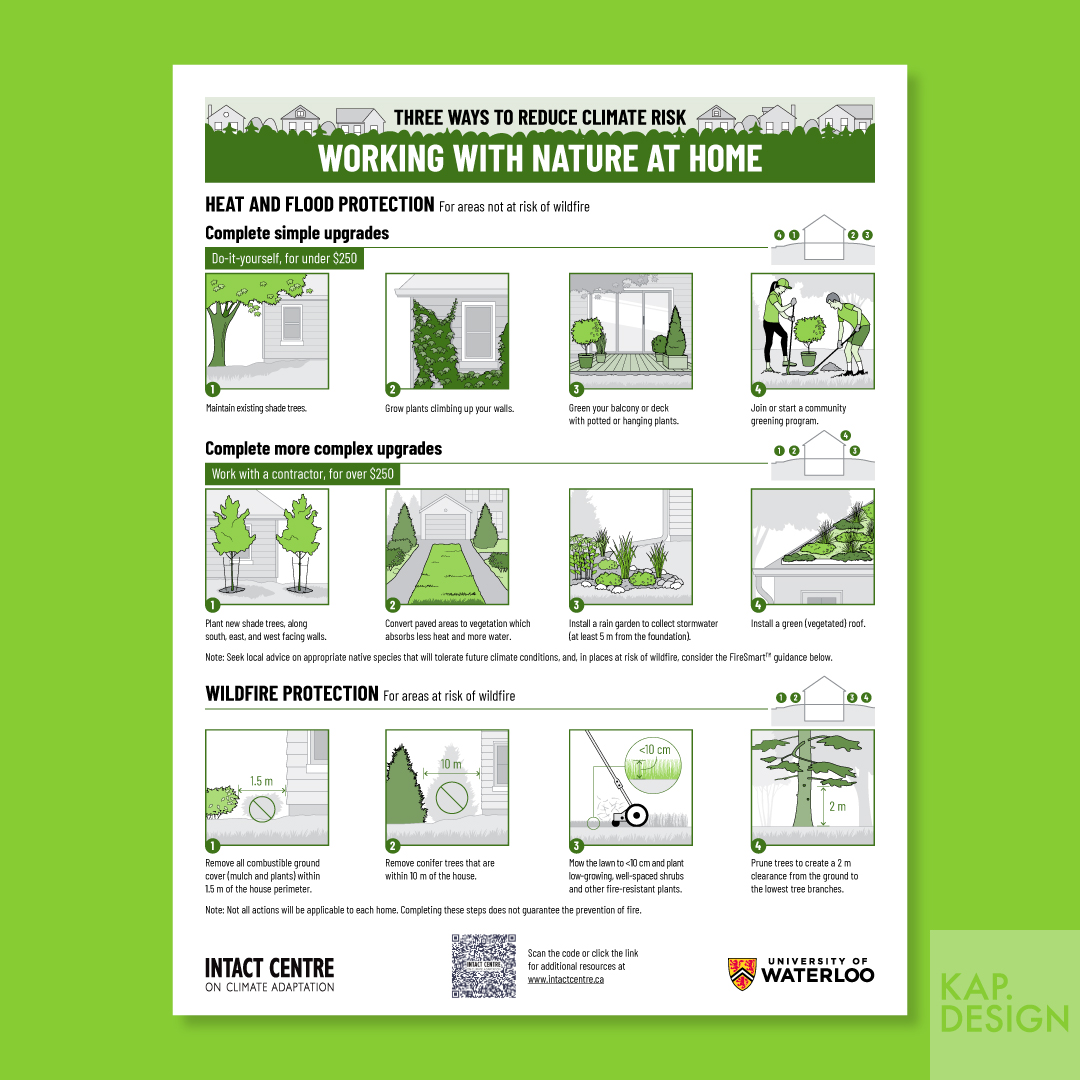
KAP has collaborated again with @ICCA_Canada to create this #infographic asset about reducing climate risk at home using natural solutions. #climateadaptation #heatprotection #floodprotection #wildfireprotection
61
21 Aug 2023
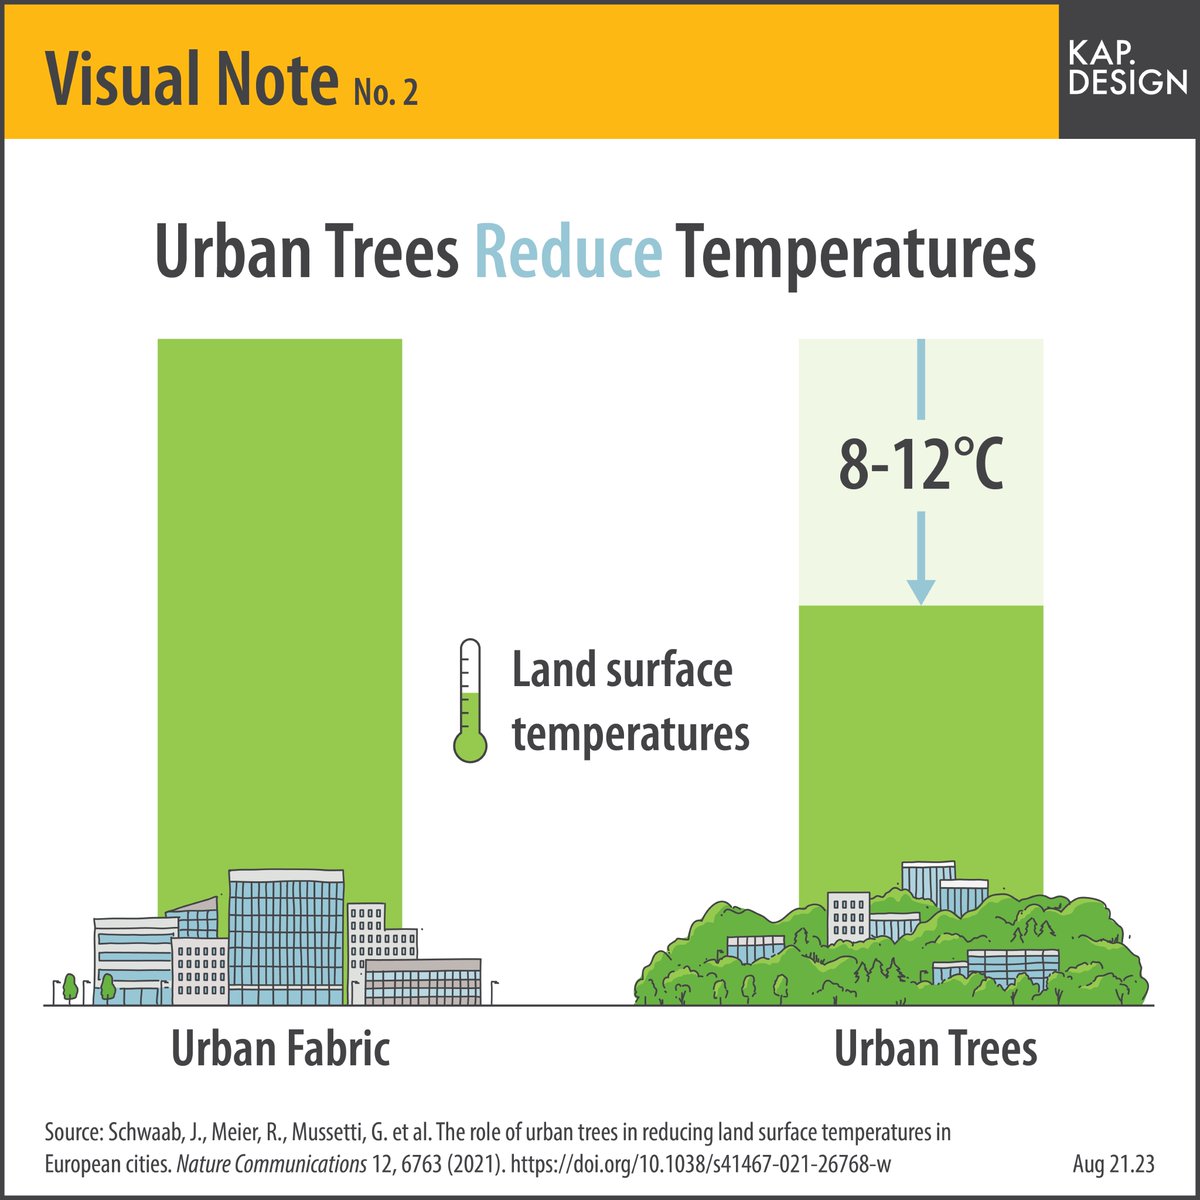
Visual Note 2. Urban trees can reduce temperatures in addition to many other benefits - clean the air, maintain biodiversity, control water. #infographic #heatwave #climatesolutions
101
10 Aug 2023
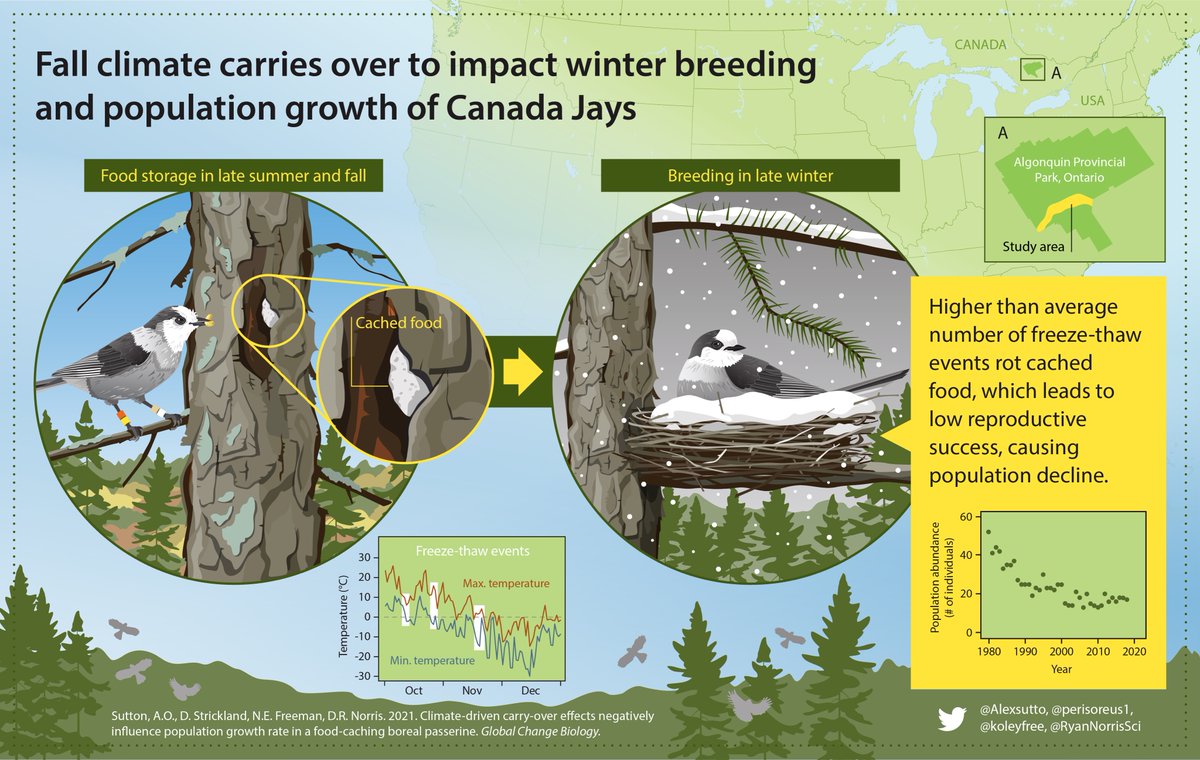
This is the fifth and final bird research #infographic in our series. Another collaboration with @RyanNorrisSci, this infographic visualizes research into population growth of Canada Jays.#scicomm #visualabstract #ornithology
3
7
469