
Teaches economics and investing at Stanford GSB. Special sits HF mgr. gsb.stanford.edu/faculty-res… || Not Financial Advice
Joined January 2018
- Tweets 4,503
- Following 55
- Followers 29,061
- Likes 1,724
482 Photos and videos


Kevin Mak retweeted

May 6
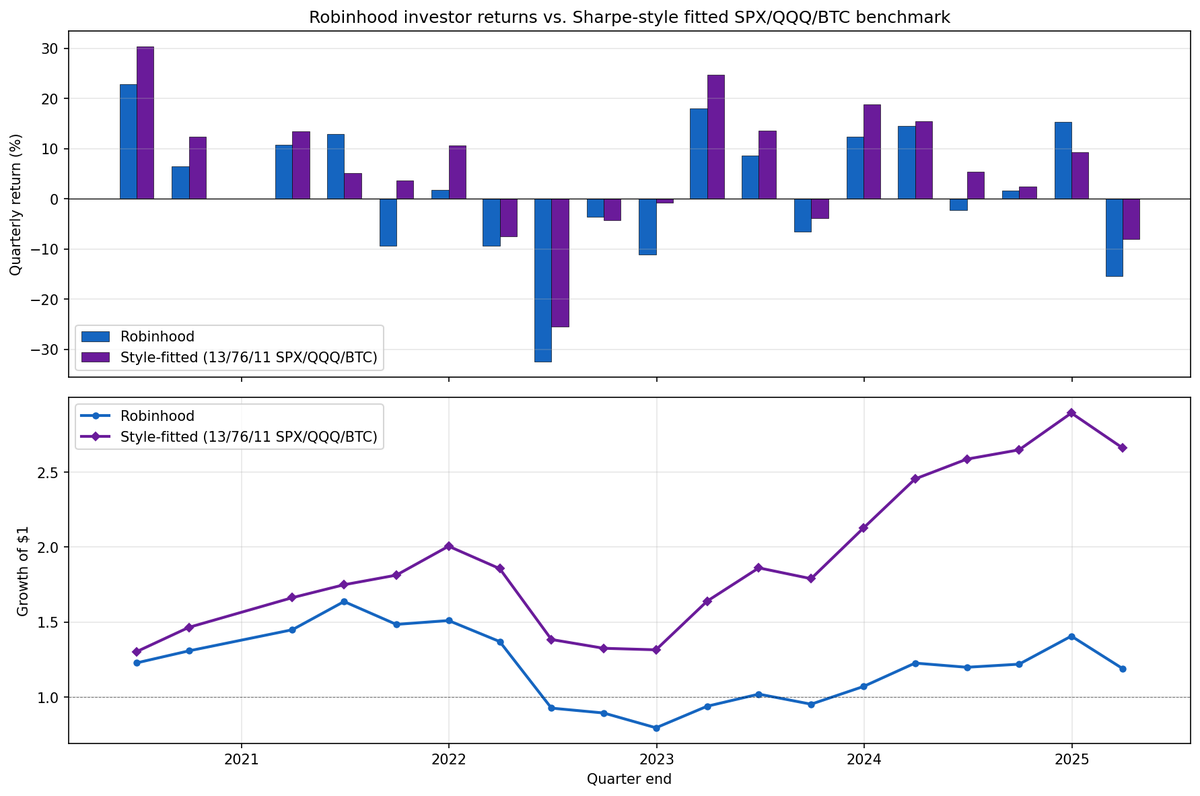
How do Robinhood investors do in aggregate? Not very well. They manufactured more than 15% in negative alpha per annum between 2020 and 2025 for more sophisticated investors to harvest. Plot below of aggregate Robinhood returns against a 13/76/11 SPX/QQQ/BTC fitted benchmark.
The real cost of access to zero-commission platforms for retail investors is perhaps best understood as a behavioral one. These investors can’t help themselves, trade way too much and don’t seem to have market timing ability. Maybe they’re just having a bit of fun but this seems like an expensive pastime.
thetwocents.substack.com/p/m…
4
25
138
24,530

Apr 24
This is the most practically useful application of defi/crypto I’ve ever seen.
Apr 23

in the future, casinos won't make money
a single (huge) crowdfunded pool will power millions of near-fair bets across apps and AI agents
all house profits will flow back to everyone's buy-ins automatically
providing the best yield in the world to its owners
testnet now live
4
4
48
30,505
Apr 24
A quick one on a name I don't hold and am not looking at: I don't understand the obsession with the recent short-squeeze/corner on the car rental company. I think the ownership dynamics made it kinda cute, but from a market perspective it seemed not terribly spectacular.
A big part of it is just optics: a $100 stock going to $700 sounds enormous. But $1 stocks go to $7 on a weekly basis with comparable or higher trading volume and get no coverage. This is a recurring behavioral quirk with stock prices that shows up in lots of contexts.
My guess is very few short funds felt real pain here. Short books are much smaller in the post-GME world. Being short at 50bps into a 7x run is anxiety-inducing, but it's a different universe from 100-200bps GME shorts watching 10-20x runs.
The tells: borrow rate barely flinched (~10%, nowhere near the 300% HTB levels that cause actual squeeze pain), and Markit's real-time short interest rose through the move rather than falling, suggesting shorts were net adding, not getting blown out. If the data's accurate, that's the opposite of a squeeze signature where the shorts capitulate at the top.
Maybe this saga isn't over so writing this is too early.
Disclosure: No position.
7
97
21,609
Apr 24
I've received a handful of "where'd you go" DMs. I'm still around and lurking, and I have a lot to say....
But sadly I've got to update a bunch of compliance disclosures and stuff before I can resume posting in any detail about individual securities. Hopefully be back in the next week or two.
27
1
304
29,078
Mar 30
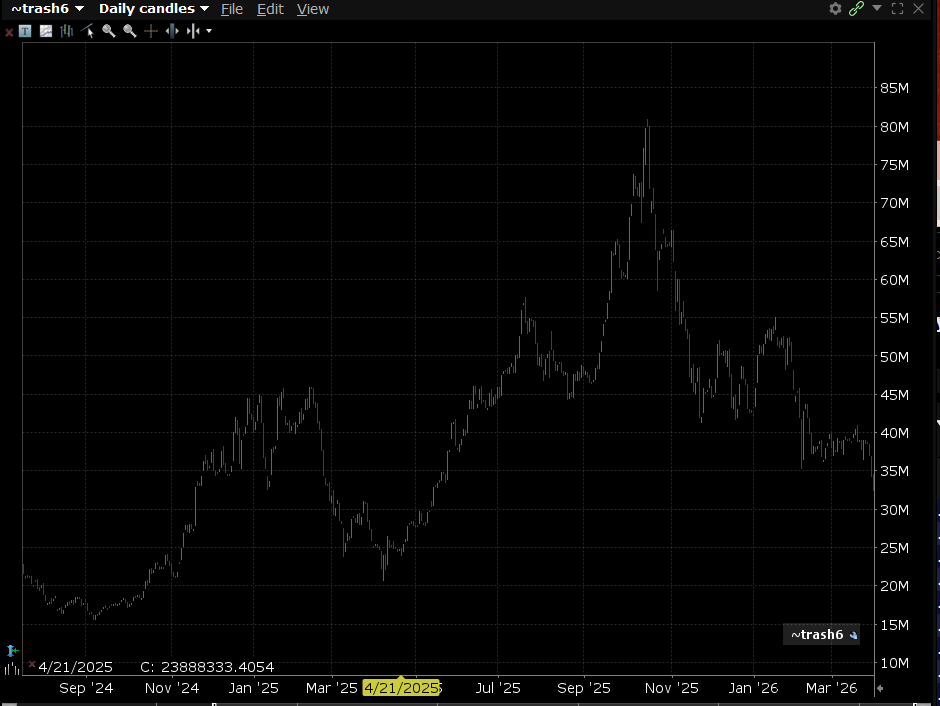
Updating this chart through today. The Y-axis is rescaled and a couple tickers got ----Q'd, but the composition is ~90% the same.
What stands out: the index is basically back to where it was in May 2025, despite being up ~50% from April 2025 lows. In other words, if you bought and held the basket of “hyped, low/no earnings story stocks” through the full cycle, you’re roughly flat.
But that likely overstates the experience of the typical participant.
In practice, people size up as they win and trade more actively as volatility increases. A $10 → $30 → $20 path is not a “ 100%” outcome for most traders. By the time it’s back to $20, many are already flat or down once you account for sizing, turnover, and options usage.
Layer on the fact that taxes on 2025 gains are coming due shortly for U.S. investors, and there’s a real possibility that a large share of participants who showed peak gains of 50–300% last year are currently underwater on a net basis.
21 Oct 2025

Fun trade/portfolio management thing. Over the past 10 days I've put on a $10M short position in a basket of "trash".
My view is that this current run is finally over and I'm willing to call, at least a local if not more enduring, top on it.
Note that the Beta of my portfolio is usually around 1, so this short position really just puts me slightly more defensive versus being outright short the market. Beta drops to around 0.8ish with this.
If the market rallies another 5-10% into year end, I'll make less. If it falls 5-10%, I'll still lose money, but it'll sting a little less.
I'm not talking about the composition of the basket (about 15 names), but you all know roughly the types of companies in there. Also not going over why I think we've topped since it's all very hand waivey. I will provide an update in a few weeks to see where this is at.
Overall I think of it as a 55/45 bet on /- $4M, that happens to also reduce my exposure/risk in the market.

9
3
74
32,084
Mar 17
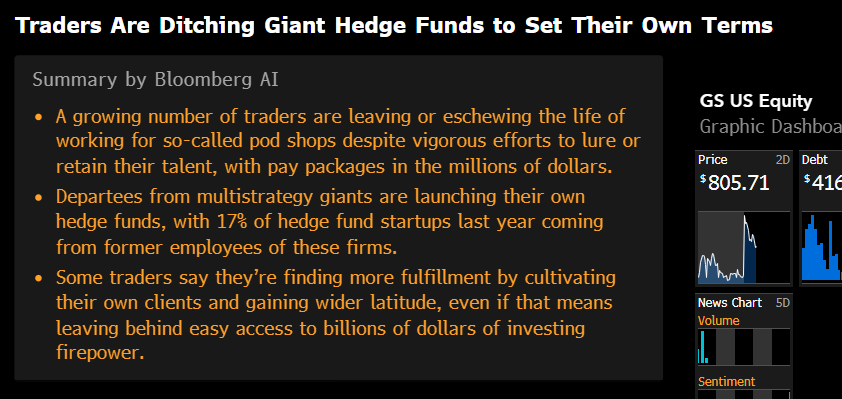
Just 6 months ago the dominant narrative was that Single Manager life was dead and Pods were the only option. This article suggests things are starting to move in the other direction?
15
3
106
22,824
Mar 4
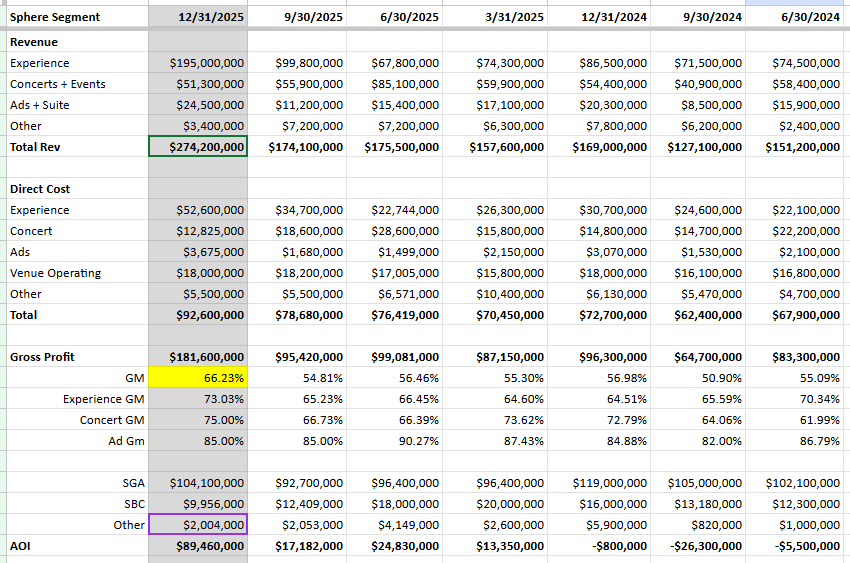
$SPHR
Bloomberg article about Nashville Location being considered. Stock 4% in reaction.
IMO nothingburger/priced in, they're actively having conversations with 10 cities, finding out Nashville is one of those 10 doesn't change anything.
If it was a signed contract, that would be a different story.
From a visibility perspective, this helps convince more people on the sidelines that multi-expansion Sphere is really happening. So it helps the market price get "closer to" fair value, without actually changing fair value.
6
58
16,461
Mar 3
$ASTS
Consistent with my ongoing analysis, I've reduced my weight in ASTS from 3% to about 1.6%.
The operational challenges with scaling satellite production appears to be more significant than I previously expected, and I will want to see meaningful progress on that front before getting more bullish.
Either they're running into a plethora problems that they didn't anticipate, OR they're running into problems that they did anticipate and just choose to downplay it for the past 18 months. Realistically the answer is likely a little bit of both.
At the end of the day, their number one job is to build and launch birds. Yes there are launch partner delays but it's the building/assembly part that's the current bottleneck. There's a real scenario that they don't have 60 birds in orbit until late 2027. I don't know what the % chance of that is, but it's not zero, and I definitely would have had said zero last year.
The issue is the current ACTUAL (not guided) pacing provides zero data for an outsider to extrapolate from. And their previous guidance has been extremely wrong, so it's really hard to say "this time their guidance will be correct."
I'm becoming more confident about my previous comments about this turning into an S-tier meme stock. The product seems to be more about the stock price and promises made by the company than actual operations. This is an asset to the company (and shareholders) as the volatility is dampened if bad news occurs. It ends well as long as they manage to eventually reach their goal.
I still think the company gets the full constellation up, and significant revenues are likely to follow, but I want to see more metal in orbit, or a far lower stock price before I can be more constructive on the valuation being appealing.
x.com/KevinLMak/status/19737…
2 Oct 2025
Here’s a thought experiment to further accentuate my post. Imagine you fast forward 5 months from now, it’s March 2026, they haven’t launched anything, and they reiterate “we’re going to launch 40 birds in the next 8-12 months”. The stock price is $115. Would it be a better or worse investment than today?
That’s similar to trying to compare today to 5 months ago.
86
9
246
88,620
Mar 1
Binary week for $QURE. And everyone ‘knows’ what’s coming.
Lots of people on fintwit saying "it's obviously going to go in X (or Y) direction."
My contribution is that the only thing that's obvious is that it's entirely NOT obvious which way this will fall, but I guarantee after the fact one camp will parade the obviousness of their insight.
Markets don’t reward certainty. They reward correct pricing of uncertainty.
I have a ~1% long position in QURE. If I'm right, I'm not a genius, if I'm wrong, I'm not an idiot. I’m underwriting a distribution of outcomes, and we'll see a draw from some real distribution. Whether they match or not comes down to variance in a single random draw. Nothing more.
Over a career, these compound into alpha. Or they compound into unemployment.
9
7
198
30,420
Mar 1
> Markets don’t reward certainty.
(Except polymarket and Kalshi.. ObViOuSlY).
1
19
8,948
Mar 1
Seeing some of these "AI supply chain bottleneck" plays in the past 6 months working out has me a little confused. Isn't this super table-stakes for the buy-side and sell-side to get right and capture? Have your 10 expert-network/industry people (or army of interns using an LLM) to put together the full map of all the pieces, figure out the sensitivities and go?
Seeing the "surprise" in the markets is very surprising to me. These types of "follow the supply chain" trades have been around for decades. I guess I give others too much credit?
(I'm totally out of the loop in this area as I've spent very little/no time chasing AI as I figured it was too crowded/resourced for me to be competitive. Kinda looks like I was wrong about that?)
The alternate possibility is that these aren't really constrained suppliers, just the retail/momo narrative is that they are, and many/most just come back to earth after the momentum seekers have their fun.
19
4
130
26,386
Feb 24
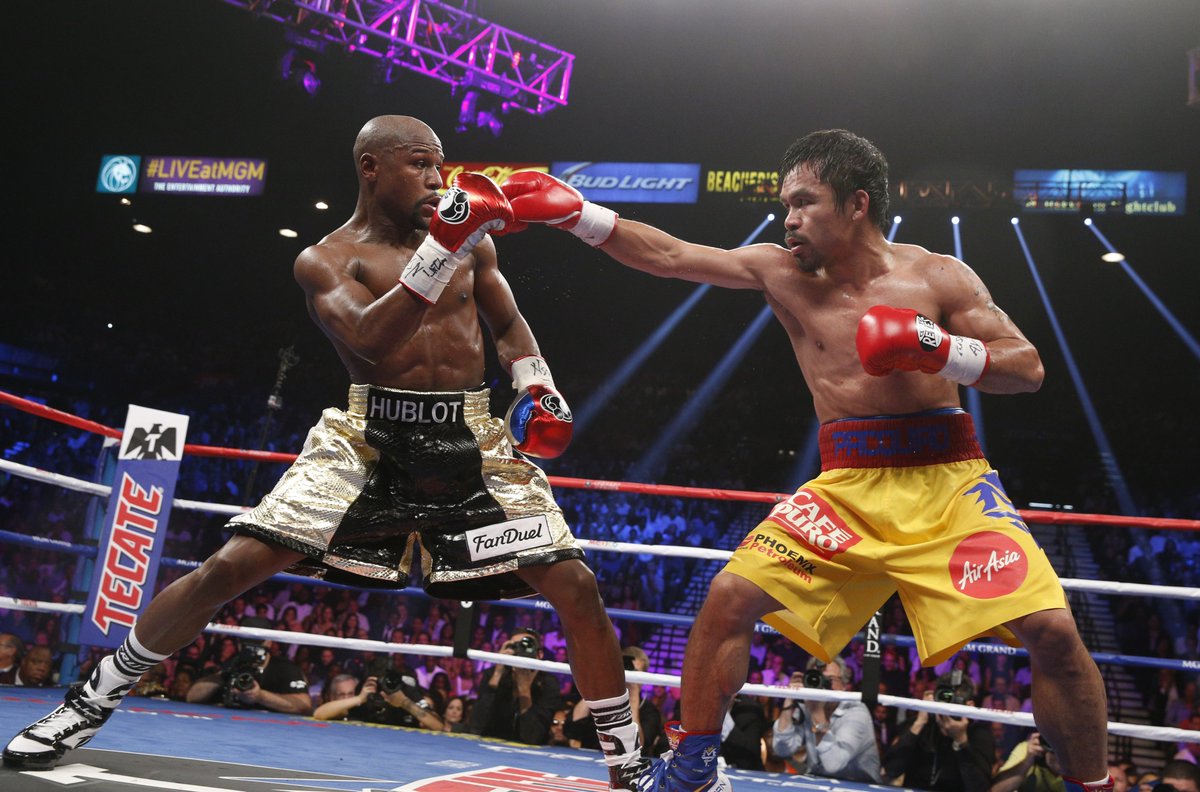
The last time these two had a match in Vegas, it reportedly did $70m in ticket sales at the MGM Arena…
For context, UFC306 did about $20m at Sphere, and a typical sold out concert is about $6m.
I wonder if this fight is gonna do those kind of crazy $50m-$70m numbers….??
boxinginsider.com/history/bi…
Feb 23

BREAKING: MAYWEATHER VS. PACQUIAO II ANNOUNCED🥊
Floyd Mayweather Jr. vs. Manny Pacquiao II is expected to take place in September at the Las Vegas Sphere 🔥
(via @ringmagazine, @MikeCoppinger)
11
36
24,572

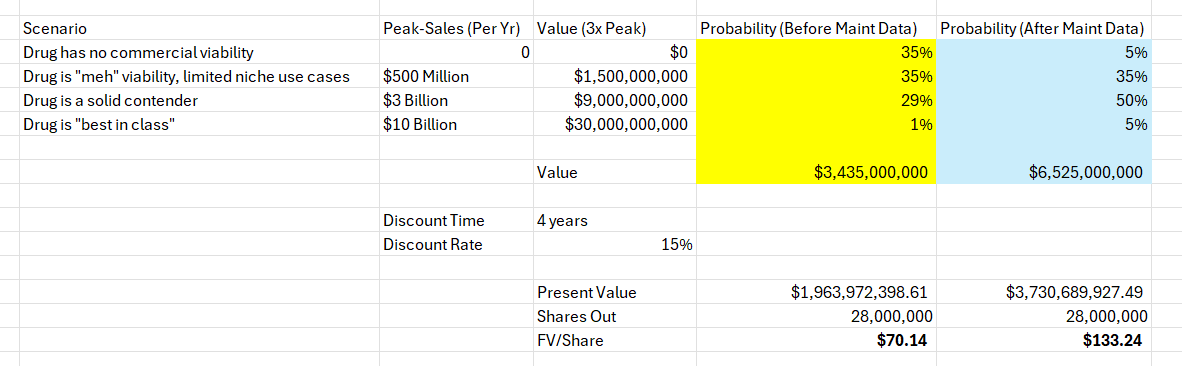
Ok, so I have finally gotten around to writing out my updated thoughts/thesis on $NKTR. Link in this post.
I'm about as bullish on the stock now as I've ever been.
The document is very long (sorry, but it's free...give me a break). I understand that most people won't read it all.
So, if you're only going to read portions of it, don't miss the alopecia areata section. The market has marked this opportunity to zero and I am telling you...the market is wrong to do that. IMO this is a BIG opportunity for $NKTR, no matter how badly the market reacted to the recent data. Yes, IMO the market is getting the atopic dermatitis opportunity and valuation very wrong too, but some people are catching onto that by now...the AA opportunity is just totally (and wrongfully) abandoned.
I also think the portion discussing "remittive" data after the AA section is also informative, and it speaks to a potentially massive upside catalyst that nobody is appropriately considering the magnitude of if it hits. Potentially paradigm shifting for one of the largest (if not the largest) indications in all of I&I...very big deal.
I often write out long threads with slides and data accompanying my write up. I don't have the time to do that now, but please engage here with thoughts, questions, screenshots from the document, etc. Show me what parts of the thesis interest/excite you, what you don't understand, or even what you think is BS or stupid.
It would be great to get some good discourse going on this opportunity, which I have to say I remain very excited about. (Obvious disclaimer here as in the document, yes, I am long and thus biased.)
The link below is to the google doc. Totally free. No subscription, no email address, nothing...just a click on a link.
docs.google.com/document/d/1…
60
48
606
90,270
Feb 19
New milestone, my first 13F filing!
sec.gov/Archives/edgar/data/…
Reminder that 13F's tell a very incomplete story about a fund's entire book. It excludes short positions (stocks and written options), as well as various other securities.
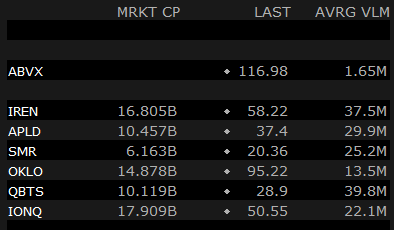
I run both a fundamental book and a quant/arb/short book. So a lot of the stuff you see in the list, is likely half of an "arb" type of trade. The stuff I write about on Twitter is typically my highest conviction positions in my fundamental book. (SPHR, ASTS, ABVX, EVLV, CORZ, etc.)
45
6
395
70,317
Feb 19
Also note my book has a 500% monthly turnover so, things can change dramatically from quarter end to when this gets posted.
29
8,951
Feb 17
Great article by my colleague @HannoLustig
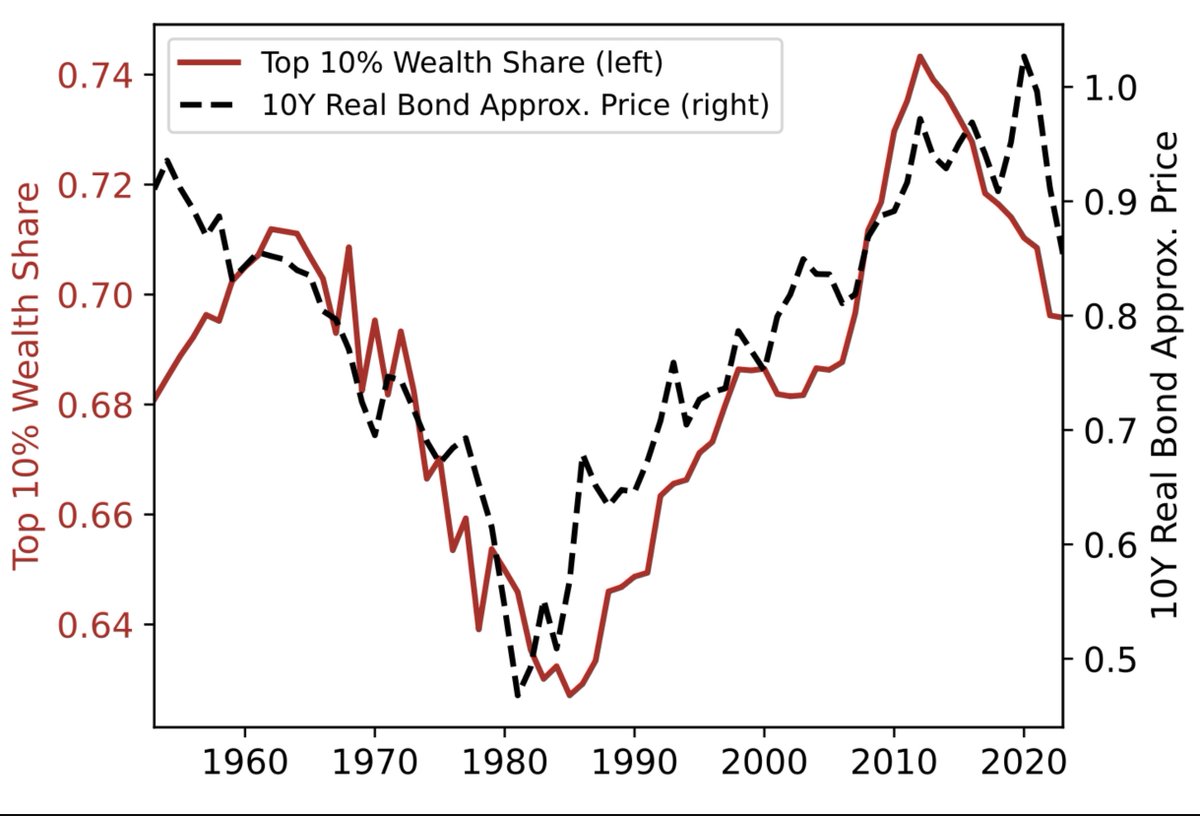
Feb 17

Real rates declined in the US for 4 decades between the 1980s and the early 2020s. When real rates go down, the share of financial wealth owned by the top 10% wealthiest Americans increases. The new wealth that’s created when real rates go down mostly ends up in the portfolios of the 10% because they allocate a larger share of their portfolio to long-lived assets like stocks and private businesses. These assets are more sensitive to real rate changes. The bottom 90% owns assets like deposits and cars that are less rate sensitive. In other words, the top 10% have more duration in their portfolio then the bottom 90%. When rates go up, as in recent years, the reverse happens.
Who gained and who lost as a result of the secular decline in real rates between 1980 and 2020? Young and poor US households were worse off when rates declined because they had “too little” duration in their portfolios and their capital gains were too small. So they had to cut back on consumption after the rate declines. Older and wealthy US households were better off because they had “too much” duration.
The young had to buy assets, like stocks and houses, at higher prices as a result of the decline in rates. Older households on the other hand were selling assets at higher prices to fund their retirement.
Check out my post on our The Two Cents blog.
Who Gains and Who Loses when Rates Change? open.substack.com/pub/thetwo…
1
25
17,932

