
187 Photos and videos


Pinned Tweet

May 31
$NBIS is truly one of the most compelling companies in the market today. This article was written to display the facts that my conviction is built upon.
Hope everybody enjoys, learns something, and can strengthen their own conviction.
Feedback is welcomed.

4
5
101
17,353
12h
I would leave the country.

BREAKING:
The Netherlands just told its citizens to go to hell.
36% tax on unrealized gains. Approved.
You didn't sell anything.
You didn't make a single euro in cash.
Your portfolio went up on paper.
The government sends you a bill anyway.
61,000 citizens petitioned against it.
Parliament approved it anyway.
No cash to pay the tax? Not their problem.
Asset crashes after you paid? Not their problem.
This is not tax policy.
This is the government treating your paper gains as their income. Before you've made a single euro.
The most talented Dutch investors are already leaving.
Capital goes where it is treated best.
2028 is coming.
Plan accordingly.


64
kizzy retweeted

Jun 12
Andrew Tate speaks on Elon Musk becoming the worlds first trillionaire
491
1,431
12,144
1,344,672


Jun 10
Man I should have collected that salary 😂
Jun 3
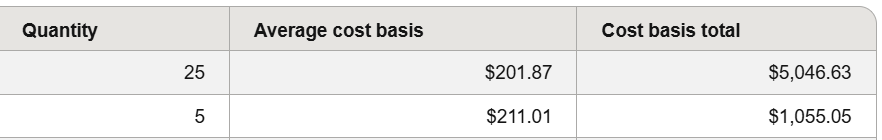
I could sell $400 Jan 2027 CCs against my $NBIS position, collect a salary, and still leave 60% upside room for the year yet I refuse to cap this baby.
2
4
555
kizzy retweeted

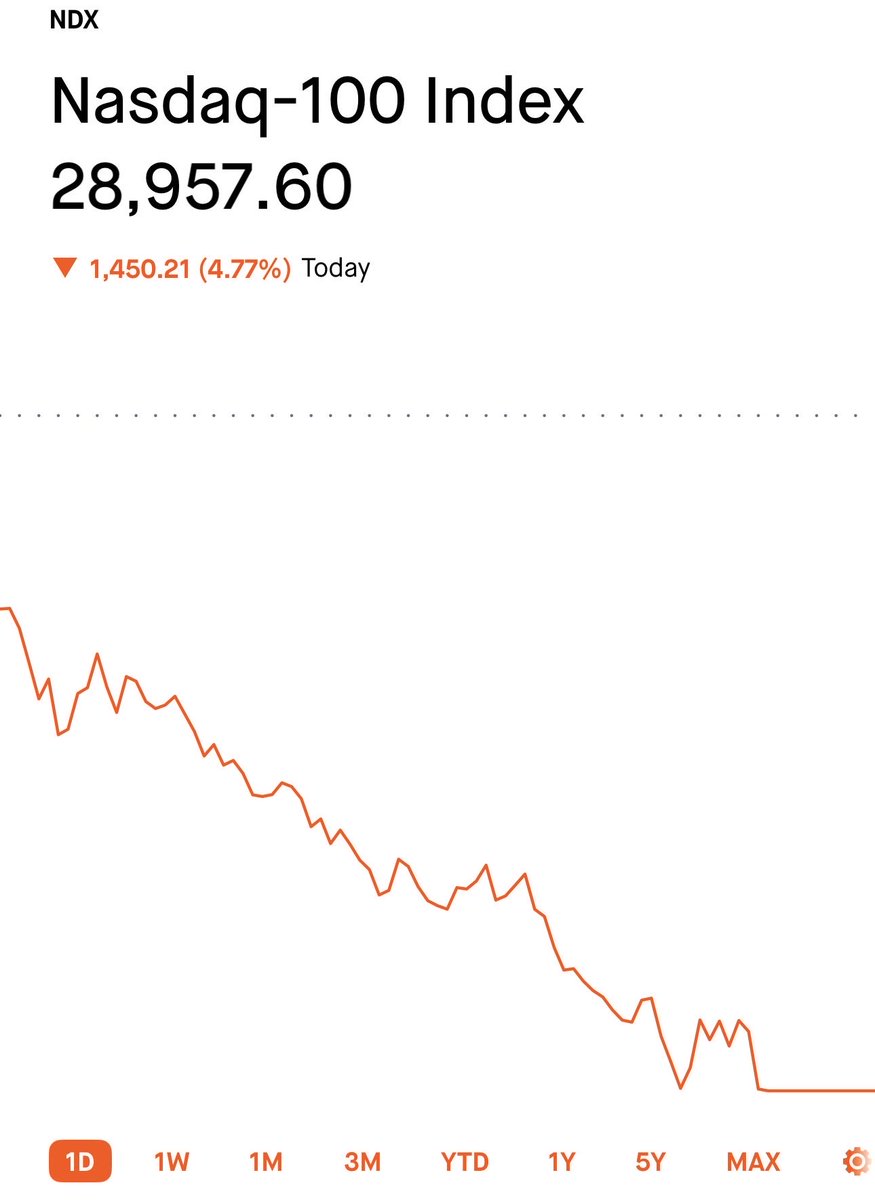
I knew the stock market would finally crash. This is why I’ve been in cash since 2005
270
335
7,660
528,623
Jun 10
RT @dannycheng2022: My Investment Philosophy: Big Names, Disciplined Allocation, and Long-Term Conviction (May 29, 2026)
My core investmen…
9
Jun 10
I was a big $OSCR bull last year having a couple thousand shares at $16~
Messed around with day trading losing ~60k, fucked around with leverage, then the markets took a shit. It was overwhelming.
Ended up trimming positions and selling my entire Oscar position. Now the stock is sitting at $28.5.
Buying great companies and holding long term is the real way to build wealth.
Extremely grateful to have learned my lesson when I did and I hope this post can help others on their investing journey.
Stay focused on the long term.
2
7
365
kizzy retweeted

Jun 9
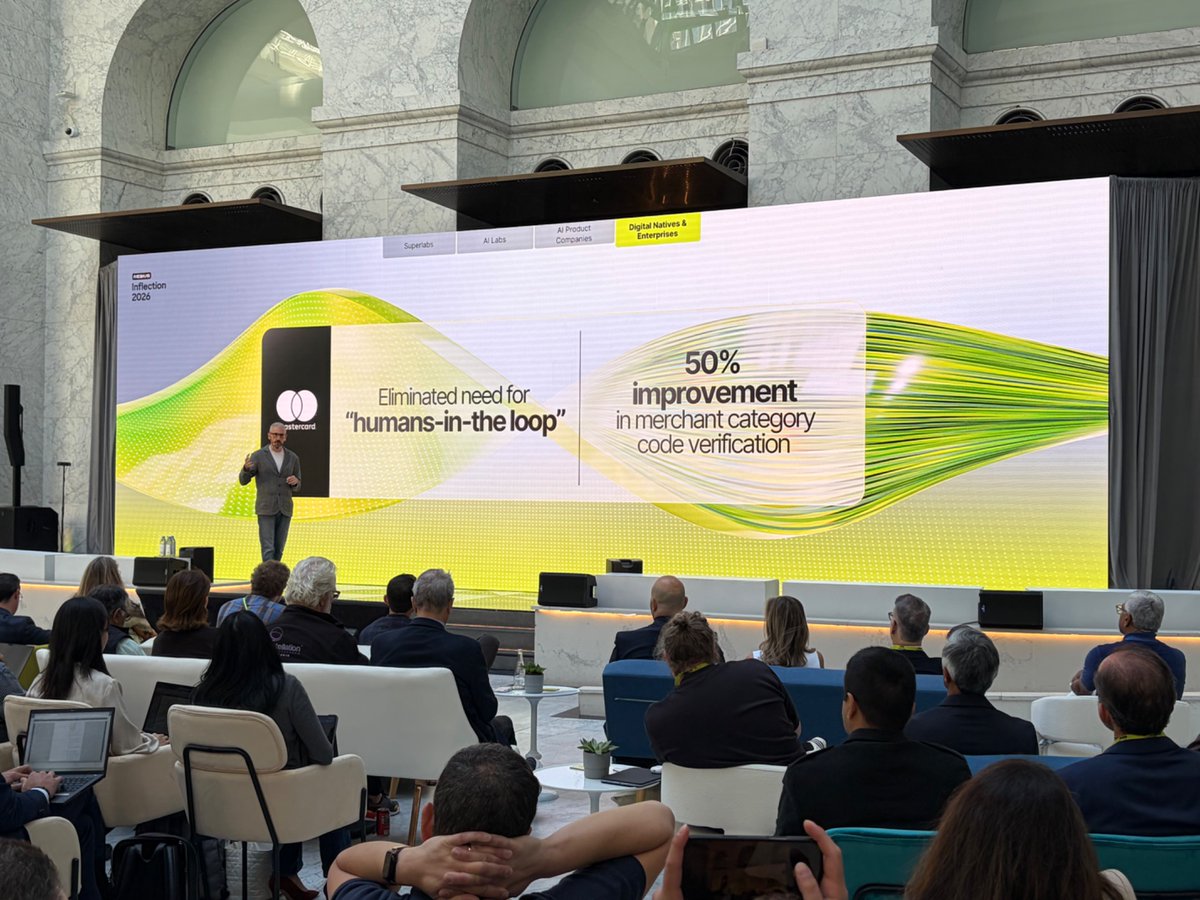
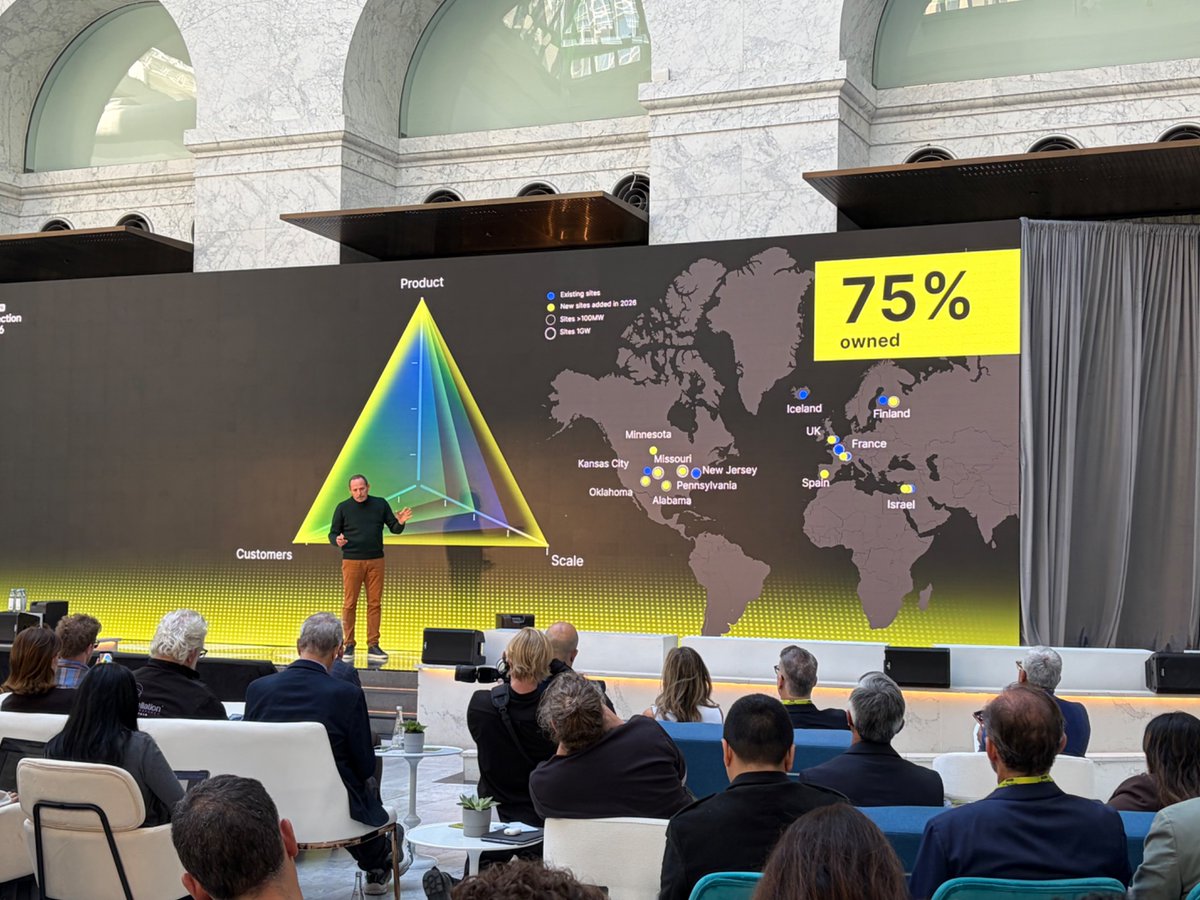
A few shots from Roman and Arkady’s keynotes at Nebius Inflection 2026.


6
22
184
30,645
Jun 9
Every company or industry I look into, I always just find myself back at $NBIS.
It really is the best R:R over the next five years. I will continue accumulating.
6
3
84
4,159
Jun 8
$NBIS - Please do not blindly enter an investment without truly understanding what you own. This past week probably shook out a lot of weak hands.
Zoom out. Corrections and consolidations are healthy for strong uptrends.
Building models is a great way to keep your eye on the prize long term. This projection from @InvestNorthwise lays out the numbers well.
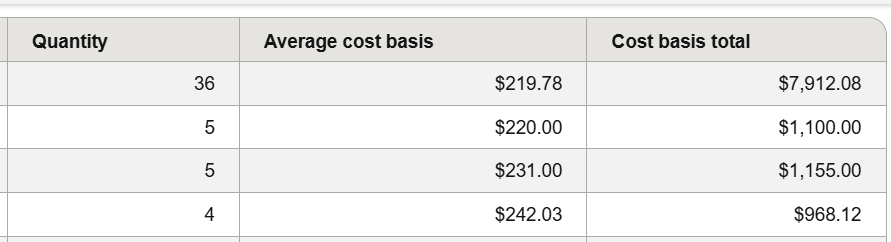
I continue adding to my position.

In February, we released our first full $NBIS model to X with and set a staggering $1,250 end of 2029 price target ($644 present value @ 18% discount rate) for our premium members.
We have decided to open our full model for free this week. (link in first comment)
Although all of our reports are free for readers, our price targets, portfolio allocations, present value calculations, and buy/hold/trim/sell zones are generally gated.
Before we release our new $NBIS model next week, we have decided to open up our most popular model to date for everyone on the X community who has supported our work on $NBIS and many other names in AI infra.
We appreciated you and hope you gain something on the way we think, what we got right, and more importantly what we got wrong.
It's not easy to set a target so high with confidence when Nebius was trading under 100 a share at the time, but it's much easier when you put in the work, do the research, and actually base price targets on real numbers.
The original report was published when most public analysis still treated Nebius as a GPU rental business.
Our report instead modeled the company around power availability, connected MW, ARR per MW, utilization, customer funding, enterprise mix, and dilution.
Several parts of that framework were correct.
We correctly identified Nebius as a vertically integrated AI infrastructure platform rather than a simple reseller of GPU capacity.
We correctly identified power and energization as the primary operating constraints.
We correctly modeled revenue as a function of connected and monetized MW rather than applying a simple revenue growth rate.
We correctly treated hyperscaler contracts as both revenue sources and financing instruments.
We correctly identified customer prepayments, deferred revenue, operating cash flow, secured financing, and asset-backed financing as central components of the capital stack.
We correctly identified Aether and the broader software layer as important to utilization, orchestration, customer integration, and long-term margin quality.
We correctly expected enterprise, AI-native, and inference workloads to become more important over time.
We correctly argued that equity outcomes would differ significantly across AI infrastructure companies depending on power control, capital structure, dilution, depreciation, and software integration.
We were materially above most public and Wall Street valuation estimates. Our original public model included:
Bear case: $752
Base case: $1246
Bull case: $1760
Those estimates were based on long-term infrastructure throughput and earnings power rather than near-term revenue alone.
Several assumptions now appear too conservative.
ARR per MW may be ramping faster than we expected.
The original model assumed ARR per MW would increase gradually as rack density improved, utilization rose, and enterprise and inference mix expanded.
Our modeled midpoint assumptions were:
2026: $9M per MW
2027: $11M per MW
2028: $13M per MW
2029: $15M per MW
The current revenue and ARR trajectory suggests the starting point and slope may both need to move higher.
Contracted power has expanded faster than expected.
The original report assumed more than 3GW of contracted power by the end of 2026.
The disclosed pipeline has since expanded beyond that level, increasing the potential long-term capacity base.
Contracted power is not the same as energized capacity, but it increases the top of the future deployment funnel.
The energization schedule may have been too conservative.
The old model assumed approximately:
2026: 900 connected MW
2027: 1,500 connected MW
2028: 2,000 connected MW
2029: 2,650 connected MW
That schedule already appeared aggressive at publication.
New site announcements, construction progress, and disclosed capacity targets suggest the ramp may occur faster or reach a larger endpoint than our original base case.
Customer funding appears stronger than expected.
The original model assumed that prepayments and contract-related cash flow would fund a meaningful portion of the buildout.
The increase in deferred revenue and operating cash flow suggests that customer commitments may be contributing more funding, and contributing it earlier, than our original assumptions.
We will distinguish carefully between deferred revenue, cash prepayments, working capital movements, and operating cash flow in the update.
Enterprise and AI-native mix may be ahead of our original assumptions.
The old model assumed the following revenue mix:
2026: 85% hyperscaler, 15% cloud and enterprise
2027: 80% hyperscaler, 20% cloud and enterprise
2028: 72% hyperscaler, 28% cloud and enterprise
2029: 65% hyperscaler, 35% cloud and enterprise
Current customer activity and product development suggest enterprise, inference, healthcare, life sciences, and AI-native workloads may be scaling faster than this path assumed.
The capital structure has become more complex.
The old model used scenario-based equity issuance assumptions.
The updated model must now include:
Basic share count
Prefunded warrants
Convertible notes
Potential conversion dilution
Interest expense
Cash raised
Customer funding
Secured financing
Asset-backed financing
The old share-count framework is no longer detailed enough.
CapEx will need to move higher.
The original model used approximately $18B as the midpoint of 2026 CapEx.
A larger contracted power base and faster site development may require higher spending.
Higher CapEx can increase long-term value if the capacity is efficiently funded and monetized. It can also increase execution and financing risk. The update will evaluate both sides.
The original report correctly identified the structure of the opportunity and was materially ahead of the market on valuation.
The new report will update the assumptions where Nebius has moved faster than expected and add greater precision where the original model relied on incomplete information.

1
4
64
10,806
Jun 8
$NBIS - Showing extreme strength technically and fundamentally. Could see some consolidation and a slight correction down to the $200 and $176 levels.
This would be very healthy and allow plenty of time to accumulate more shares before going on the next run.
Could be the last chance to get shares at these prices so be ready. :)
2
1
39
3,468
Jun 6
People want some magic piece of advice or wisdom that will make it all click and change their life financially.
The truth is, building wealth is a process that involves long periods of focus, discipline, and patience.
1
155
Jun 5
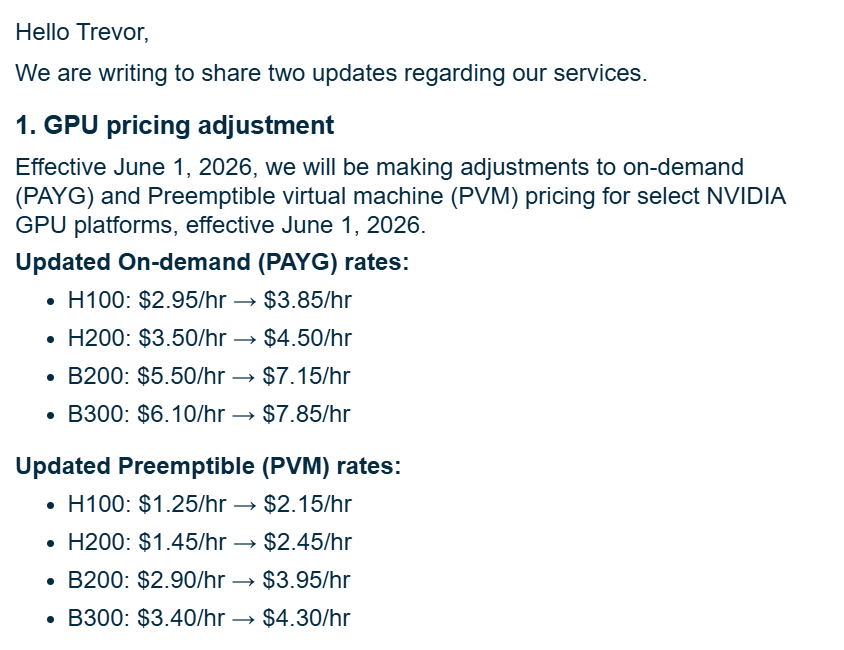
$NBIS - Let's not forget the 30% price increases that were implemented last month after earnings.
Not sure if they planned on this before the call or included it in any guidance, but I am expecting another incredible quarter from the team.
3
3
67
5,550