
Delusional Optimist | Head of Research @Lisk | Data-Driven Insights on Markets, Exponential Technologies and Global Power Shifts 📈🔍
Joined December 2013
- Tweets 12,189
- Following 1,256
- Followers 12,843
- Likes 18,824
2,501 Photos and videos


Pinned Tweet

12 Sep 2023
Stablecoin and Global Liquidity Recovery: The Catalyst for the next Crypto Rally?
What Will You Discover today?
1. Understanding the Significance of Liquidity for Bitcoin and the broader Crypto Market
2. Gearing up for a Stablecoin Liquidity Game-Changer as the Tokenization of U.S. Treasury Bonds accelerates.
Let’s dive in.
1. Why Stablecoin Liquidity and Global Liquidity matter for Bitcoin and the rest of the crypto market
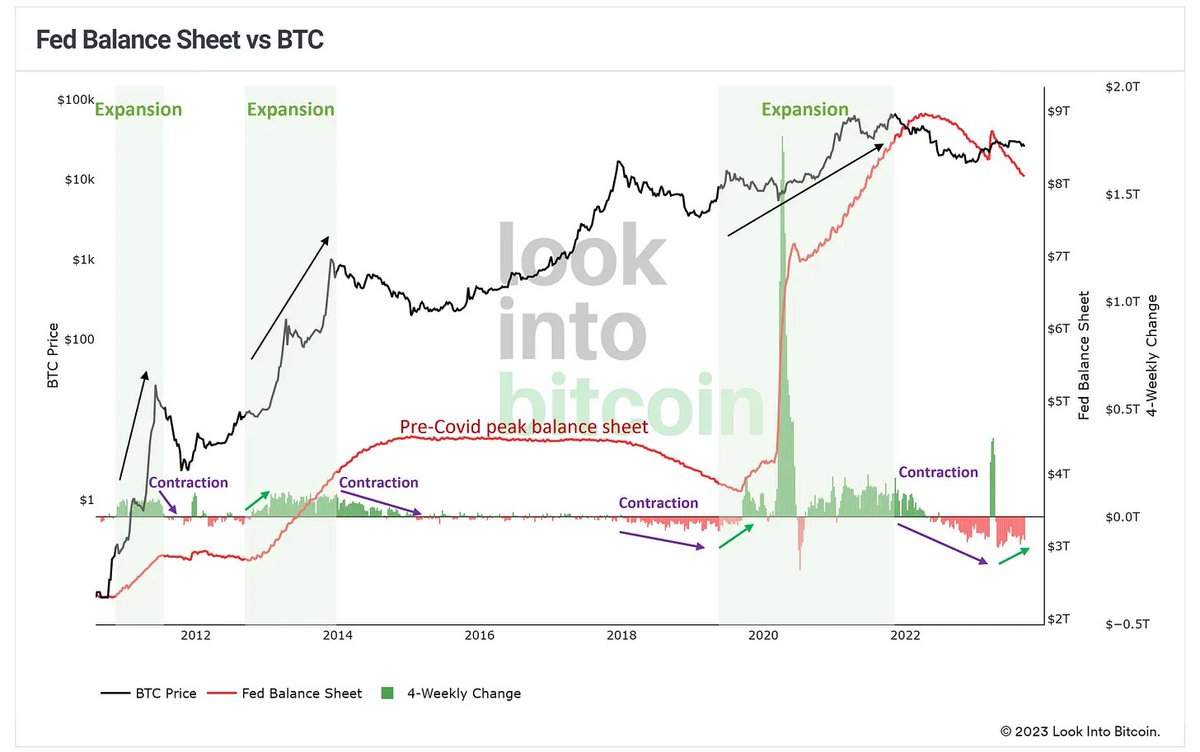
Within both traditional finance and the rapidly evolving world of cryptocurrencies, liquidity plays a pivotal role in ensuring market stability and fostering growth. The chart provided illustrates a compelling correlation: as the Federal Reserve's balance sheet expands, Bitcoin and other cryptocurrencies typically witness a price surge.
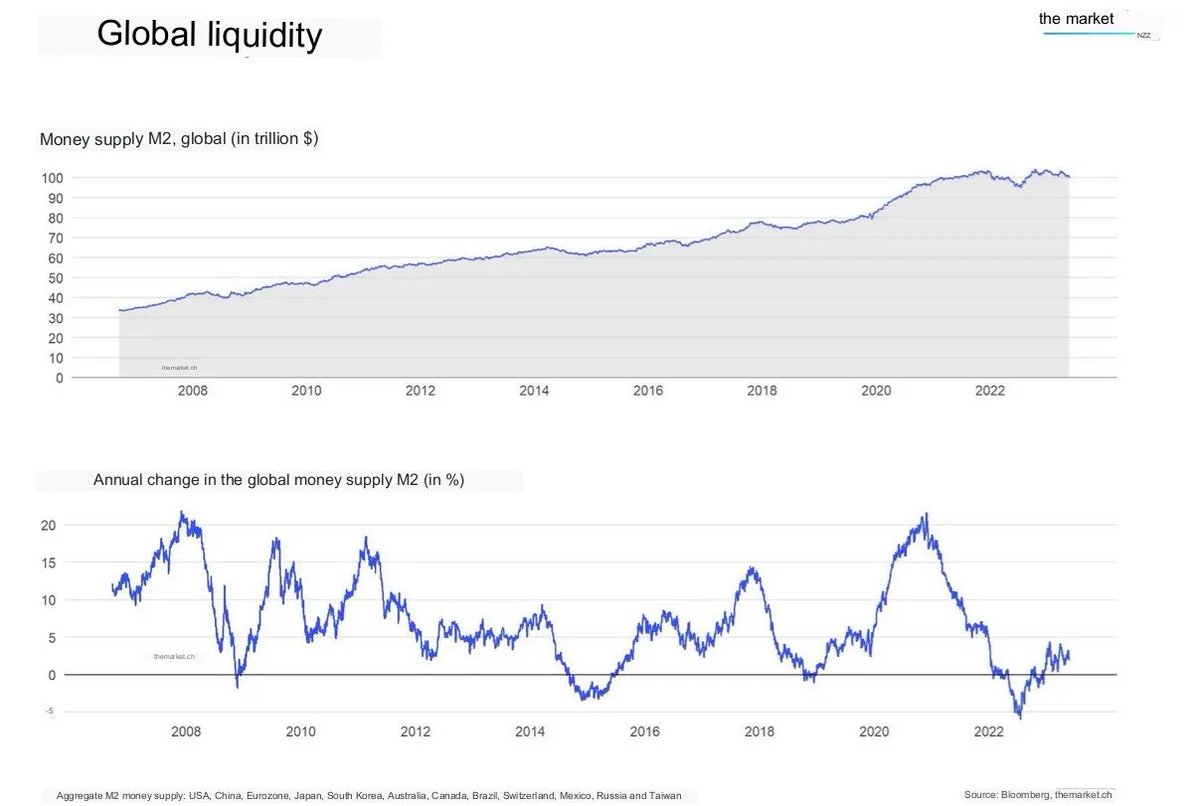
Zooming into today’s global liquidity picture, defined by the M2 metric, that combines all important money supply indicators across the globe, we're seeing a trend tilting towards a decline. This has placed Bitcoin and its crypto contemporaries in a somewhat muted phase.
Diving a bit deeper, a mirroring trend emerges on blockchain networks within the total Stablecoin market cap, or what can be likened to cryptos' "M2" indicator.
Post-April 2022, this Stablecoin metric dipped by a staggering $43 billion and is presently finding its feet just above the $120 billion threshold.
For the crypto giants like Bitcoin and its peers to gain traction again, a rejuvenation of liquidity is non-negotiable. Where do we stand in the current liquidity cycle, and what could potentially drive a resurgence in Stablecoin Liquidity?
Market Momentum Gearing Up for a 2024 Rebound📈
In the midst of prevailing uncertainty, there emerges a beacon of hope. Both the central banks' balance sheets and the Stablecoin market cap are showcasing a diminishing rate of decline. This points towards a potential relaxation in the liquidity crunch, hinting that the worst is behind us. Delving into the global money supply, specifically the M2 metric, we can already notice a positive shift. Globally, the growth rate of the money supply has swung back into positive territory.
In the past, global M2 growth and especially the expansion of the Fed's balance sheet led to a higher Bitcoin price and initiated the next bull market for cryptocurrencies.
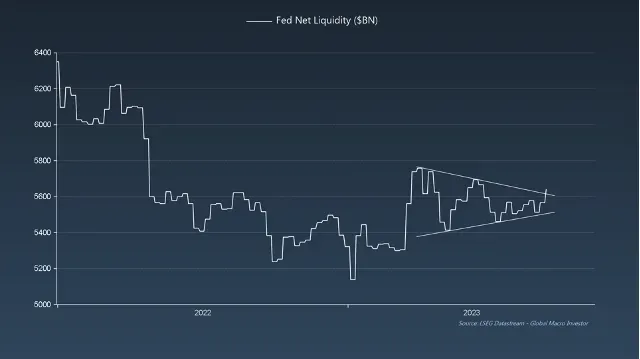
Building upon this, and recent developments in the Fed Net Liquidity, which is calculated as Net Liquidity = Fed Balance Sheet - (TGA Reverse REPO), indicate that more liquidity is flowing into the markets. This influx lays the foundation for potential growth in asset prices soon.
If this positive trajectory maintains its course or even amplifies, several indicators point towards a significant liquidity revival on the horizon for 2024.
2. U.S. Treasury Bonds Tokenization and a new era for Stablecoin Liquidity
Turning our gaze to the cryptocurrency market, we can observe that while the (TVL) in DeFi, including liquid staking, has been fairly steady around the $60 billion mark, there are early signs of a stabilization of the stablecoin market cap. Since April 2022, the stablecoin market cap declined by -26%, but this decline seems to come to an end and over the last few weeks the stablecoin market cap has been stabilizing above the $120 billion dollar mark. This could be a signal for a potential revival in on-chain liquidity and a resurgence of investors’ interest.
This development is perhaps primarily driven by the ongoing tokenization of Real-World Assets (RWAs), that are used to back Stablecoins. For example, MakerDAOs DAI has been growing by over $1 billion since May and more and more Real-World Assets (especially U.S. Treasuries) are being used to back the Stablecoin to produce a yield of around 5% each year for everyone, who decides to lock their DAI into the Spark Protocol. The source of the yield can be verified on-chain and is generated by a mix of RWAs, staked Ethereum and other yield bearing assets.
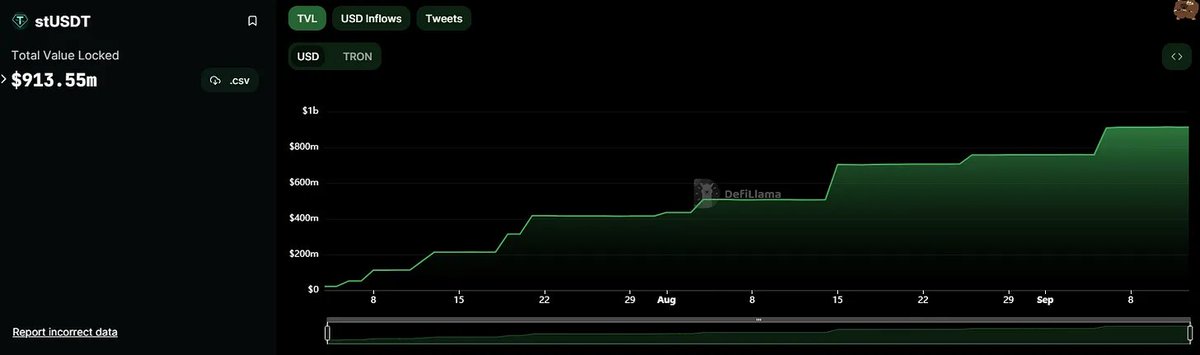
Tether's stUSDT stands out as another prime exemplar—a staked USDT iteration backed by RWAs, such as U.S. Treasuries, boasting an annual yield of around 4%-5%. The stUSDT's market cap has been on an upward trajectory, currently hovering around the $1 billion milestone.
Stablecoin yields seem to finally become competitive again due to more and more RWAs being tokenized on blockchain networks. Examining the overarching RWAs sector, a pronounced surge is palpable, potentially signaling a liquidity reentry into crypto markets.
This burgeoning on-chain evolution could herald the inception of a keenly awaited liquidity influx, essential for a lasting upswing in crypto asset values.
While Bitcoin and Ethereum might witness minor retractions in their valuations, my bullish stance remains unshaken. The wider lens—spanning both traditional finance and on-chain indicators—paints a promising future tableau. From both a traditional and on-chain liquidity perspective, the crypto market's current risk-reward profile is arguably one of the most enticing we've encountered in recent memory.
Remember, clarity and insights are paramount in our rapidly evolving financial landscape. Stay tuned for more in-depth analyses in subsequent publications.
89
24
269
63,937
Leon Waidmann retweeted
Jun 11
Nobody wants to leave Ethereum!💙✊
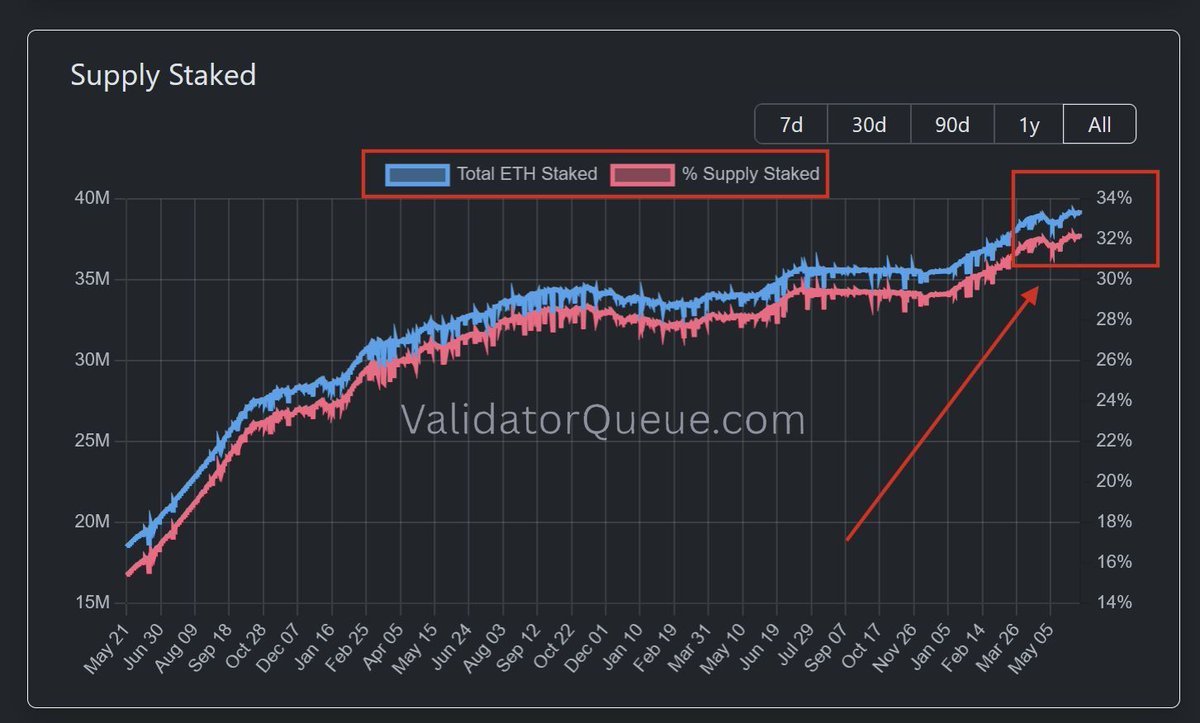
🔹 Staking Rate at all-time high!
🔹 Staking Exit queue at 0!
🔹 Price at Cycle lows!
Hard to find a cleaner bottom signal than this!🚀📈
Jun 11

Nobody wants to leave Ethereum.
It’s worth remembering where the network stood less than a year ago.
On September 13, 2025, the Ethereum validator exit queue reached 2,673,349 ethereum:native, reflecting the largest wave of validators preparing to leave the active set.
Today, that queue has effectively returned to zero. The contrast is truly striking.
Over the past year, Ethereum has navigated volatile markets, shifting narratives, and constant debates about its future. Yet the latest validator queue data suggests that long-term participation in the network remains strong.
For us, this highlights that Ethereum’s strength has never been defined by short-term sentiment. It comes from a globally distributed community that continues to contribute to the network's growth and security.
No amount of FUD can change what we're seeing.
Because while narratives come and go, millions of users around the world continue to believe in somETHing.

11
21
143
7,692
Jun 12
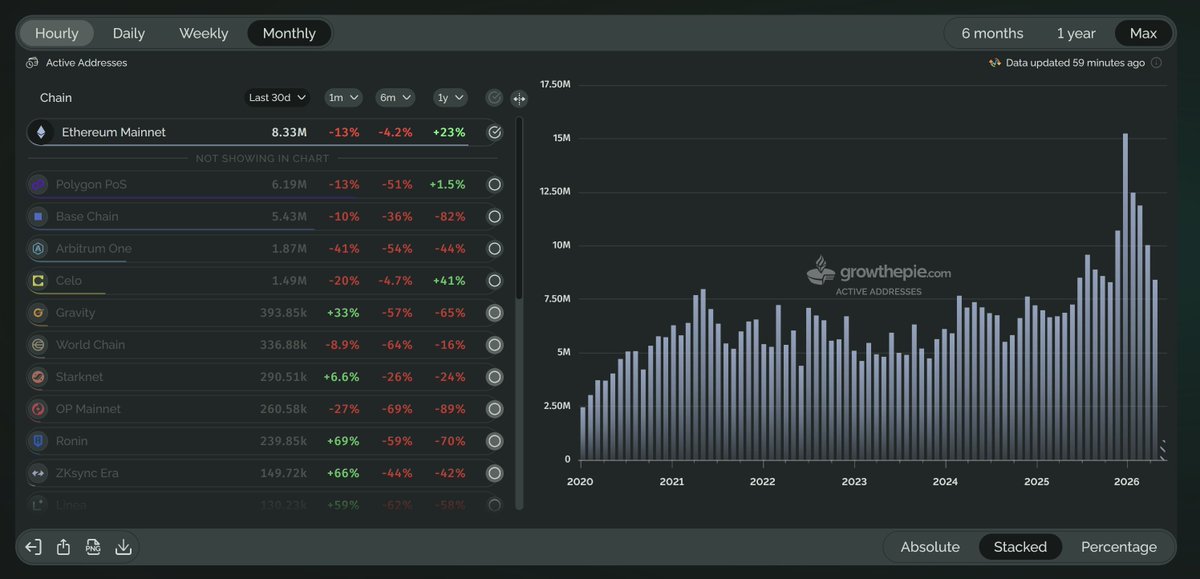
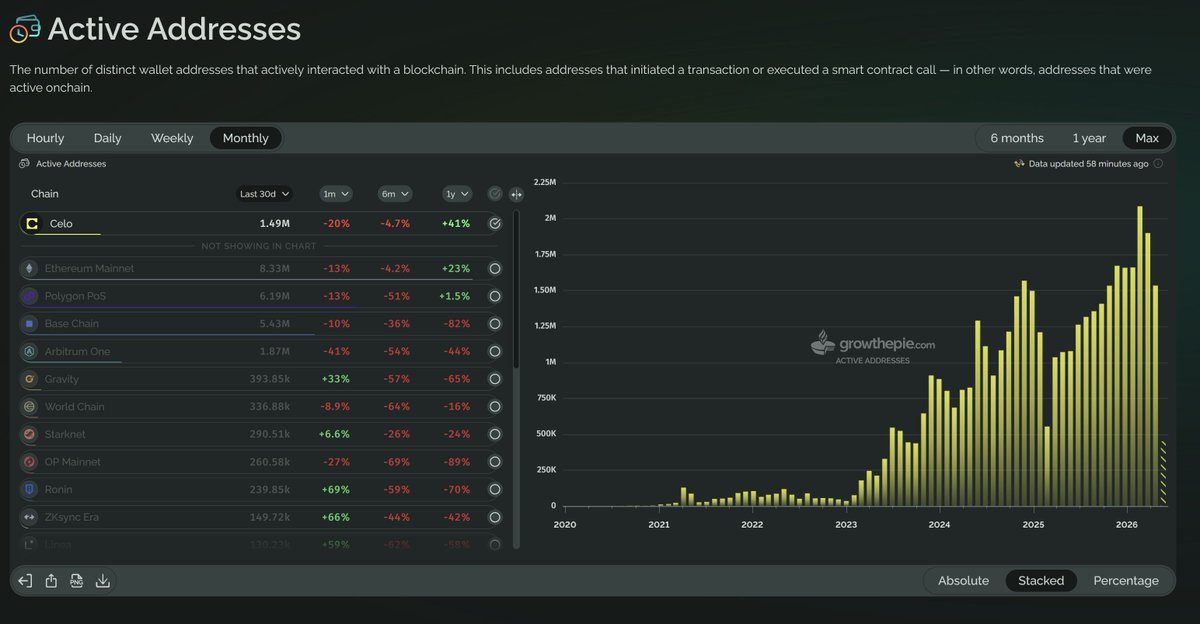
Ethereum mainnet active addresses are up 23% over the past year while almost every L2 collapsed! 📈
Where the major chains stand on 30-day active addresses:
🔹 Ethereum: 8.33M ( 23% YoY)
🔹 Polygon: 6.19M ( 1.5% YoY)
🔹 Base: 5.43M (-82% YoY)
🔹 Arbitrum: 1.87M (-44% YoY)
🔹 OP Mainnet: 260K (-89% YoY)
Activity is flowing back to the base layer.
Cheap fees brought them home.
Data via @growthepie_eth
10
20
141
9,063

No one is leaving.
$ETH
Jun 11

The Ethereum staking exit queue is basically ZERO.
The entry queue is stacked at ~3M ETH. 🔥
Nobody's leaving. Everybody's lining up to get in!
Data via @ValidatorQueue
1
7
1,147
Leon Waidmann retweeted
Jun 10
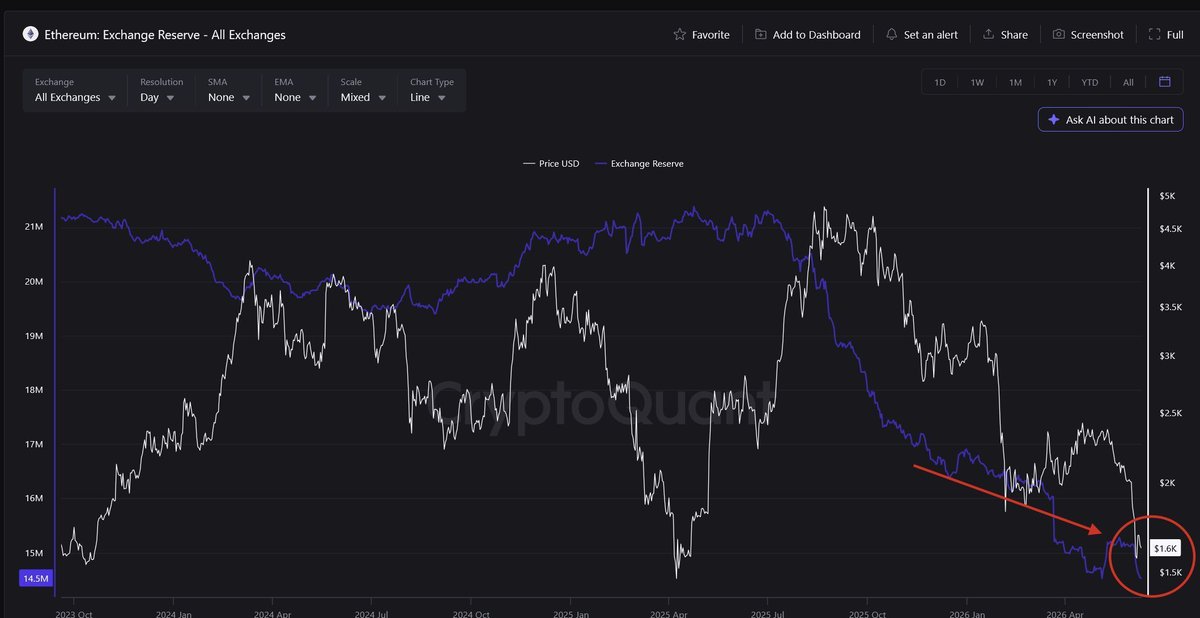
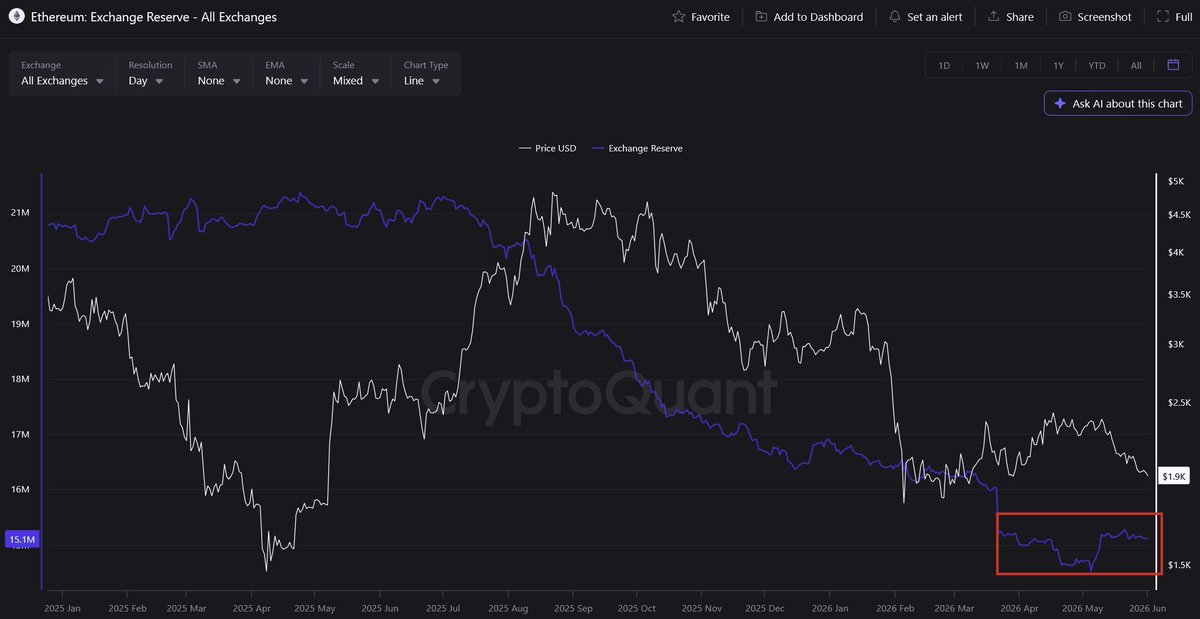
ETH on exchanges just hit 14.5M, the lowest level in history! 📉
🔹 21M ETH (Oct 2023) → 14.5M today
🔹 6M ETH pulled off exchanges in 2.5 years
🔹 Steepest drop came during the crash, not before it
Crashes are supposed to send coins back to exchanges. The opposite happened.
Whoever is buying here isn't selling back!
Data via @cryptoquant_com
20
45
306
28,022
Leon Waidmann retweeted

Jun 10
There are now 315.9M ethereum:native holder, up from 177.7 million in June 2023.
That is 138 million net new wallets holding ethereum:native in three years, across two market cycles.
The curve has not flattened, weekly averages kept climbing through 2024 and into 2026.

11
15
159
5,614
Jun 11
The Ethereum staking exit queue is basically ZERO.
The entry queue is stacked at ~3M ETH. 🔥
Nobody's leaving. Everybody's lining up to get in!
Data via @ValidatorQueue
12
32
244
10,416
Jun 10
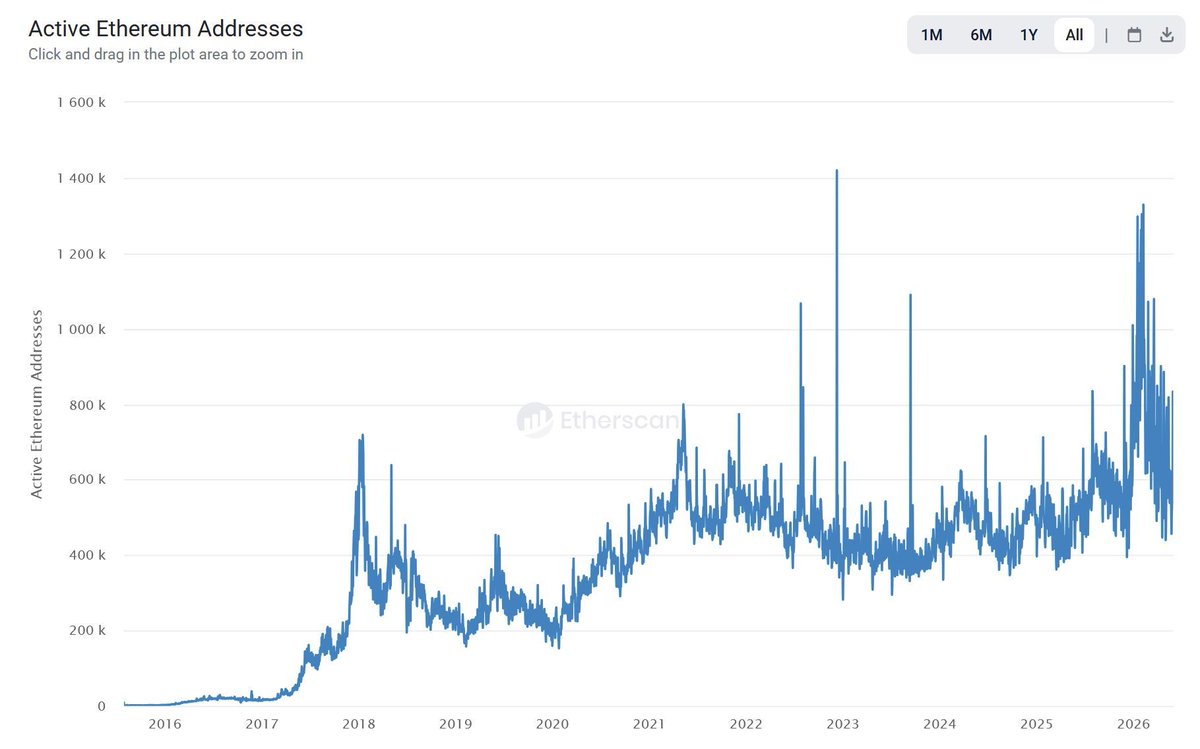
Ethereum network activity is sitting at all-time high levels.
While the price looks dead!
Daily active addresses are hovering near the network's highest range ever.
🔹 2018 peak: ~720K
🔹 2021 bull run: ~800K
🔹 2025-26: regularly pushing past 1M, peaks above 1.3M
The network is doing more real activity now than it did at the top of the last two bull markets.
And price is stuck near $1.9K.
13
30
188
8,819
Leon Waidmann retweeted
Jun 8
Another week.
Another Ethereum staking all-time high! 📈
32.3% of the total ETH supply is now staked.
Nearly 1 in 3 ETH is locked.
While everyone is losing their shit, the people with actual skin in the game keep increasing their commitment to the network.
Despite social media & prices telling you otherwise confidence in Ethereum is not falling.
19
24
155
5,672
Leon Waidmann retweeted
Jun 4
Ethereum has 3.2x more holders than Bitcoin. Not market cap, holders! 📈
Non-empty wallets, ranked:
🔹 1. Ethereum: 189.49M
🔹 2. Bitcoin: 59.08M
🔹 3. Tether: 13.61M
🔹 4. XRP: 7.8M
🔹 5. USDC: 6.76M
Data via @santimentfeed
5
28
98
4,185
Leon Waidmann retweeted
Jun 5
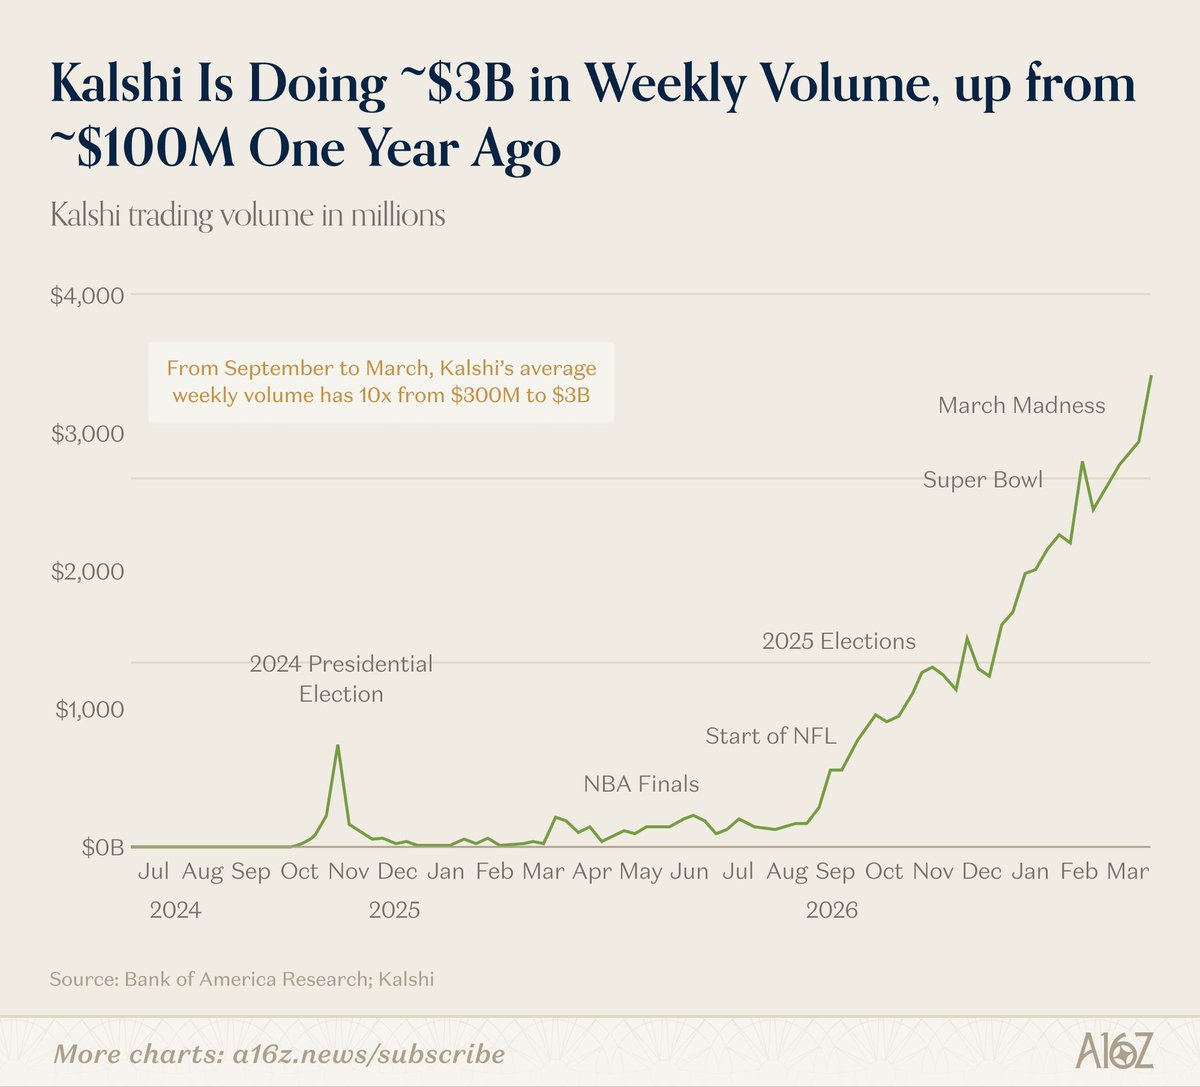
Kalshi did ~$100M in weekly volume a year ago. It just did ~$3B! 📈
From September to March alone, average weekly volume 10x'd, from $300M to $3B.
What's driving it:
🔹 Sports as the mass-market catalyst: NFL kickoff, Super Bowl, March Madness
🔹 The 2024 election spike that put prediction markets on the map
🔹 2025 elections keeping the base elevated
Prediction markets aren't gambling dressed up. They're information machines!
A poll gives you an opinion snapshot. A prediction market gives you a live probability, priced by people with money on the line. Skin in the game makes the forecast honest.
Data via @Kalshi, via Bank of America Research
2
3
7
900
Leon Waidmann retweeted
Jun 4
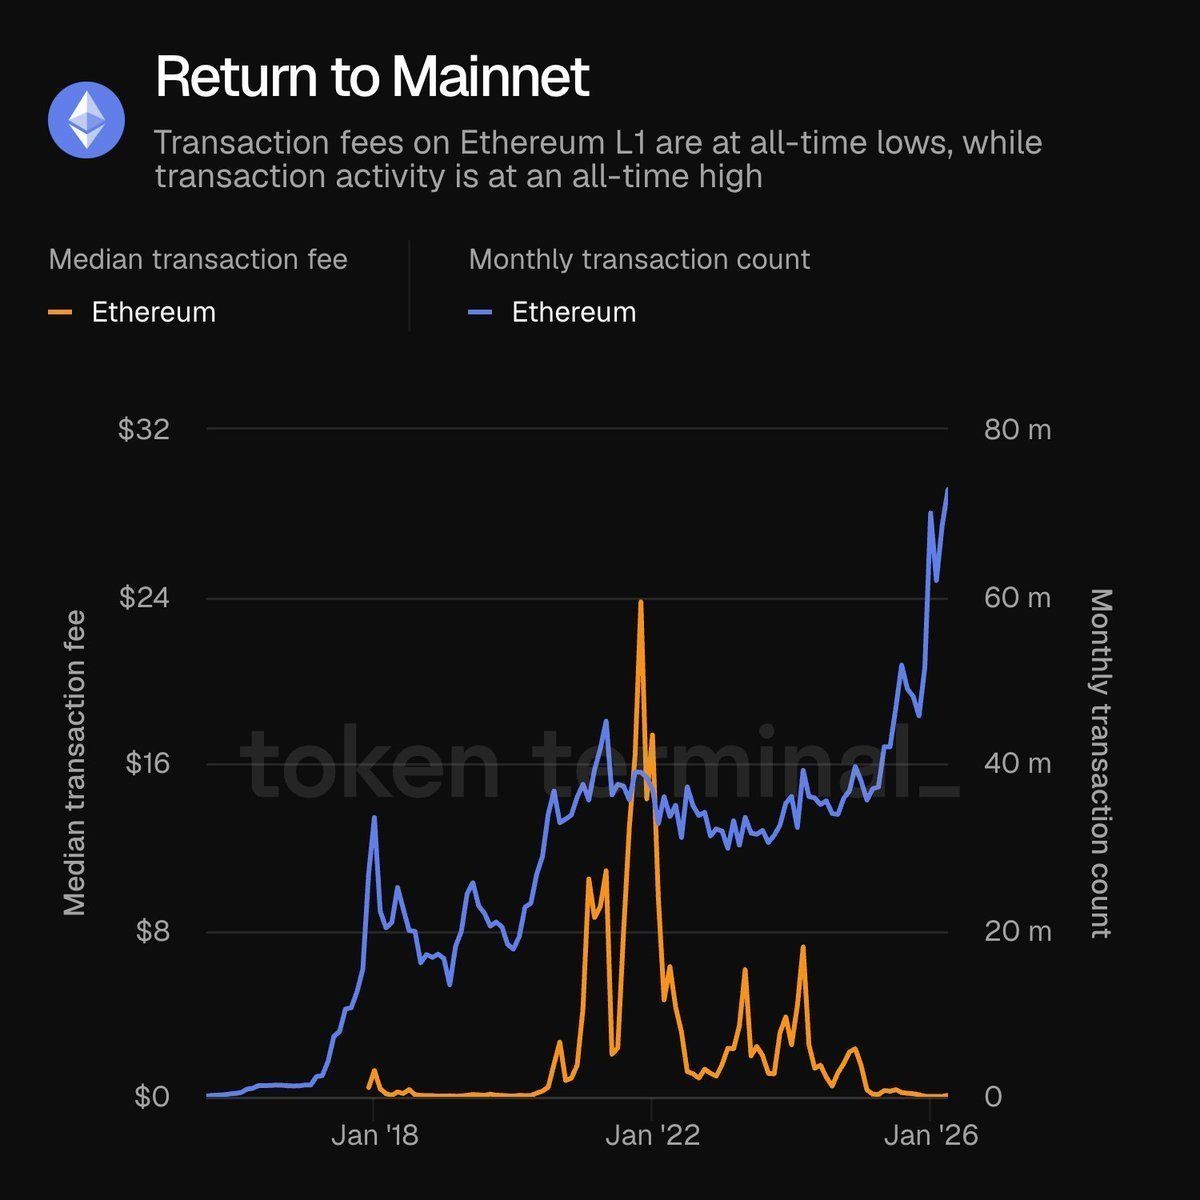
Ethereum is doing record transactions at the lowest fees ever! 🔥
🔹 Transactions: ALL-TIME HIGH (~70M/mo)
🔹 Fees: ALL-TIME LOW (~$0)
🔹 2021 flashback: $24 per click 💀
Mainnet was too expensive. Everyone left.
Now it's basically free, and they're flooding back. ⚡
Cheap blockspace record usage = the foundation stablecoins and other tokenized assets build on.
Data via @tokenterminal
14
31
176
8,341
Leon Waidmann retweeted
Jun 3
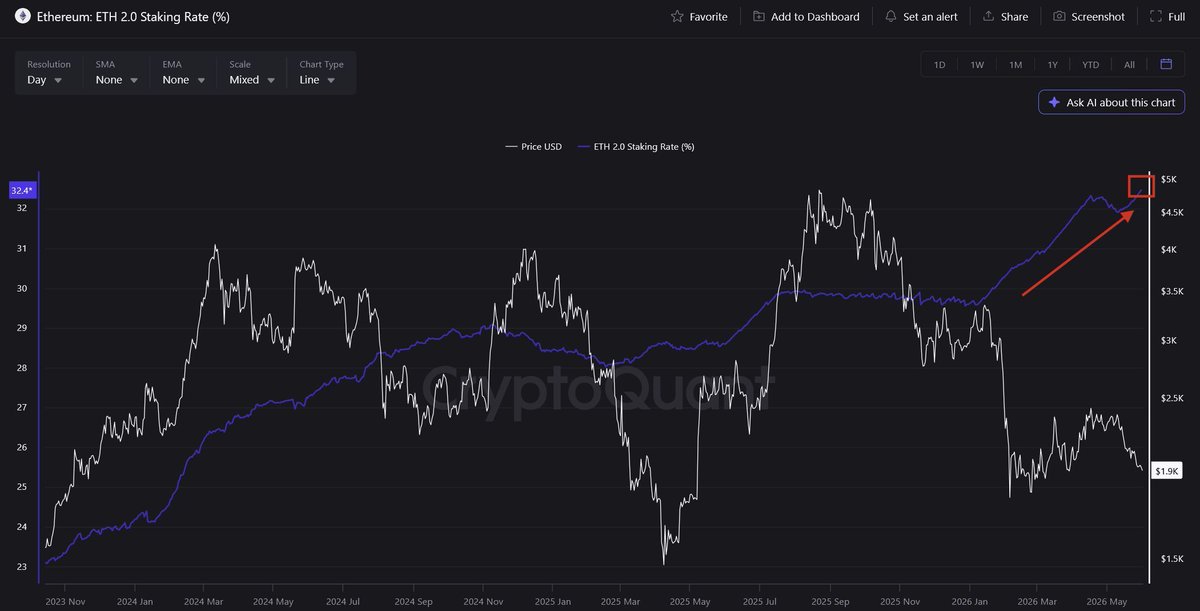
ETH price is stuck near $1.9K. Everyone's bearish.
The onchain data tells the opposite story! 📊
🔹 ETH on exchanges: crashing to ~15.1M (multi-year low)
🔹 Staking rate: fresh ALL-TIME HIGH at 32.42%
🔹 Transactions: ALL-TIME HIGH
Less ETH on exchanges = less supply to sell.
More ETH staked = more supply locked away.
Holders aren't selling. They're accumulating and committing.
Price follows sentiment short term.
Onchain follows behavior.
Right now they point in opposite directions.
Data via @cryptoquant
12
26
193
12,596
Leon Waidmann retweeted
May 29
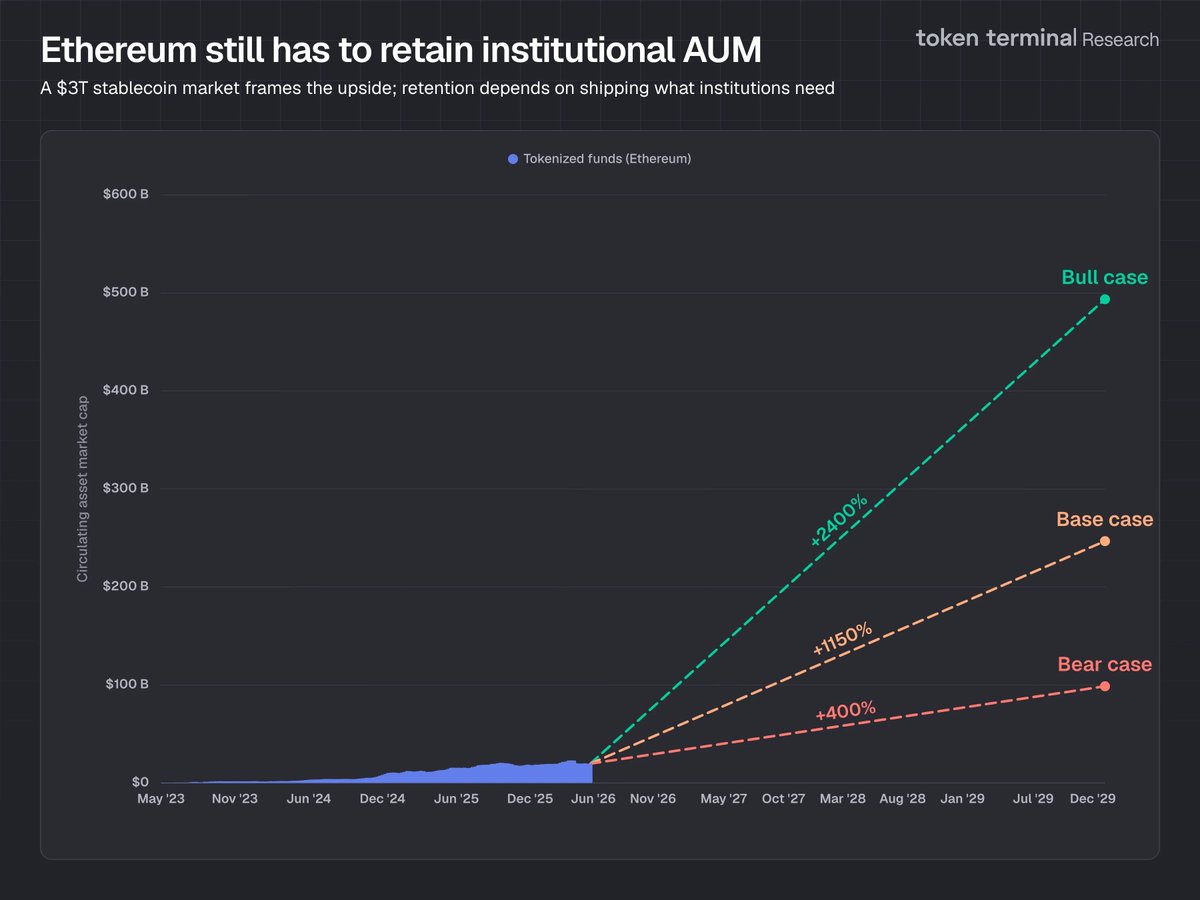
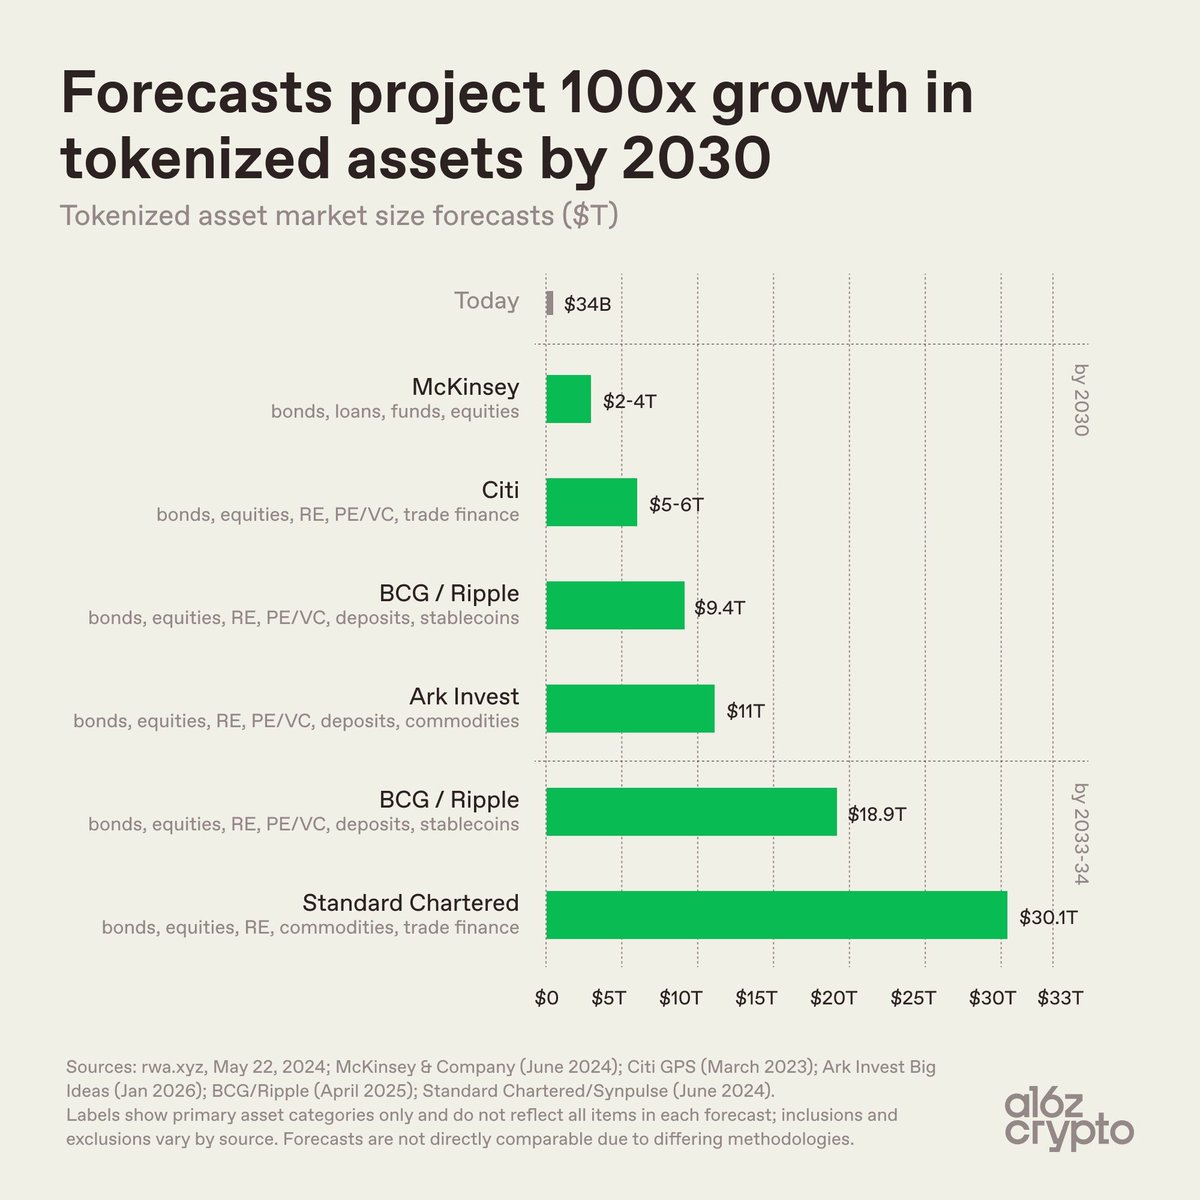
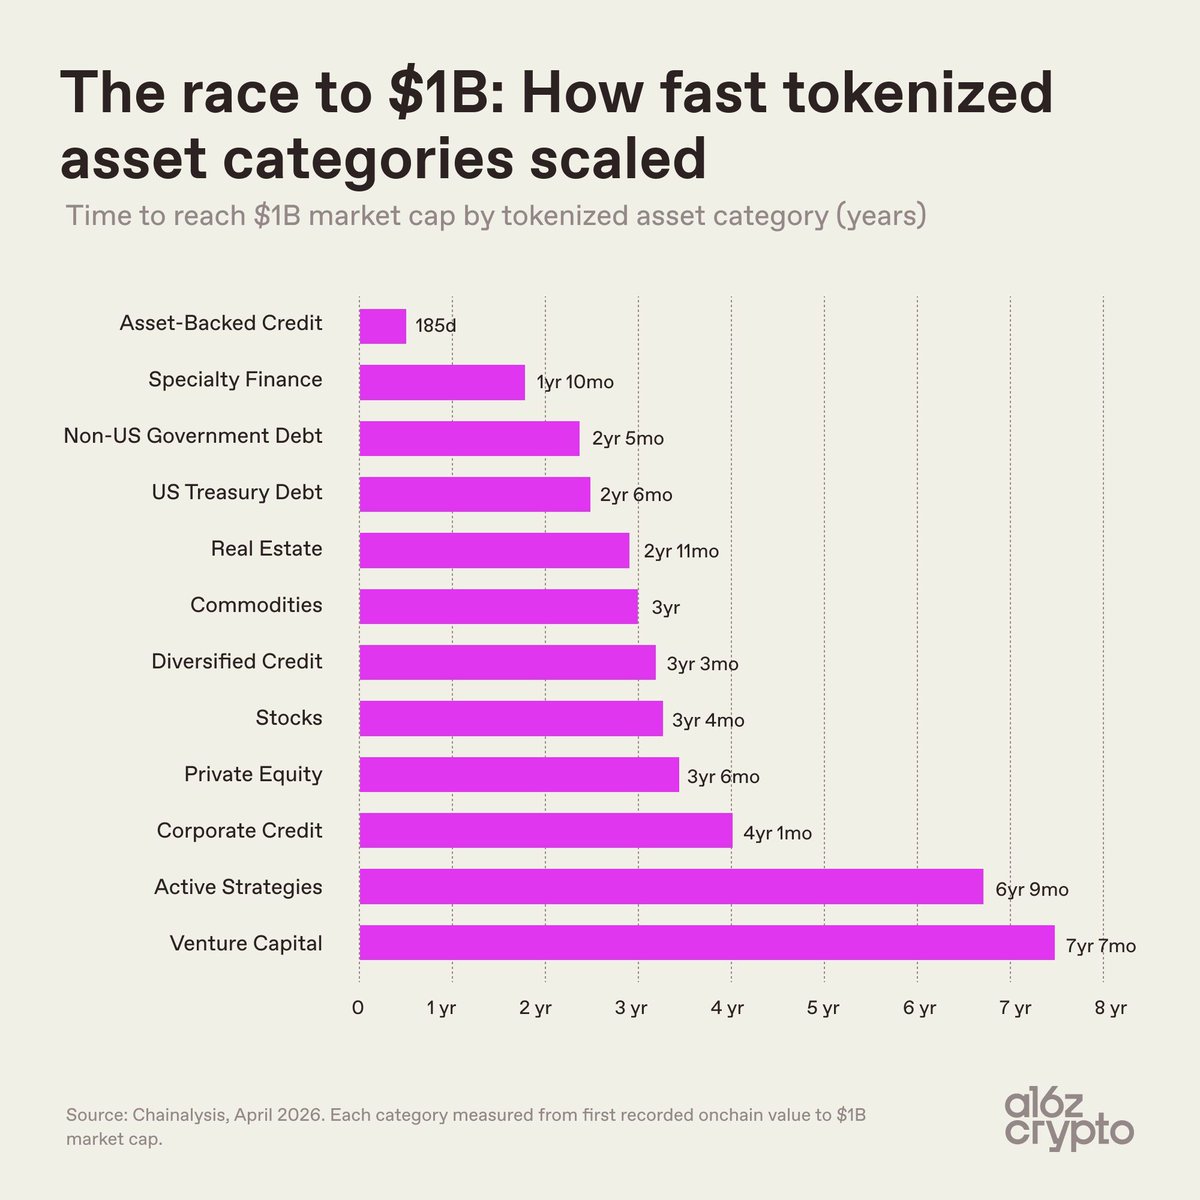
Tokenized assets are already a $34B market.
But the path to $1B looks very different by category.
Fastest to $1B:
🔹 Asset-backed credit: 185 days
🔹 Specialty finance: 1y 10m
🔹 Non-US government debt: 2y 5m
🔹 U.S. Treasury debt: 2y 6m
🔹 Real estate: 2y 11m
🔹 Commodities: 3y
Slowest:
🔹 Active strategies: 6y 9m
🔹 Venture capital: 7y 7m
➡️ The fastest categories are the ones with clear pricing, strong demand, and obvious onchain utility.
10
8
33
1,707
Jun 3
While most L2s are bleeding users, @Celo is up 41% over the past year! 📊
🔹 Celo: 41% 🟢
🔹 Ethereum: 23% 🟢
🔹 Polygon: 1.5%
🔹 Arbitrum: -44% 🔴
🔹 Base: -82% 🔴
🔹 OP Mainnet: -89% 🔴
Almost every chain shed users in the last 365 days.
Only a handful actually grew, and Celo leads them.
One honest note: the last 30 days cooled off (-20%), so the near-term momentum has softened.
But on the annual trend, Celo is firmly pointing up.
Real usage is consolidating onto the chains people actually want to use. 📈
Data via @growthepie_eth
13
10
59
4,605