8/27/13 | Host of @TheFieldPass
Joined June 2011
- Tweets 2,872
- Following 329
- Followers 5,154
- Likes 12,096
74 Photos and videos


Pinned Tweet

4 Sep 2018
@notthefakeSVP thank you again for the feature!! 🙏🏼 I appreciate it more than you know!

6
43
507
Mike Dudek retweeted

Apr 16
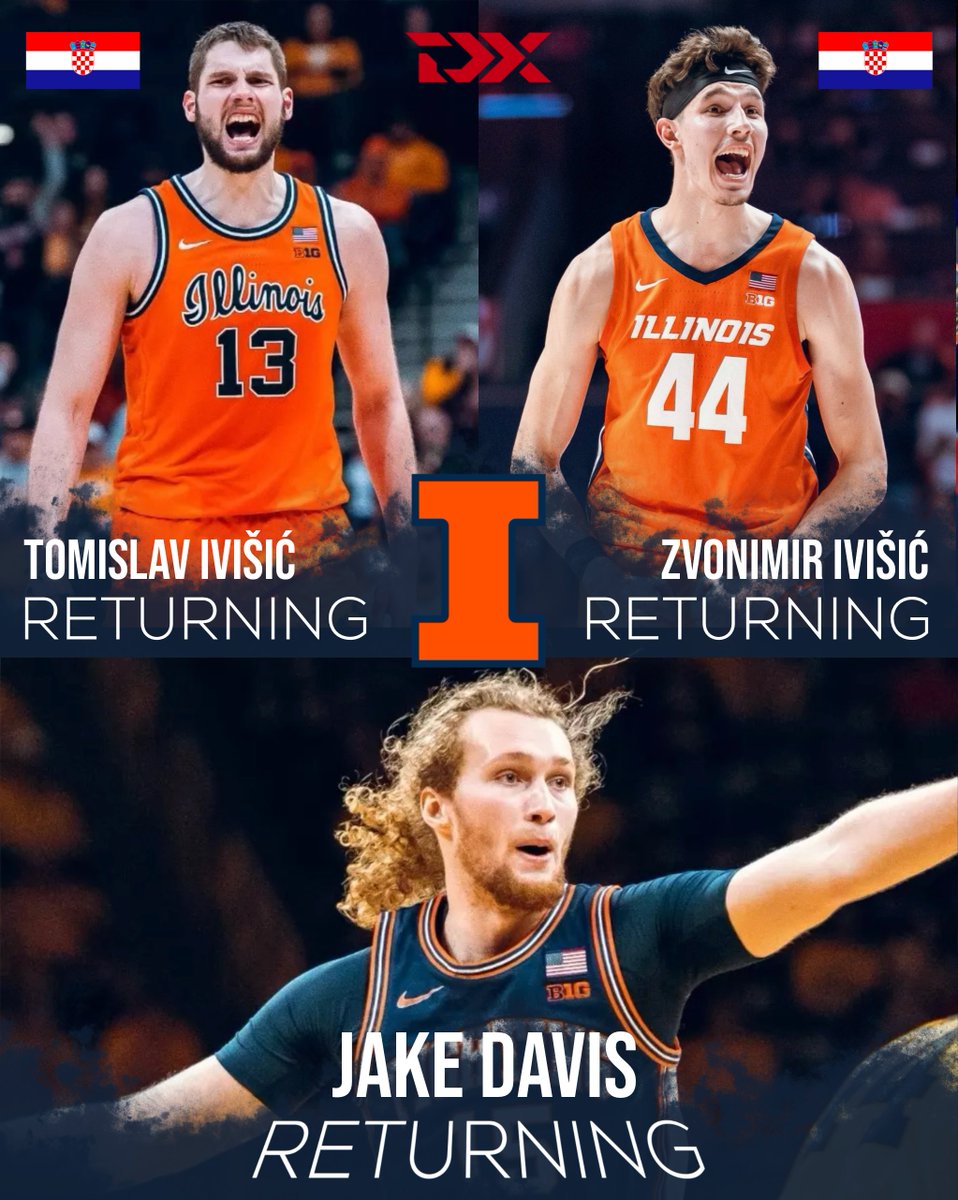
NEWS: Tomislav Ivisic, Zvonimir Ivisic and Jake Davis will return to Illinois next season, Misko Ražnatović told DraftExpress.
The trio joins David Mirkovic, who announced earlier today, giving Brad Underwood 4 of his top 8 scorers back from last season's Final Four team.
84
429
3,339
540,376
Mike Dudek retweeted

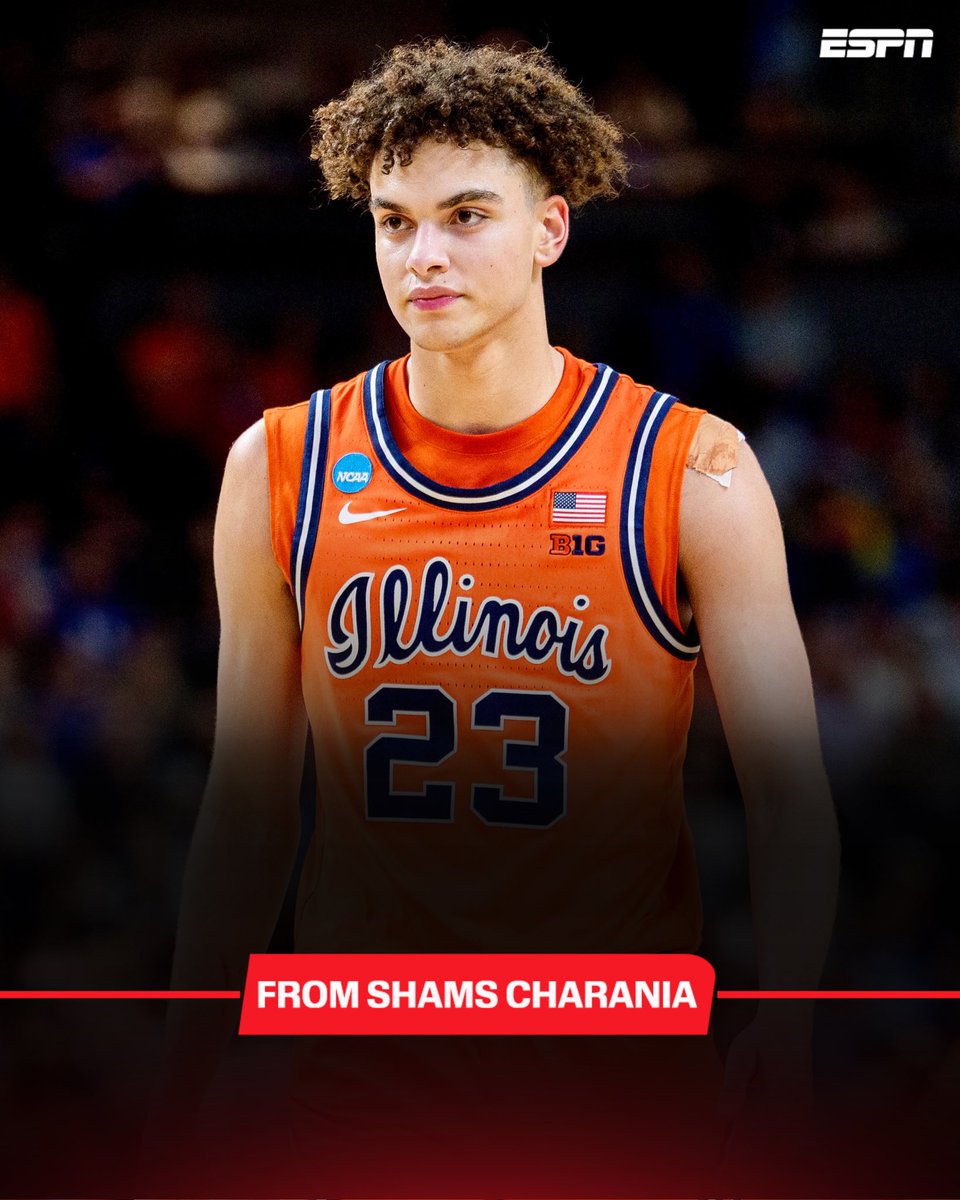
Apr 11
Illinois freshman guard Keaton Wagler – ranked No. 5 in ESPN's Top 100 – has declared for the 2026 NBA draft, his agency ProMondo Sports tells me and @JeremyWoo. Wagler led the 28-9 Fighting Illini to the Final Four for the first time since 2005.
376
1,098
12,267
1,467,576
Mike Dudek retweeted
ARE YOU WITH US?
For the first time since 2005, we're heading to the FINAL FOUR.

257
3,623
13,262
669,186
Mike Dudek retweeted

ZVONIMIR IVISIC ARE YOU SERIOUS WITH THAT POSTER 😱
28
467
2,880
721,504
Mike Dudek retweeted

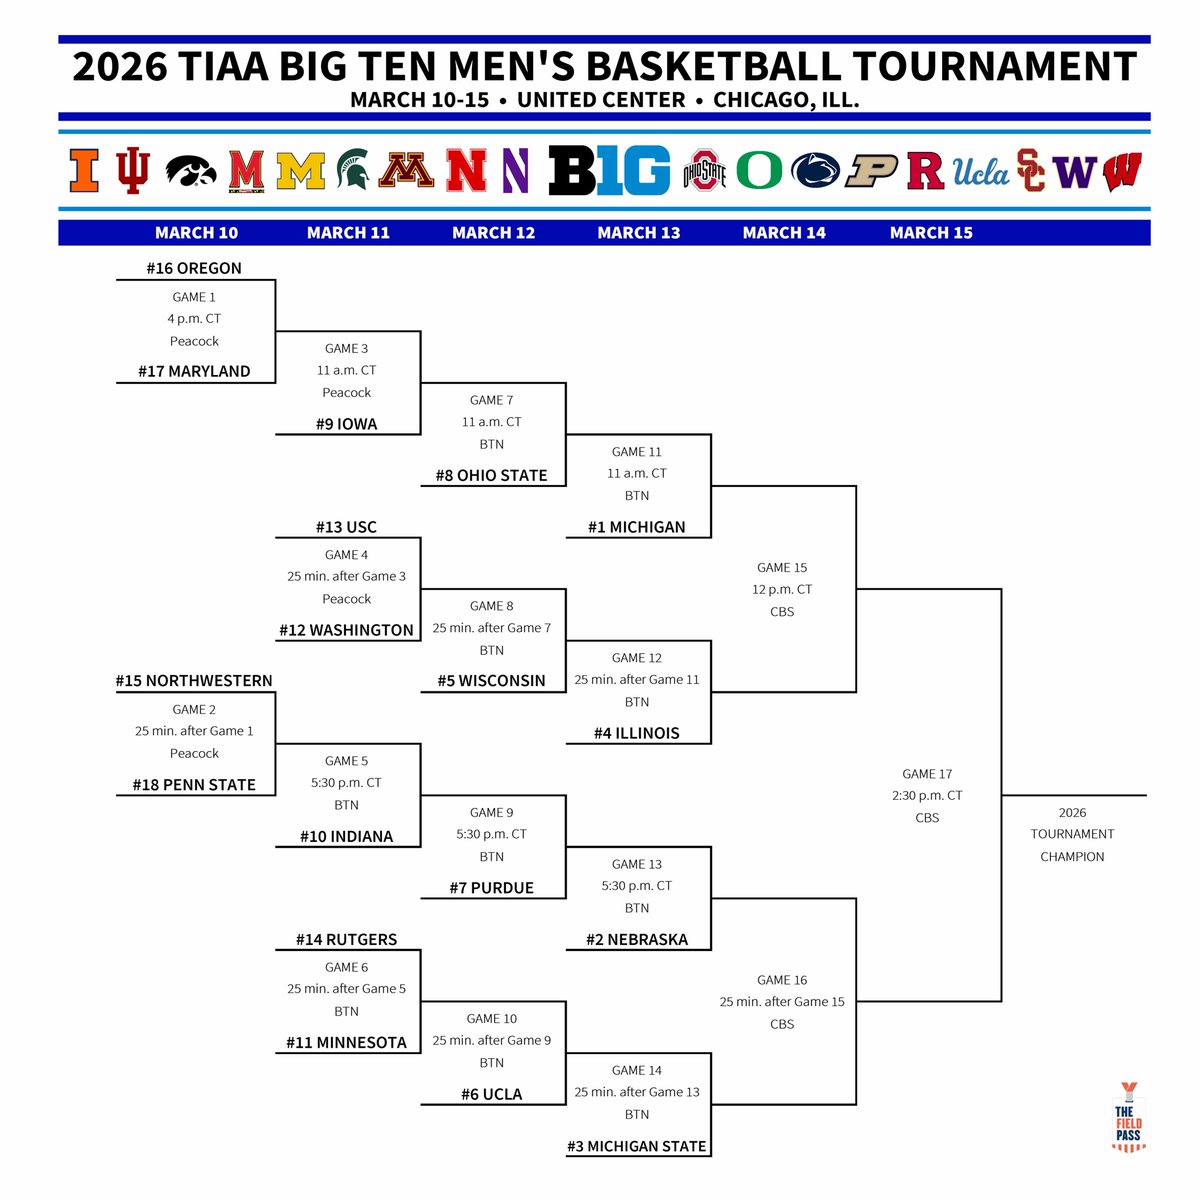
Mar 8
Here’s your official 2026 Big Ten Tournament bracket:
2
26
166
30,239
Mike Dudek retweeted
31 Dec 2025
When SEC fans argue that their conference is better, remember the facts.
Last two national champions? B1G.
Top 2 seeds in the CFP? B1G.
2024 bowl records? B1G 11-6, SEC 8-7.
2025 bowl records? B1G 6-0, SEC 2-5.
The SEC’s reign is over. The Big Ten sits atop the throne.
71
115
1,197
33,306

Mike Dudek retweeted
17 Dec 2025
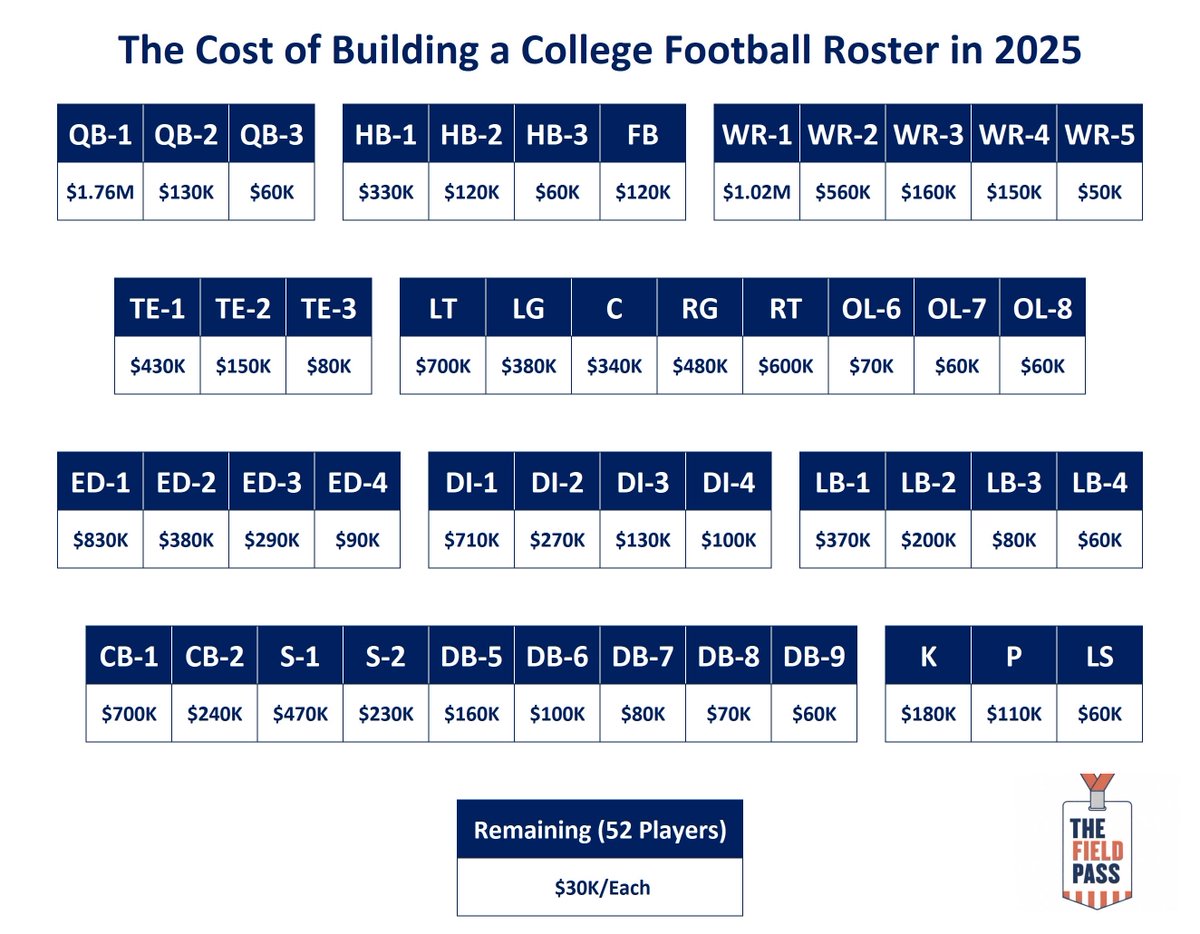
Decided to do a small project on college football roster construction and how resources could be allocated by position.
The framework is grounded in data and research on how NFL teams construct rosters and allocate the salary cap by position. Those patterns serve as the starting point, with one major adjustment for the college game: roster size. The NFL has 53 players. College football allows up to 105.
To make the comparison work, our model mirrors the top 53 roster spots using NFL allocation tendencies, then sets aside $30k per player so the remaining roster still receives revenue share. Important reminder: this revenue share is on top of full scholarships (tuition, room and board, fees, etc.) and is separate from NIL compensation.
For 2025, the maximum revenue share per school is $20.5M. That pool can be divided across athletic programs however the AD sees fit. A commonly used assumption is football receives ~75%, or $15.375M, which serves as the baseline here.
It’s also worth noting that many schools won’t have the resources to fully fund the $20.5M max. This is where the divide between the B1G/SEC and the rest of the sport is likely to widen over the coming years.
This isn’t meant to be prescriptive. Think of it as a starting point informed by data, not a rigid blueprint. Coaches and GMs will move money around based on philosophy, roster strengths, and development pipelines.
Want to splurge on a $2.5M QB? Roughly $740k has to be cleared elsewhere. That might come from the bottom of the depth chart or by finding value at RG and RT. Tradeoffs are unavoidable.
The same logic applies at other positions. If three RBs are of similar caliber, the split doesn’t have to be $330k / $120k / $60k. It could look more like $230k / $210k / $170k.
Roster building is now as much about allocation as it is evaluation.
1
5
85
9,073
Mike Dudek retweeted

7 Dec 2025
A great time in NashvILLe.
28
273
2,138
62,732

Mike Dudek retweeted
30 Nov 2025
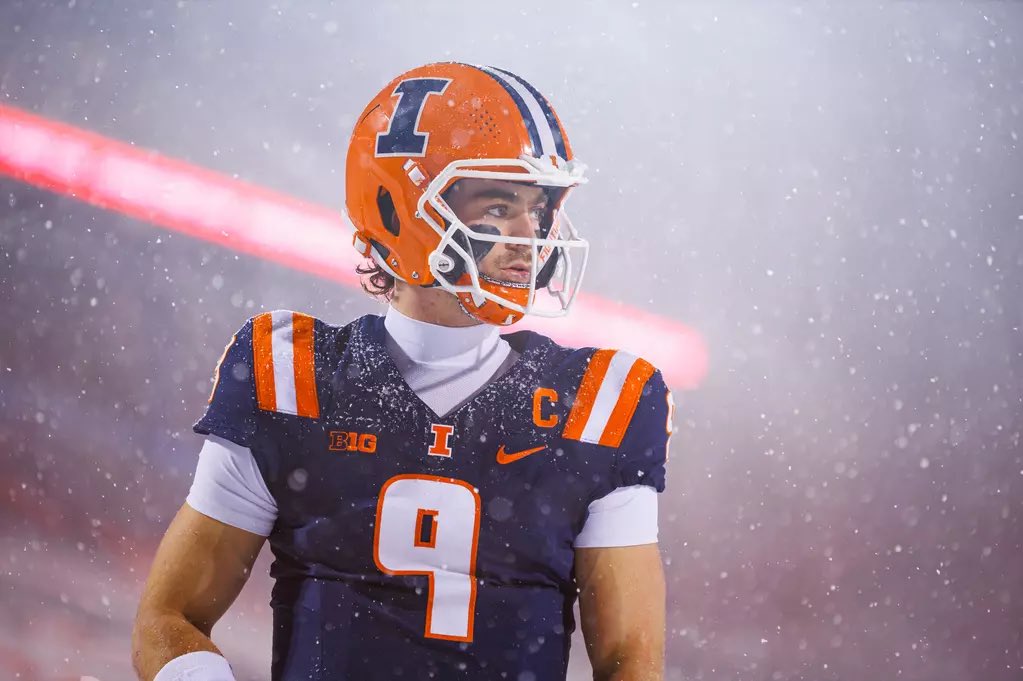
In his 3 seasons at Illinois…
8,098 total yards
67 TDs / 21 INTs
64.5% completion
145.1 rating
Captain
Back-to-back bowl games
23 wins
Thanks for choosing to wear the orange and blue and taking this program to new heights.
There’s only one way to send him off…
LUUUUUUUUUUKE
14
130
1,800
28,425
Mike Dudek retweeted

30 Nov 2025
A new era begins on the Plains 🦅
Welcome to Auburn, @CoachGolesh
🗞️: auburntige.rs/4ruf0Ho

371
975
6,556
2,300,992
Mike Dudek retweeted

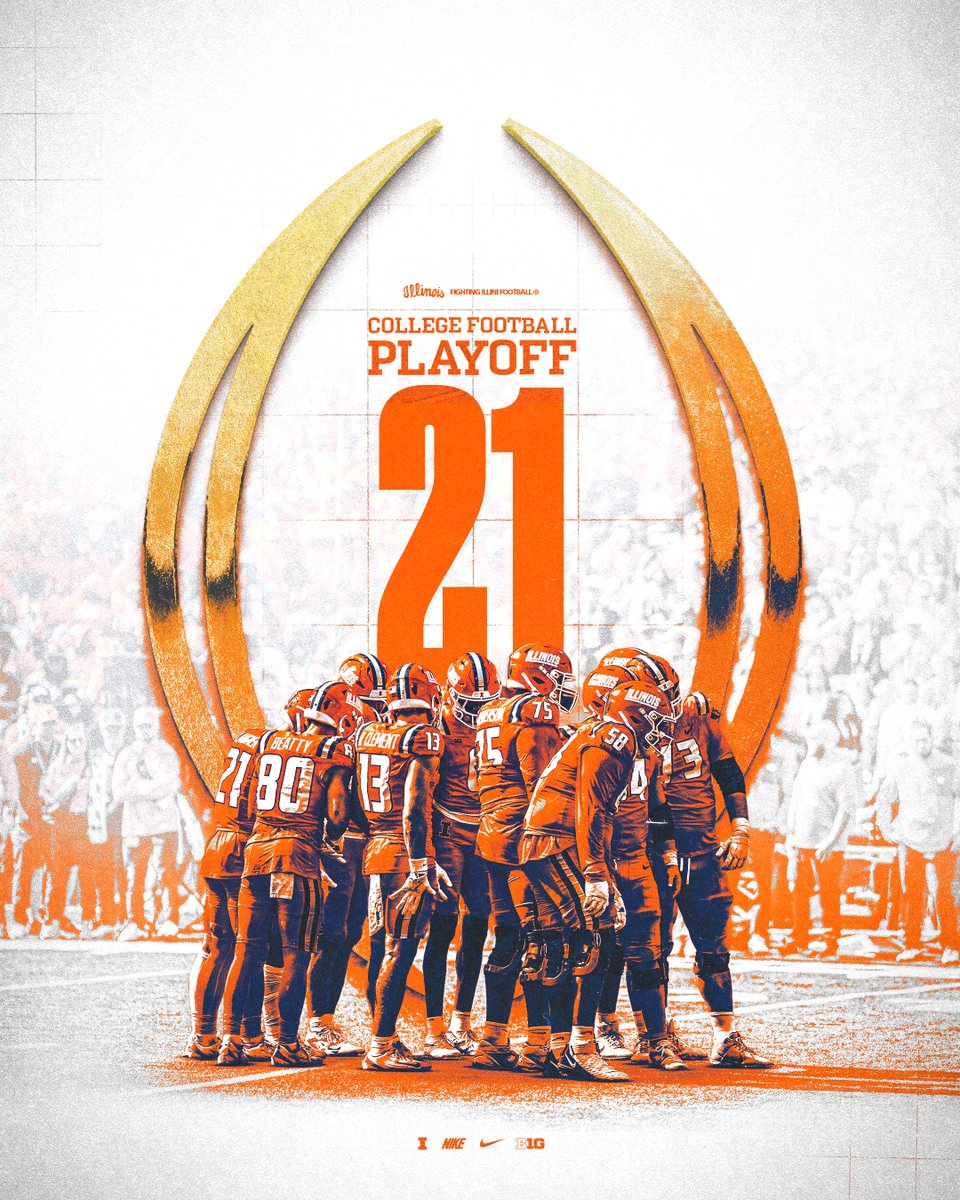
19 Nov 2025
No. 21 in the College Football Playoff Selection Committee Rankings
23
172
1,462
105,871
Mike Dudek retweeted

4 Nov 2025
Great moment! I knew I'd seen this before.
Here's @MDFlash_7 after beating Penn State in 2014.💙 #NCAAFB #Illini

3
46
6,076
Mike Dudek retweeted
26 Oct 2025
We’ve seen this a time or two! First of many for @PatBryant

Bo Nix throws it up to Pat Bryant II for the TD!
The first career TD for the rookie WR 🙌
DALvsDEN on CBS/Paramount
watch.nfl.com
5
60
823
39,692
Mike Dudek retweeted
10 Oct 2025
TFP 6.7 - Ohio State Preview
The gang’s all here. @MDFlash_7 rejoins the pod to preview Saturday’s showdown with #1 Ohio State.
🎙️Apple: apple.co/3k0OP7h
🎙️Spotify: spoti.fi/369Ugf1
🎥YouTube: youtu.be/t4oeI6WLeOs
2
6
17
1,787
Mike Dudek retweeted
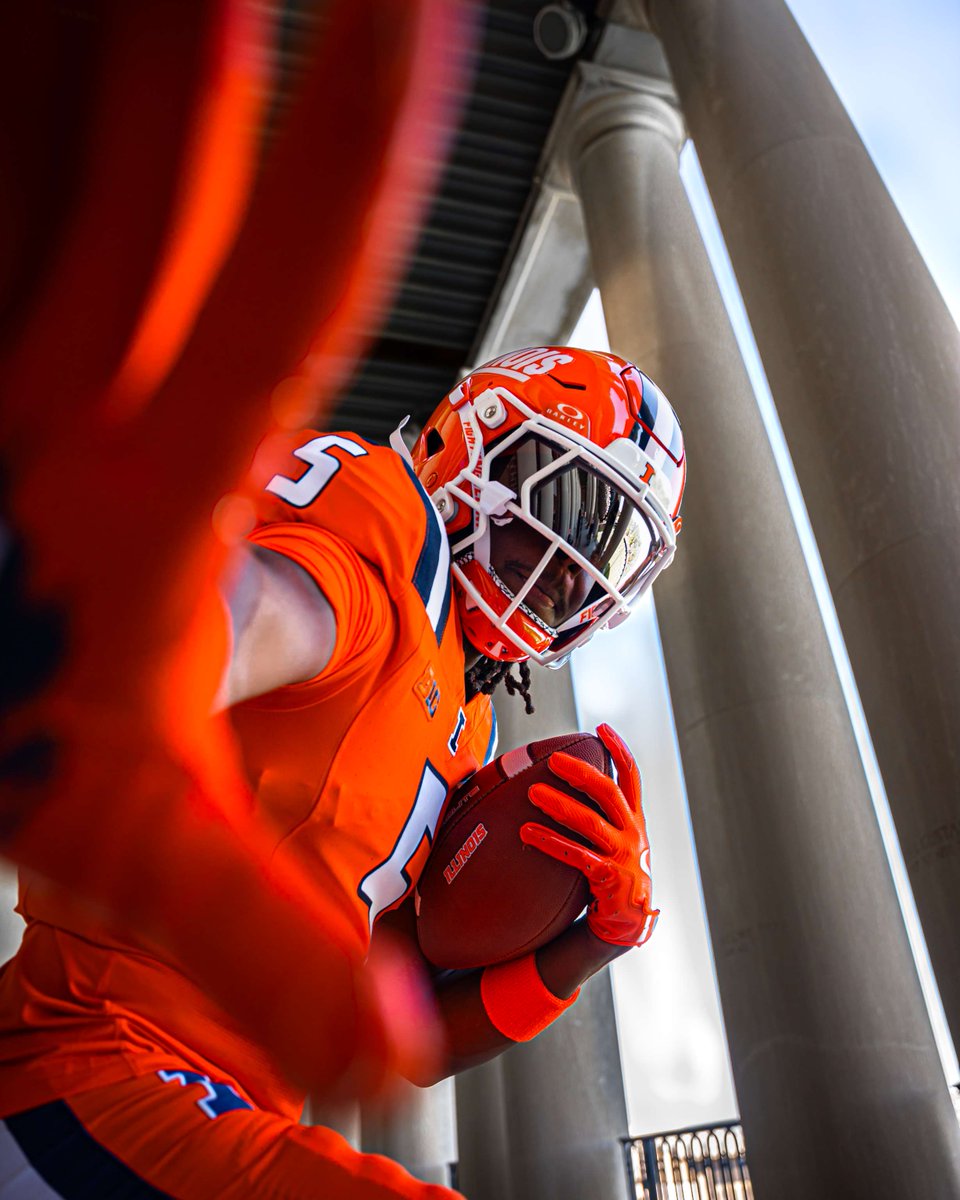
9 Oct 2025
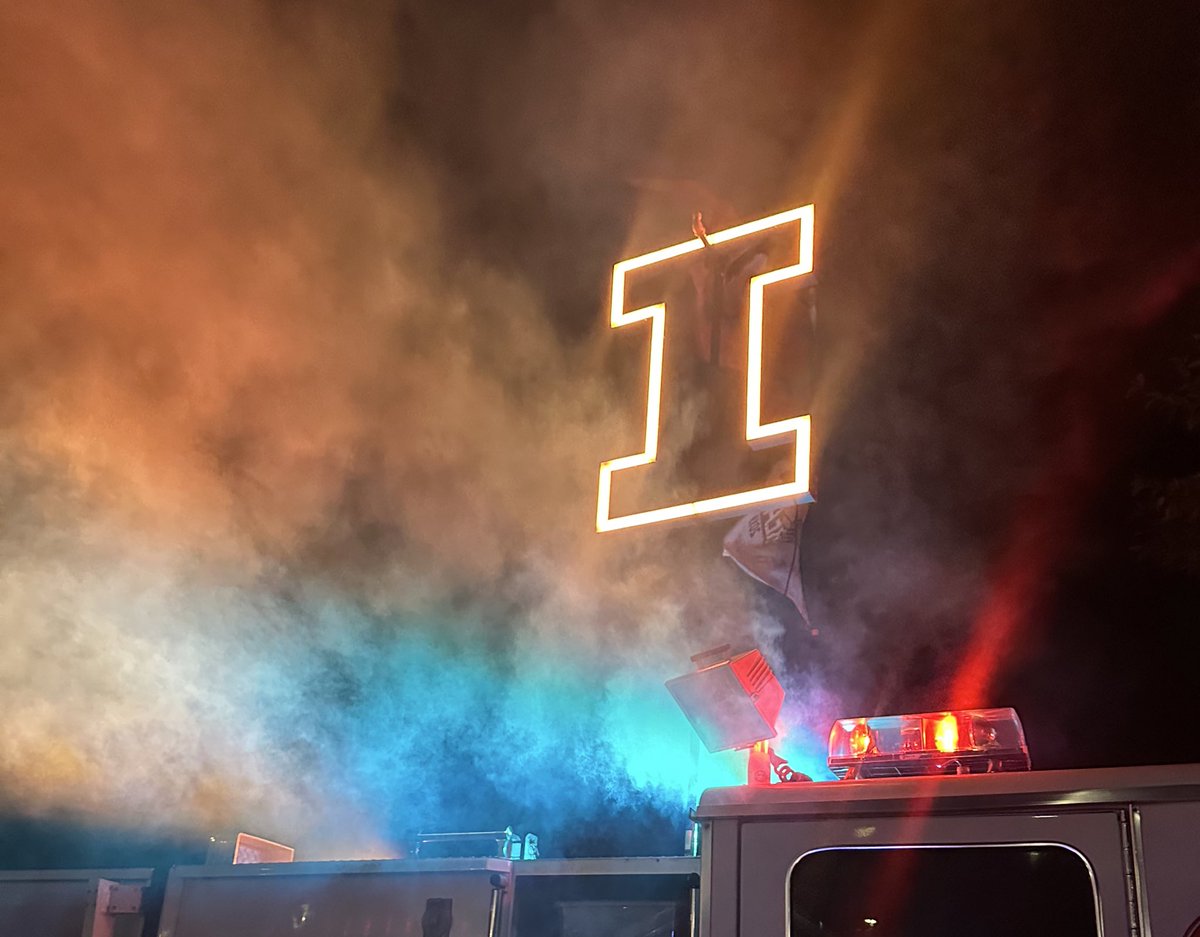
It's an orange out for a reason.
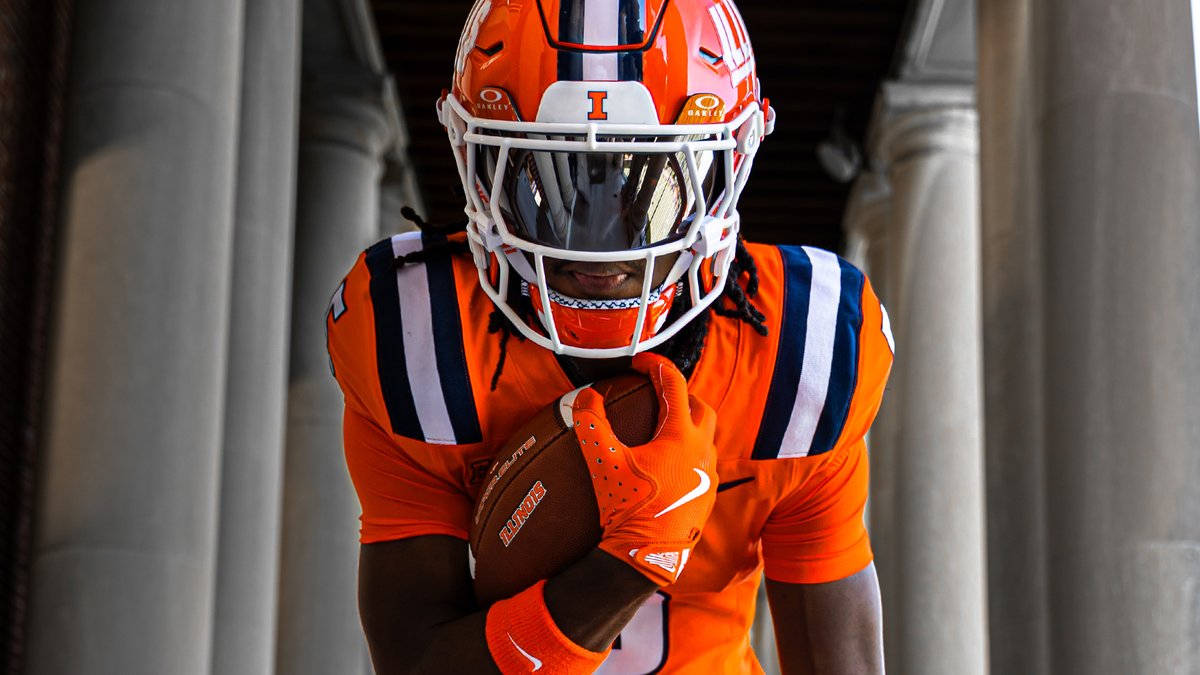
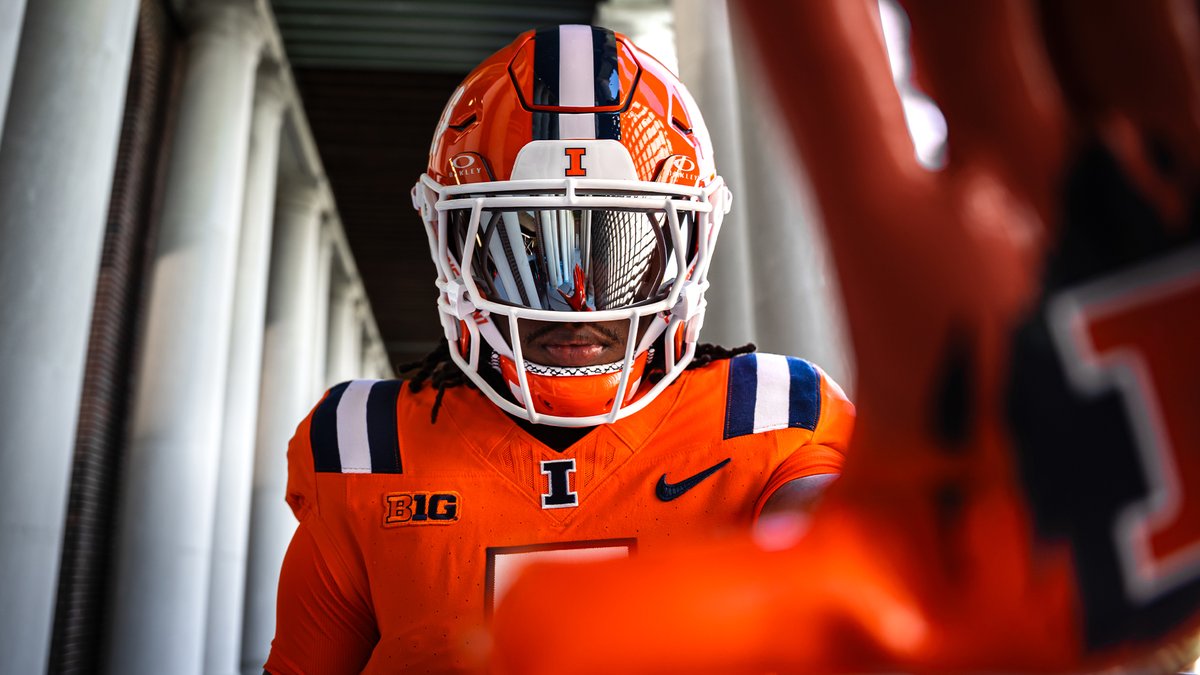
19
99
996
123,477
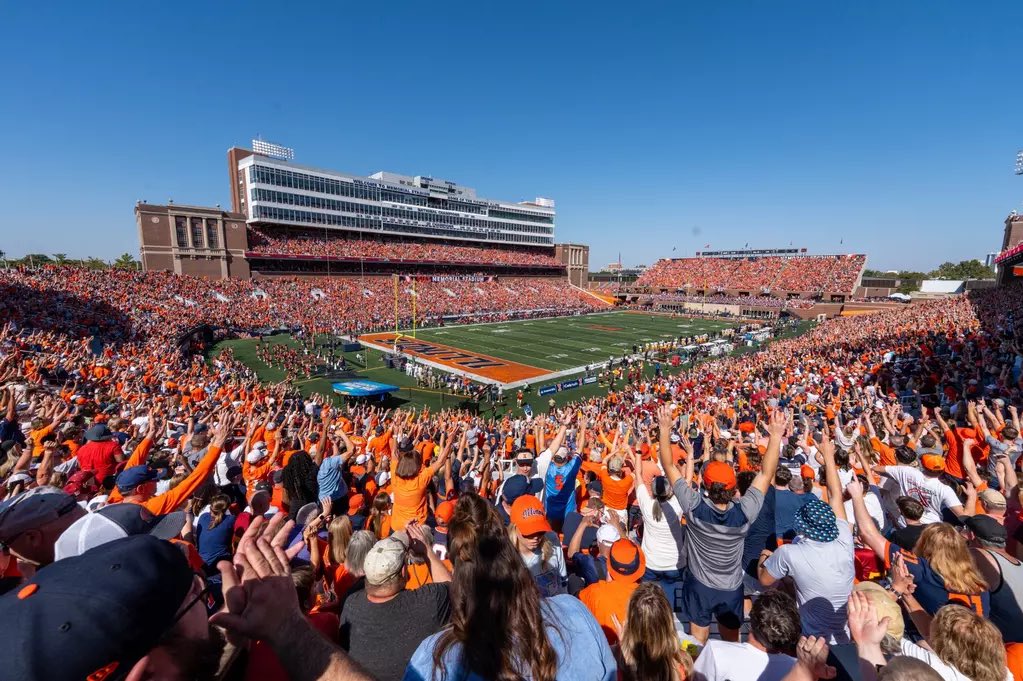
Mike Dudek retweeted
5 Oct 2025
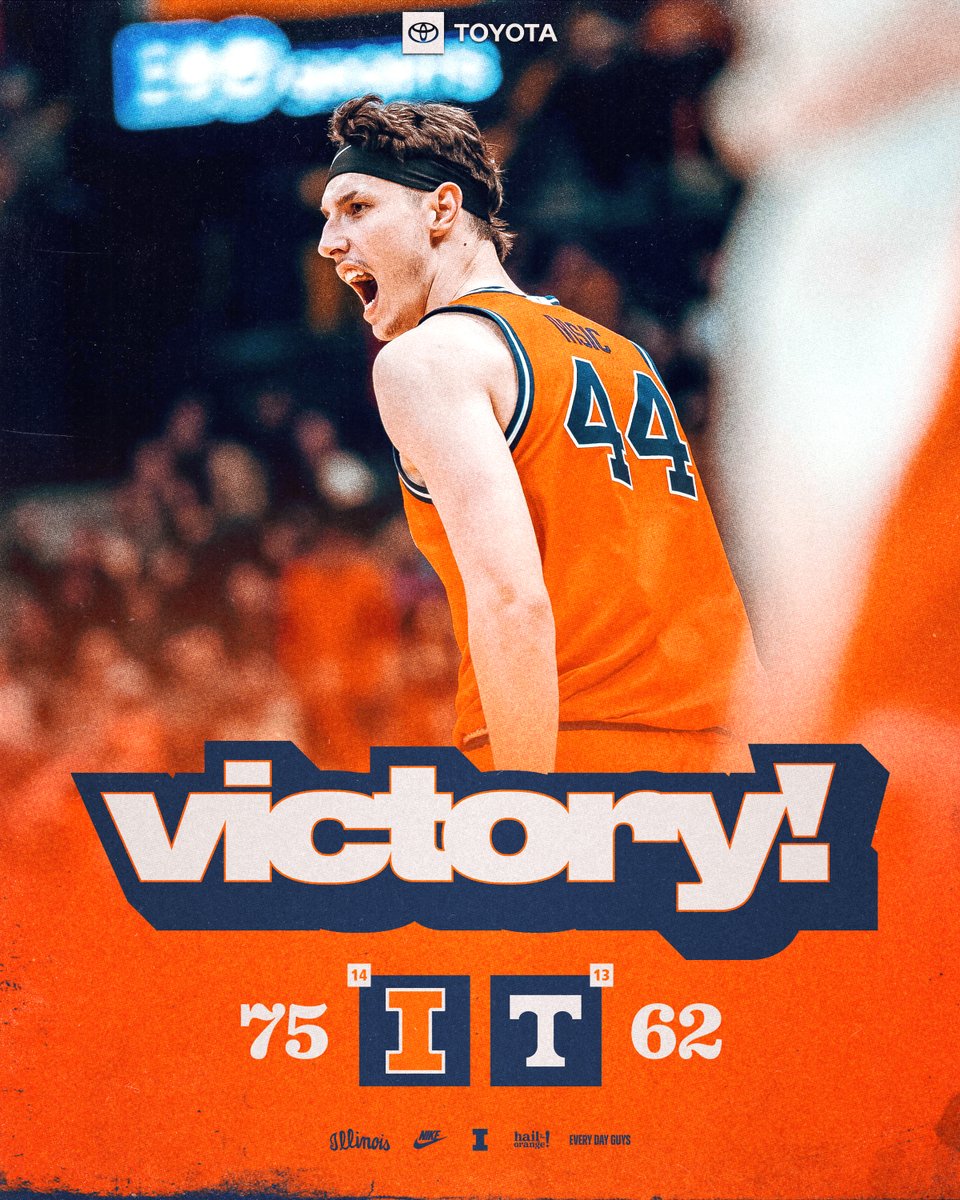
This is the golden age of Illini football.
• 5-1 and ranked #17
• Undefeated #1 Ohio State in town
• Fox Big Noon Kickoff back
• Sold out crowd
• Orange out
• 73° and sunny
• CFP implications
Shock the world.
33
86
1,422
42,175