
Macro Trading, Flow Following, Deep Learning Model Building. CEO Modern Macro Technologies youtube.com/@mmtmacrotrader
Joined March 2016
- Tweets 3,662
- Following 476
- Followers 6,054
- Likes 6,210
1,094 Photos and videos


Jun 12
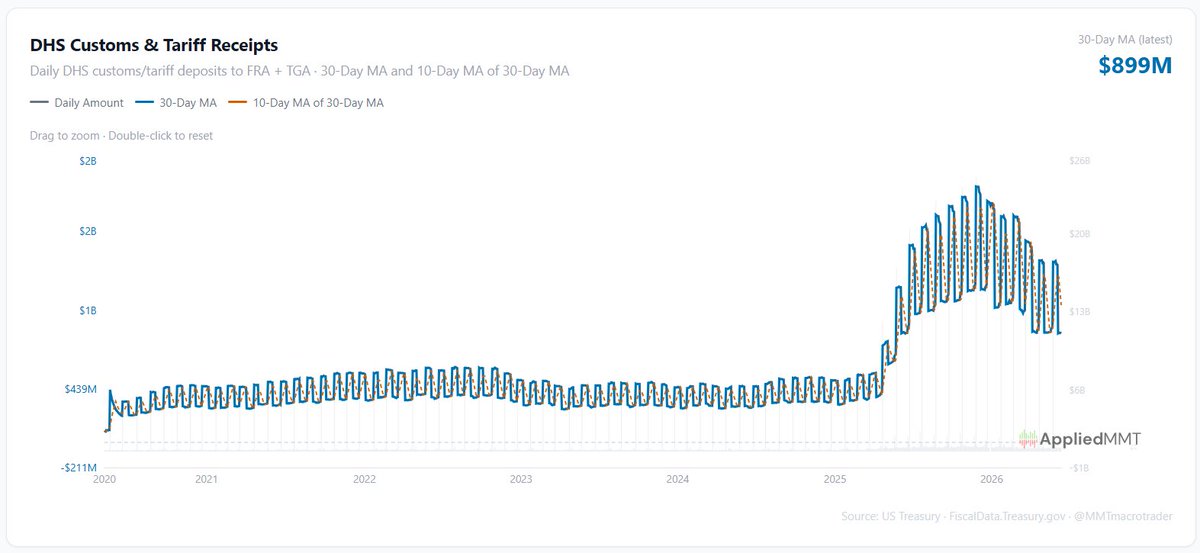
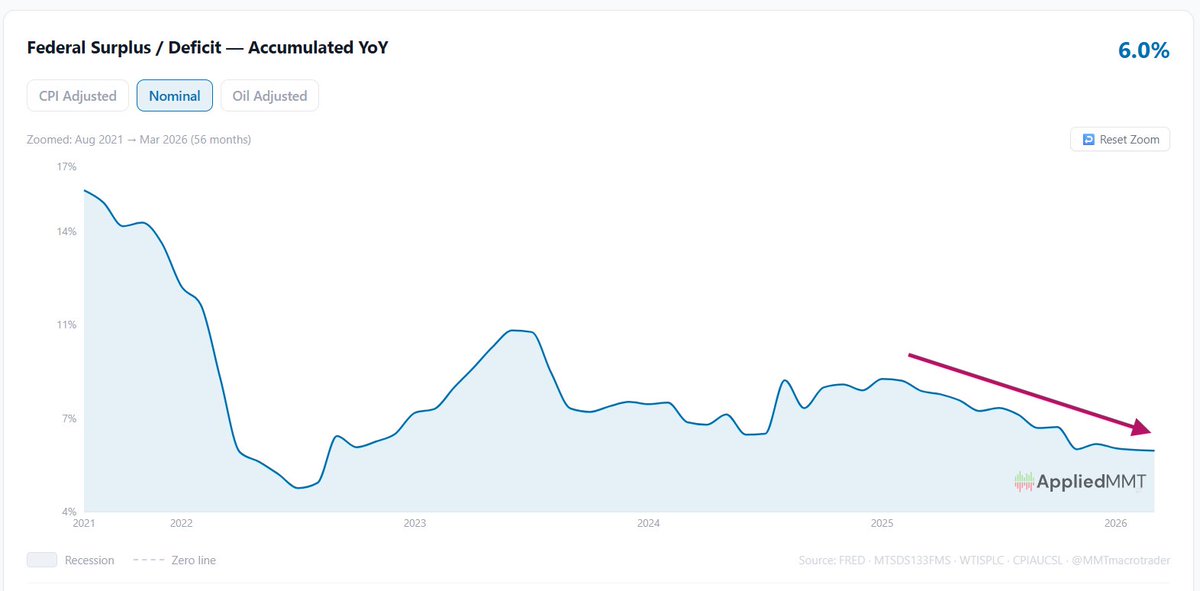
The biggest market crashes and recessions come from collapsing fiscal impulse (surpluses).
The reason is simple: govt spending = financial assets for the private sector, this fuels the business cycle.
Fiscal is getting dangerously weak here!
21
35
125
10,616
Market Update is Live!
I know markets sold off on Friday as the likelihood of hikes jumped, but like 2022, higher rates could actually save the day here.
appliedmmt.com/06-08-2026-ma…
10
598
May 13
Inflation getting hot! Setting up some late cycle dynamics. Full analysis in the update.
appliedmmt.com/05-12-2026-ma…
2
1
29
13,047
Big jobs beat today, but economic activity heating up while fiscal slows puts us in a precarious spot.
Not unsustainable yet, but the worst of the oil/Hormuz supply shocks are still very much in front of us. More inflation is coming. Still structurally bullish, but getting thin.

4
3
56
5,433
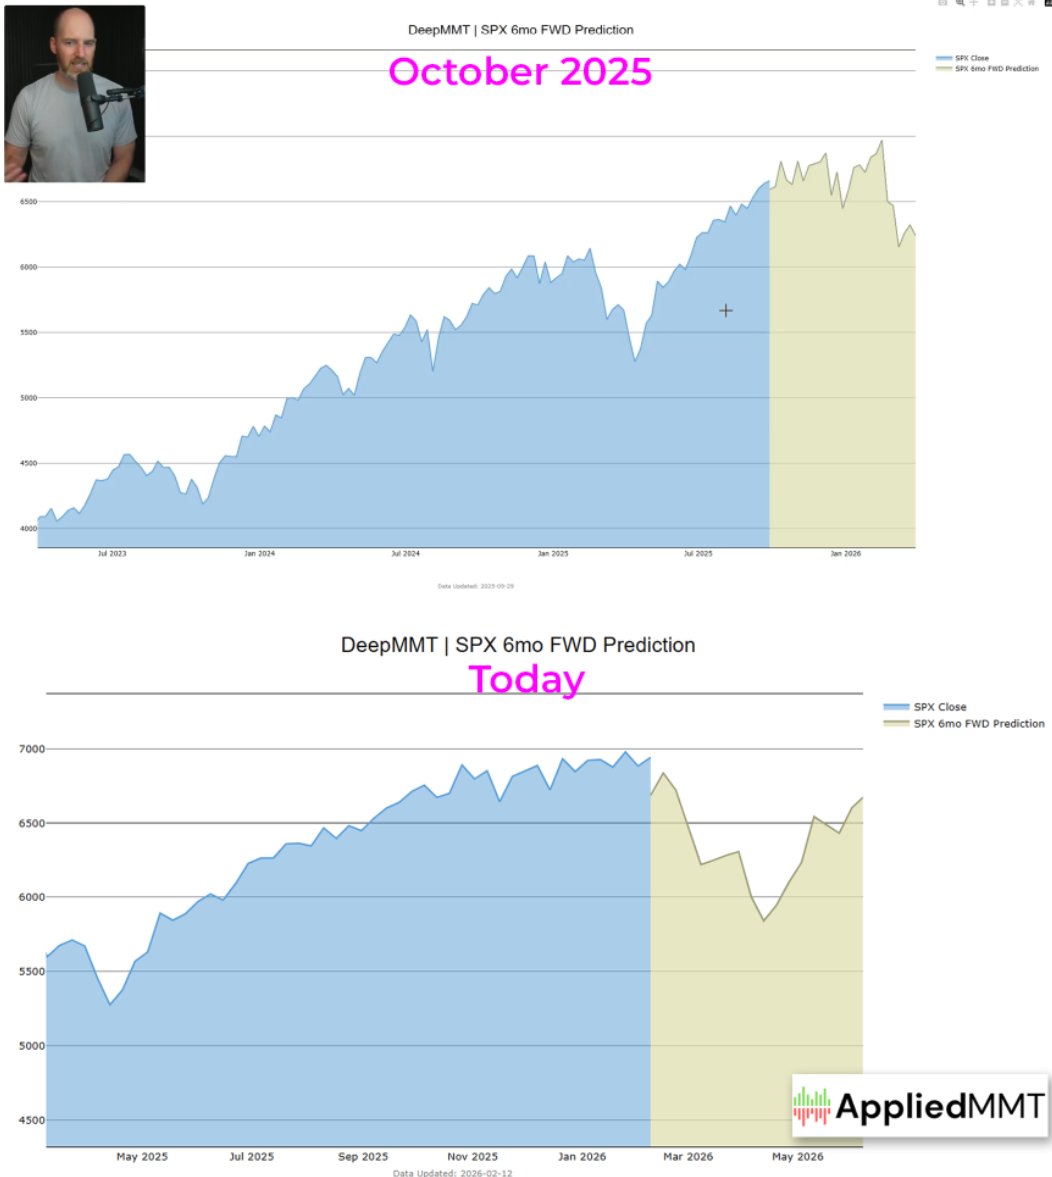
DeepMMT continues its precision SPX forecasts.
I launched DeepMMT 3 years ago, and the track record speaks for itself. (see the 3 year history of calls below)
Not only has the model proven itself, but it's proven that the predominant driver of price is flows. MMT was right.
Feb 13

6 months ago, DeepMMT was looking for a major selloff to materialize in Feb 2026. I've been discounting this forecast, thinking it was a mix of base effects and bias towards recent seasonality but I'm starting to think DeepMMT knew something all along.
11
12
51
11,016
x.com/MMTmacrotrader/status/…
x.com/MMTmacrotrader/status/…
x.com/MMTmacrotrader/status/…
x.com/MMTmacrotrader/status/…
x.com/MMTmacrotrader/status/…
x.com/MMTmacrotrader/status/…
x.com/MMTmacrotrader/status/…
x.com/MMTmacrotrader/status/…
5 Sep 2025
DeepMMT does it again. 2 years of pinpoint accuracy. 🎯
Put your politics aside, what MMT does for traders/investors is give you the proper framework for analysis of the core driver of asset prices: flows. Accurate forecasting begins with understanding flows & their impact.

1
6
1,617
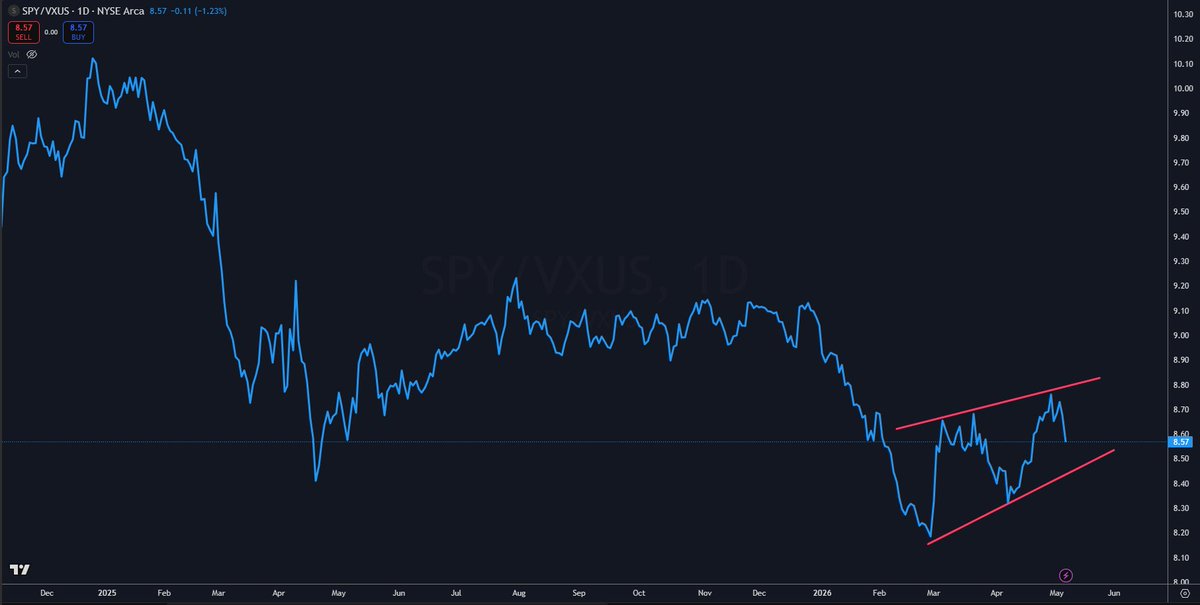
Diversification outside the US still makes sense here.
Following liberation day, the rest of the world has outperformed the US at an unprecedented pace.
The Iran conflict gave a short reprieve (dollar rally) but it looks like the next leg of the trend change is underway.

3
1
29
1,819
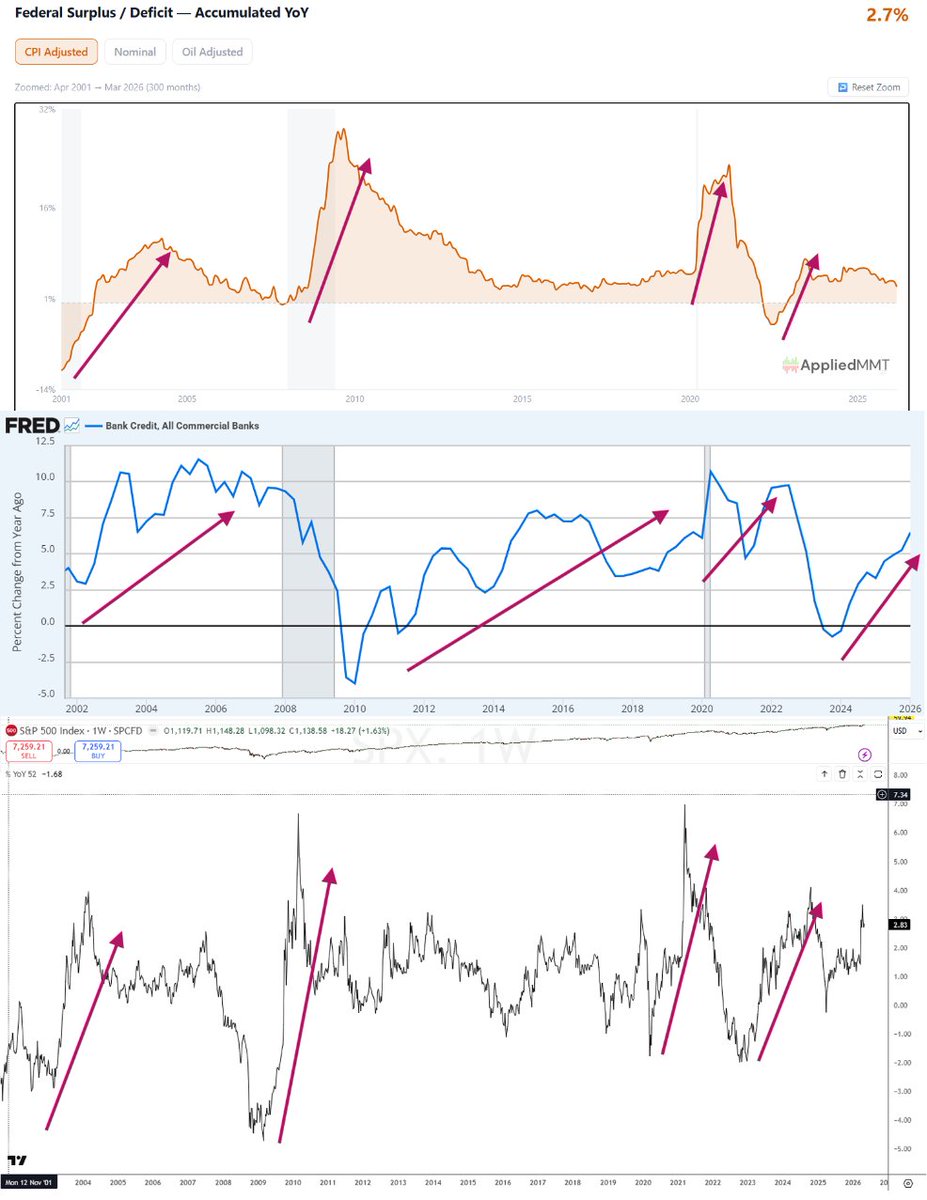
Returns follow flows, not economic activity & earnings.
By the time the headlines say the economy is heating up most of the move has already happened because what most of macro measures is a consequence of, not the cause of, fiscal and credit expansion.
The biggest move in returns comes directly from fiscal. Fiscal also supports credit expansion which in turn caries the cycle along as fiscal fades.
This cycle began in late 2022 because of the massive fiscal add from the rate hikes. That was the time to get bullish and excited about a huge run. Now is the time to be vigilant, looking for policy decisions and shocks that may bring an end to the fiscal support and work against credit growth.
7
26
93
8,336
Bitcoin follows the acceleration of fiscal. Nice rally off the back of fiscal acceleration in early April.
I'm not convinced that it'll hold for all that long, but some fiscal headwinds are starting to wane (tariffs/taxes) so some hope for a reasonable rally here.
1
3
33
1,487
Market Update Live!
A few late cycle signals are starting to show, but core flows still likely remain supportive for now.
appliedmmt.com/05-02-2026-ma…
8
24
1,377
If you're going to debunk something, for the love of God at least quote them in their own words as opposed to what you "think" they're saying.
Apr 30

Today is launch day!
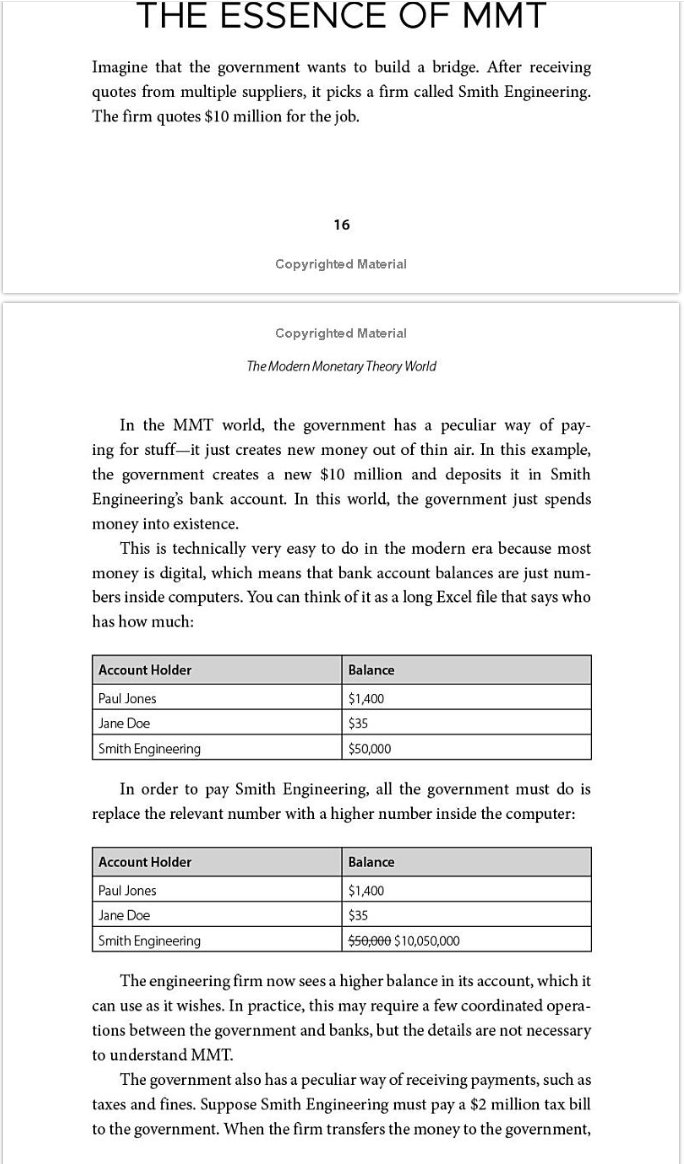
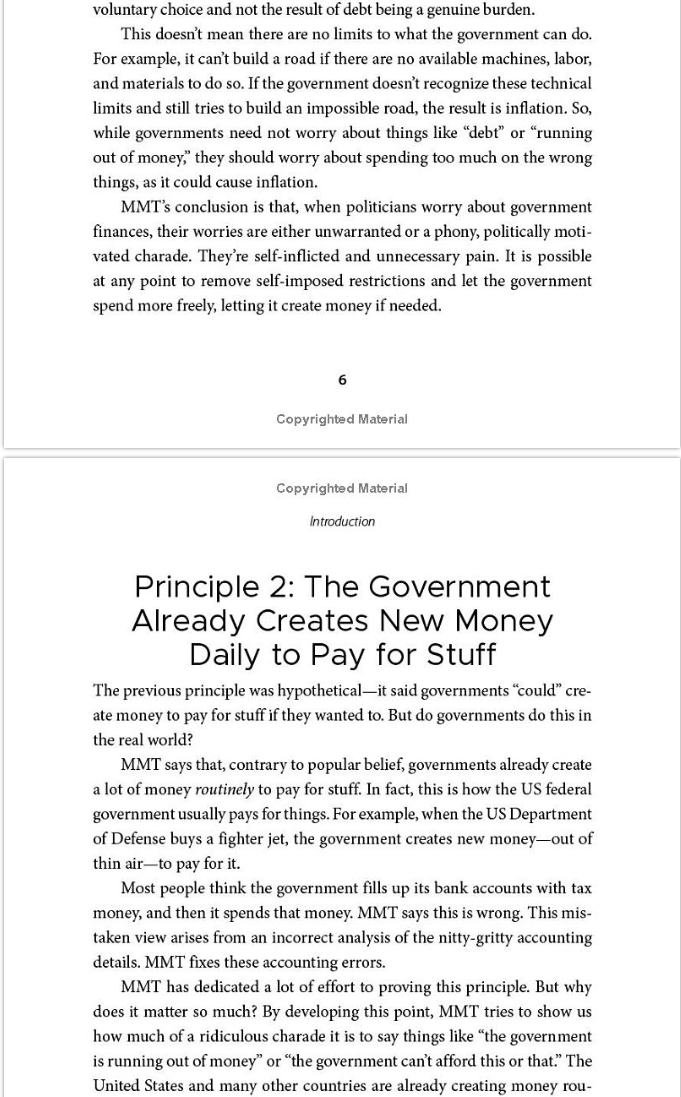
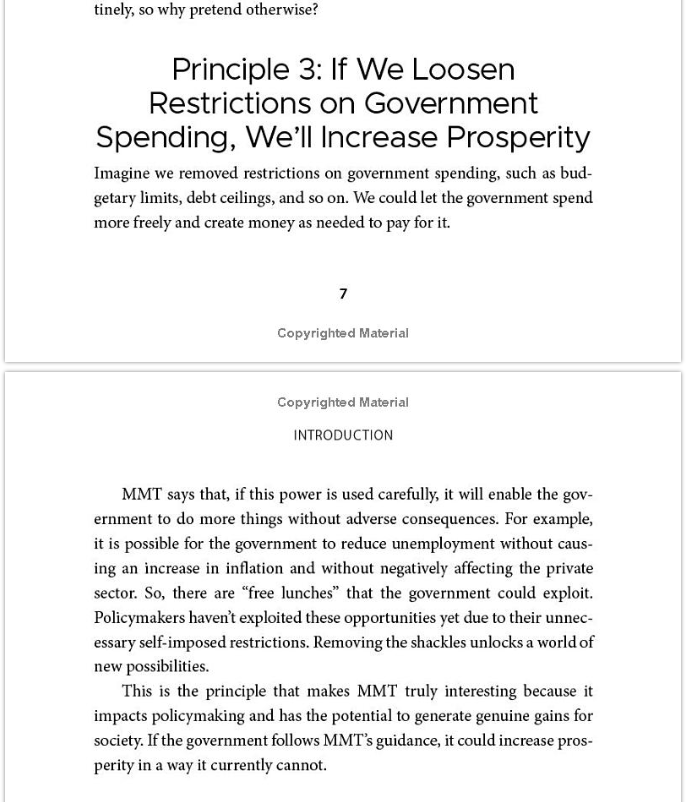
Modern Monetary Theory #mmt is a seductive economic theory that's making the rounds around the world. It was popularized by Stephanie Kelton in her book The Deficit Myth, and it's been influencing politicians around the world.
The theory was dismissed by traditional economists right away. But I didn’t want to do that. I wanted to learn as much as I could before drawing conclusions. So, I approached it with an open mind and read over 3,000 pages of work by modern monetary theorists themselves and their most thoughtful critics.
The conclusion: MMT is not good. But I think we all need to understand what MMT says, as it’s a deeply seductive theory with the potential to cause a mess.
Get a copy of my new book now :)
amazon.co.uk/dp/1394375255/

6
16
102
4,738
21
908
Apr 30
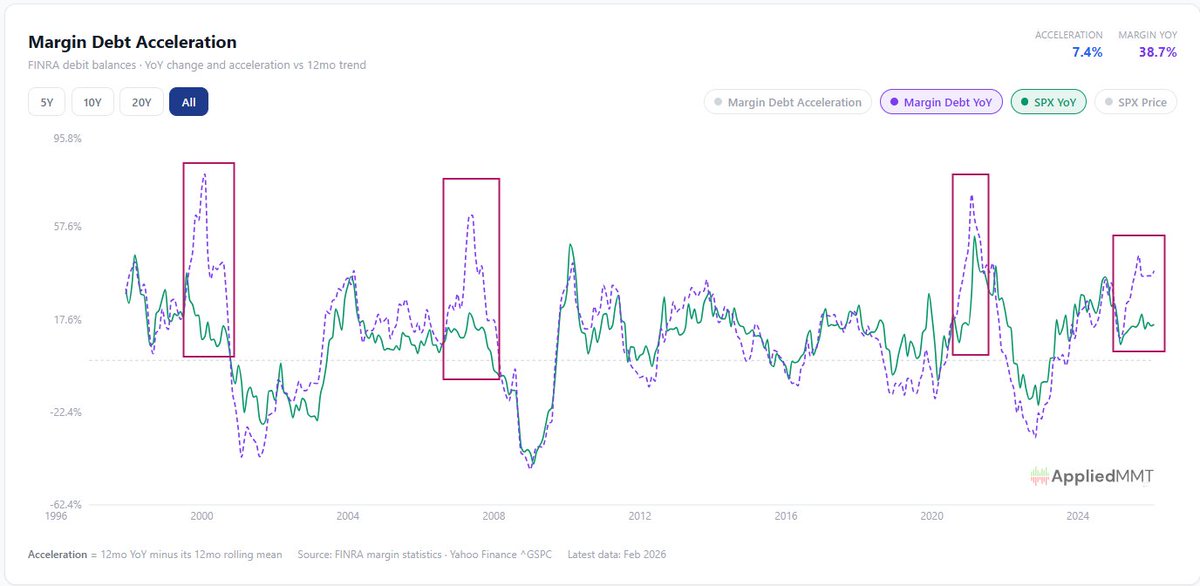
I am not bearish... yet. But this is concerning.
Margin debt growing at a much faster pace than market returns historically ends quite poorly, especially when the fiscal rug gets pulled. 1/2
22
35
227
18,259
Apr 30
If asset prices fail to validate the new margin debt loans, and fiscal goes from a net add to a net subtract (as played out in 2000, 2007/08, 2022) there is no escaping a major selloff.
2
2
34
2,051
Apr 28
The wealth effect argument has always bothered me. It seems backwards.
Yes, lowering rates will boost asset prices via DCF math but an asset’s price and yield are inverse in the absence of new flows. Without balance sheet expansion, you’re just pulling forward future returns at the expense of less income going forward.
This doesn't cause growth, it inhibits it because it requires savers to actually save more in relative terms. Prices don't cause spending, it's the spending (flows) that cause the price.
7
6
38
4,685
Apr 27
Great analysis on a highly probable path forward given oil and the Fed's likely response here.
Apr 24

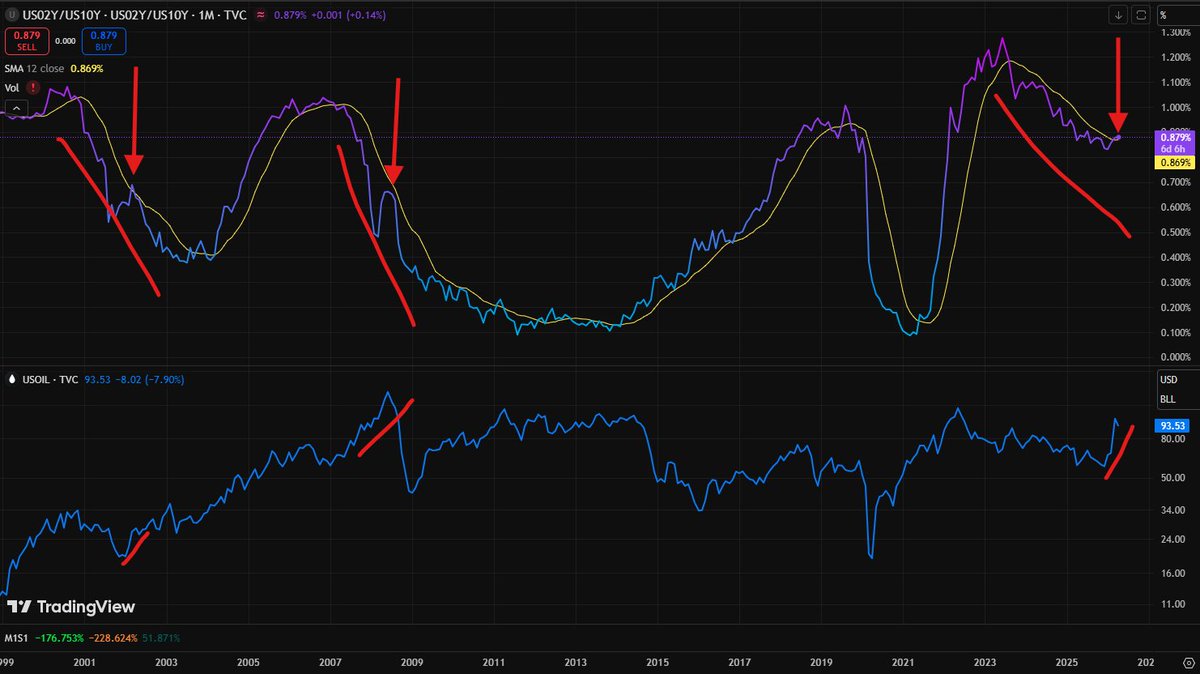
Thoughts on Oil, the Yield Curve, and a Familiar Policy Trap
The current configuration of the 2/10 yield curve increasingly resembles two prior late‑cycle episodes: early 2002 and early 2008.
In both cases, the curve appeared to stabilize just as oil prices surged. Those oil spikes in March 2002 and into May 2008 lifted headline inflation and nominal activity measures, creating the impression that growth was re‑accelerating and that the worst stresses had passed. In reality, higher energy costs were doing the opposite: compressing real incomes, weakening demand, and accelerating the downturn already embedded in the curve.
That same pattern is visible again. Oil and broader energy prices have moved higher, and markets are once again interpreting that as evidence of reflation and resilience. But energy costs rising are not neutral. They function as a real economic constraint, diverting household and corporate cash flow toward necessities and away from discretionary demand. In that sense, oil shocks act as their own form of tightening and this is precisely what the curve is already signaling. The pressure remains concentrated on the front end, consistent with weakening growth and rising income sensitivity.
Crucially, the Federal Reserve is unlikely to respond to this energy‑driven inflation impulse by pushing rates higher. The institutional memory of the post‑Ukraine war energy spike looms large. Policymakers are likely to look through commodity‑led price increases rather than risk compounding an income squeeze. Academic precedent reinforces that bias as well, as oil‑driven inflation (technically a price level change) has historically been treated as transitory and demand‑destructive, not something to be countered aggressively with policy rates.
The 2026 timing reinforces restraint. With U.S. midterm elections approaching, political signaling may lean hawkish, but the operational reality is different. The Fed is unlikely to risk overt policy mistakes in an election year, particularly when growth data are softening beneath the surface as prices escalate.
As a result, the adjustment happens first at the front end. 2yr yields lead lower, reflecting a recognition that current short‑rate levels are incompatible with slowing growth. This matters because Treasury issuance is now heavily concentrated in short maturities. Short‑term rates are not just a policy variable, they are a direct income channel into the private sector. As front‑end rates decline, the interest income paid to private sector, households and firms, falls with them.
That decline does not support activity in the near term. It withdraws income, slows balance sheet expansion, and reduces the pace at which financial assets are added to the economy. Consumption weakens, corporate cash buffers erode, and credit conditions tighten organically.
The 10yr also moves lower, but more slowly and by less. The common perception of structural deficits, issuance needs, and term premium keep longer‑dated yields from falling in lockstep with the front end, for now. The curve therefore steepens, but not because growth is improving. It steepens because income flows tied to short‑duration government liabilities are contracting faster than longer‑term yields can adjust.
And oil reinforces the illusion temporarily, just as it did in 2002 and 2008. Higher energy prices lift inflation optics and stall curve deterioration for now, even as real demand erodes underneath.
If history rhymes, this pause fades, oil‑driven inflation narratives give way to weakening consumption, slower money growth, and recessionary dynamics. Only later, once the downturn is evident, does the long end follow the front end more decisively lower.
2
3
26
4,962
Apr 25
Mind blowing that the vast majority of macro still believes this is deflationary and slows down business activity.
$1.2T annually is larger than all covid stimmy checks combined. Every year.
Going to be a lot of bewildered macro investors when cuts end up crashing the economy.
19
15
115
8,667
Apr 23
Dove deep into macro theory in todays market update.
Flows are way more important for direction than liquidity. Fiscal is the driving force and can always solve any liquidity crisis.
appliedmmt.com/04-23-2026-ma…
1
2
17
1,288