
23,839 Photos and videos


Pinned Tweet

Jun 4
If you enjoy my coverage here, you can follow MTS Insights across multiple platforms.
• Real-time macro releases & commentary
• Econ Mornings newsletter
• Telegram alerts
• RSS & Reddit feed
Choose the channels that fit how you consume information: mtsinsights.com/follow/

1
217

No uptick in activity yet
The Strait of Hormuz continues to operate below normal commercial levels, despite signals of diplomatic progress. As of 15 June, only five confirmed crossings were recorded, largely consisting of low risk movements, moderate shadow fleet activity and three commercial voyages laden with DPP and steel cargo. While public reports indicate the US and Iran have reached an initial agreement to extend the ceasefire and reopen the waterway, key operational questions remain unresolved, including transit security, navigation fees and safe passage arrangements. With no new vessel attacks reported since 10 June, risk conditions appear more stabilised, but low transit activity suggests market participants are still waiting for clear evidence of safety for a sustained operational normalisation.
Stay ahead of the market with #Kpler Insight: okt.to/PjUqKt
17
114
321
90,233
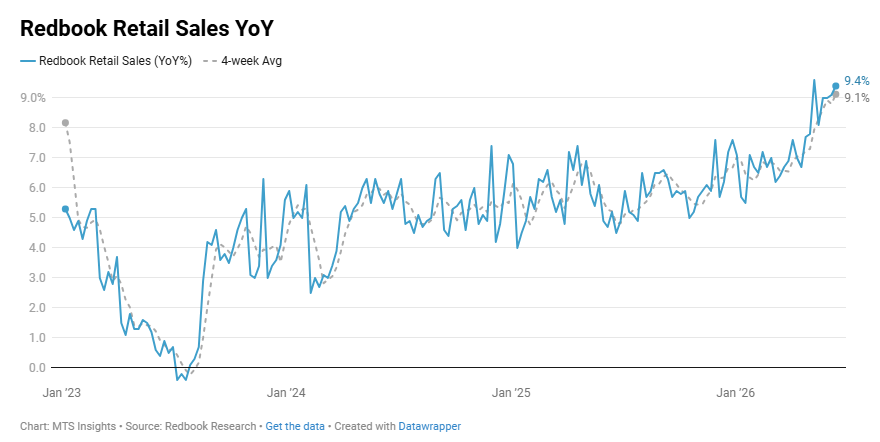
🔥 Redbook retail sales continue to run hot, up 9.4% YoY last week. The 4-week average has risen to a new 3 year high at 9.1% YoY.
1
66
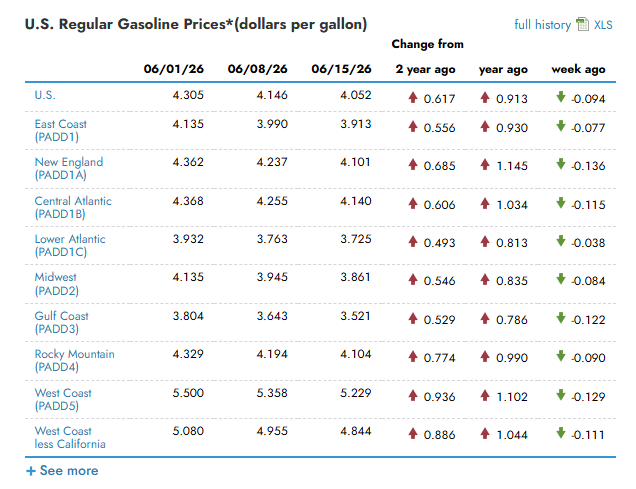
⛽️ The US regular gas price dropped again last week, falling -9.4 cents to $4.052, the lowest since the week of April 20th.
The national aggregate price is still up 91.3 cents YoY and up 61.7 cents vs 2 years ago.
1
72
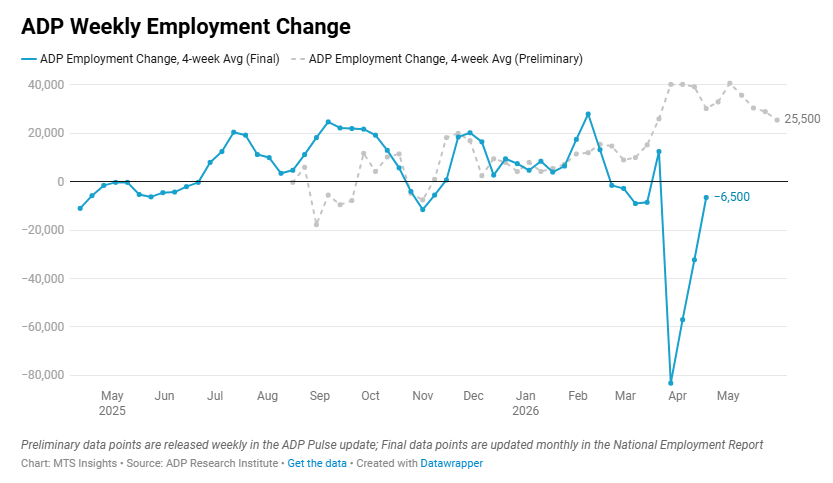
🇺🇸 The ADP weekly Pulse data point dropped again, falling to the lowest pace since the 2nd week of March at 25.5k
Still, no revisions to past data, and the sharp decline in weekly employment in late March remains a mystery.

🇺🇸 US private employment increased at an average pace of 25.5k in the four weeks to May 30th, down from an average pace of 29k in the four weeks to May 23rd.
1
131
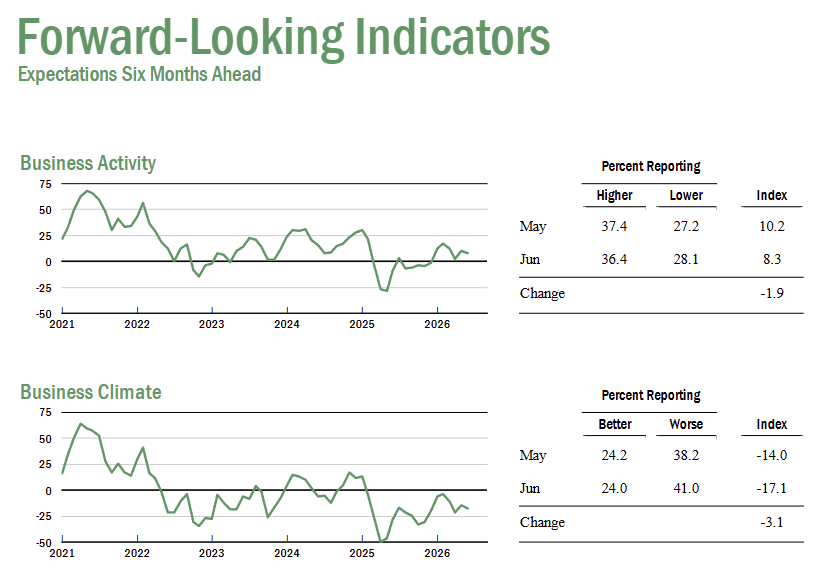
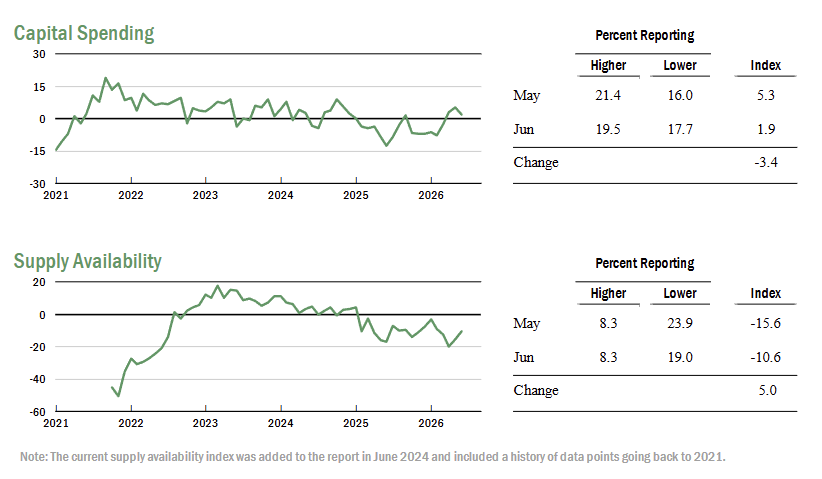
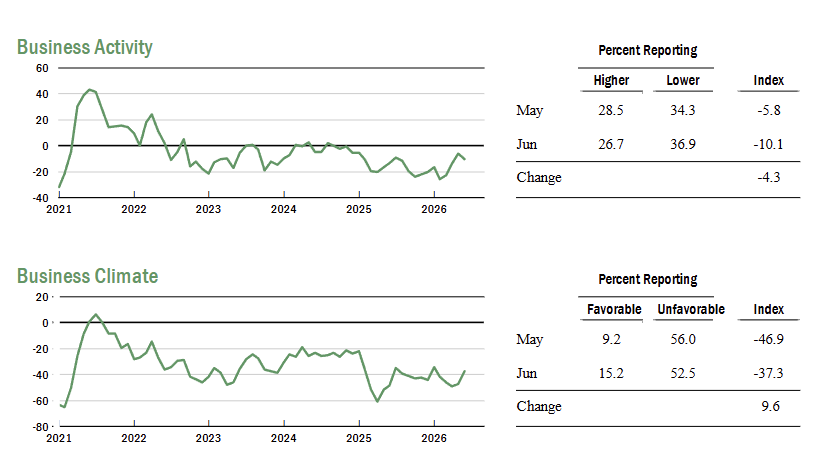
🇺🇸 New York service-sector activity remained under pressure in June, with the NY Fed's business activity index falling -4.3 points to -10.1, indicating a modest contraction in regional service-sector activity.
The business climate index improved 10.0 points to -37.3, suggesting conditions remain significantly worse than normal but were somewhat less negative than in May.
1
1
2
124
Supply conditions deteriorated further, with the supply availability index rising to -10.6. While the pace of deterioration eased slightly, firms continue to report worsening availability of inputs and supplies.
1
65
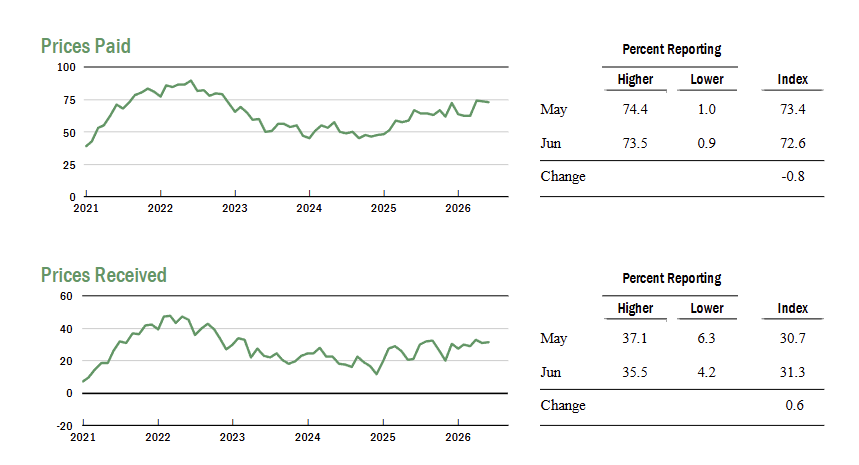
Looking ahead, optimism remains limited. The future business activity index was little changed at 8.3, indicating expectations for only modest growth over the next six months. Capital spending plans remained soft, and firms expect supply availability to continue worsening despite some easing in expected input cost growth.
53
🇺🇸 US housing starts crashed -15.4% MoM and -8.7% YoY to an SAAR of 1.177 mil (vs 1.440 mil expected) in May.
The decline was due to a -41.6% MoM drop in multi-family starts, the lowest pace in more than a year.
1
1
1
130
Building permit activity was more stable, down -0.7% MoM and -0.2% YoY to a SAAR of 1.413 mil. Again, the weakness was in multi-family permitting, down -3.5% MoM.
77
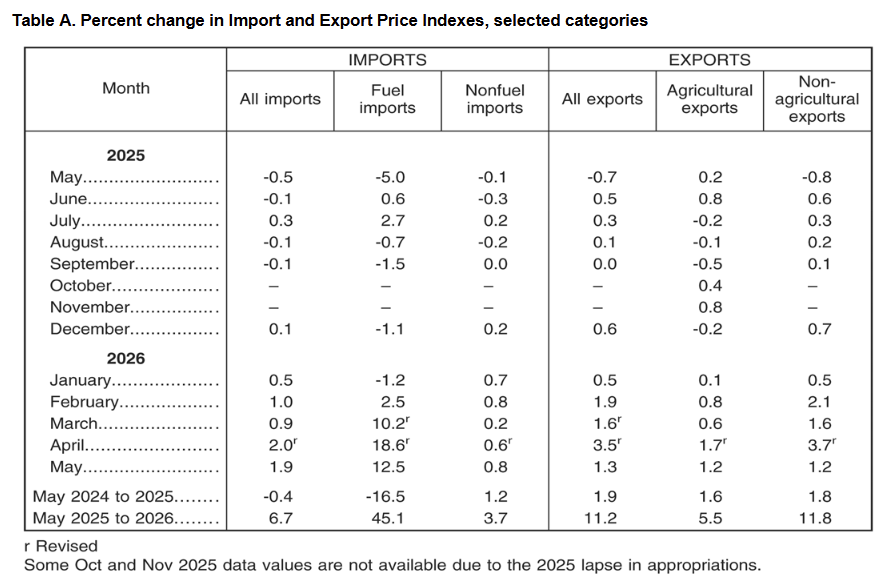
🇺🇸 US import prices continued to rise in May, up 1.9% MoM (vs 0.9% MoM expected) and 6.7% YoY, accelerating from 4.2% YoY in April. Fuel import prices saw their third straight double-digit gain, up 12.5% YoY.
US export prices also saw a third straight strong gain, up 1.3% MoM and 11.2% YoY in May, driven by stronger agricultural and non-agricultural export prices.
2
88
🇺🇸 US private employment increased at an average pace of 25.5k in the four weeks to May 30th, down from an average pace of 29k in the four weeks to May 23rd.
1
1
192
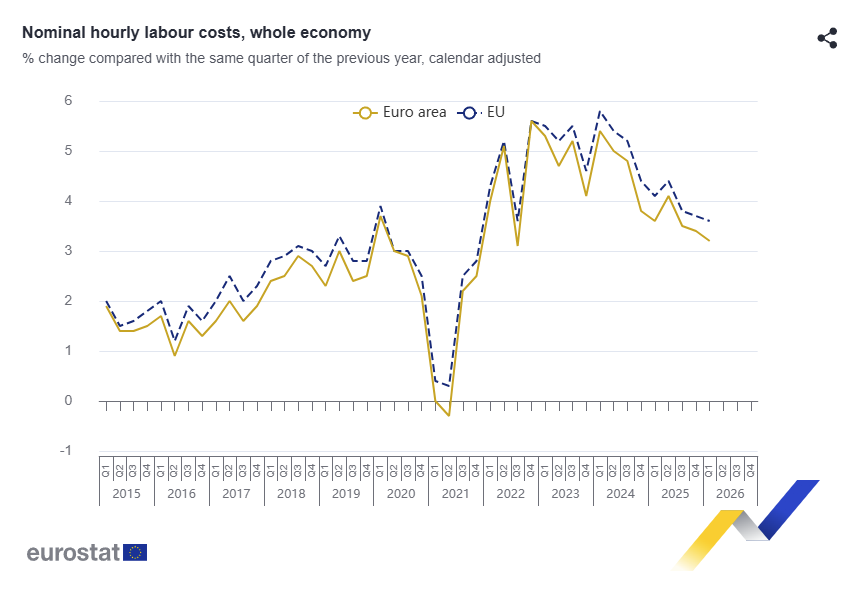
🇪🇺 Euro area labour cost growth remained firm in Q1 2026, with hourly labour costs rising 3.2% YoY, pointing to continued wage pressures despite signs of broader economic slowing.
The increase was driven primarily by wages and salaries, which rose 3.4% YoY, while non-wage labour costs increased 2.9% YoY. Wage growth continues to outpace non-wage compensation costs, keeping underlying labour cost inflation elevated.
While labour cost growth has moderated from the peaks seen in recent years, the pace remains well above levels consistent with the ECB's inflation target, suggesting wage developments are likely to remain an important factor in the inflation outlook through 2026.
59
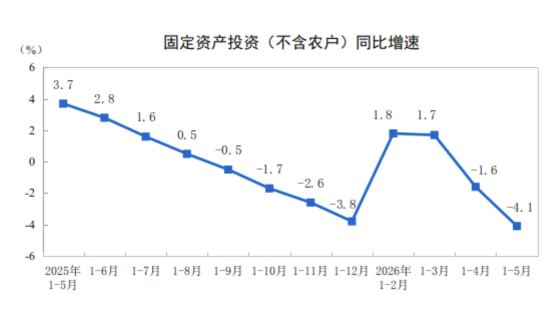
🇨🇳 China's investment picture continued to deteriorate in May as fixed asset investment fell -4.1% YoY through the first five months of 2026 and declined -1.91% MoM.
The monthly figures are particularly concerning, with investment now falling for three consecutive months: -1.03% MoM in March, -2.32% MoM in April, and -1.91% MoM in May. The latest reading extends one of the sharpest sustained declines in investment activity in recent years.
Weakness remains broad-based. Private fixed asset investment fell -7.1% YoY, while overall investment by domestic enterprises declined -3.9% YoY. Investment by foreign-invested firms fell -4.3% YoY and Hong Kong, Macau, and Taiwan-invested firms declined -8.7% YoY.
Several key industries saw particularly sharp declines. Education investment fell -12.9% YoY, health and social work declined -12.2% YoY, culture and entertainment fell -11.0% YoY, pharmaceutical manufacturing declined -9.0% YoY, and specialized equipment manufacturing fell -8.0% YoY.
One bright spot remains investment tied to strategic manufacturing. Aerospace and transport equipment investment surged 23.6% YoY, textile investment increased 10.8% YoY, electronics manufacturing rose 6.7% YoY, and investment in intellectual property products increased 9.3% YoY.
Overall, the data points to continued weakness in China's domestic investment cycle, with the ongoing string of large monthly declines suggesting fixed investment remains a significant drag on economic activity.
1
1
122
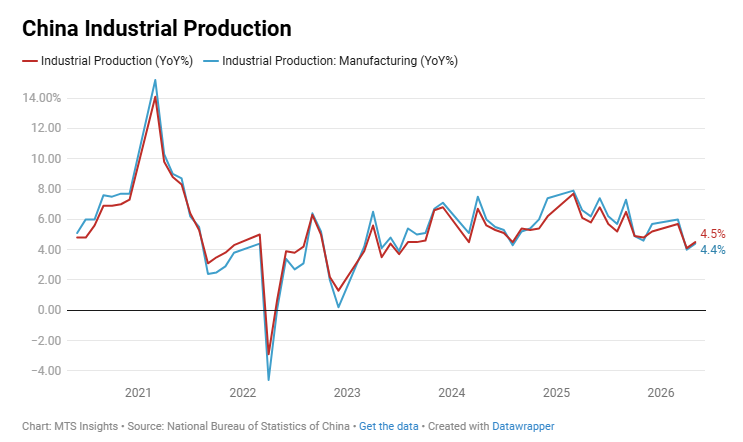
🇨🇳 China's industrial production growth accelerated in May, rising to 4.5% YoY, up from 4.1% in April, while output increased 0.4% MoM. Industrial production is now up 5.4% YoY through the first five months of 2026.
The strength remains concentrated in higher-value manufacturing sectors. High-tech manufacturing rose 15.1% YoY, while computer, communications, and electronic equipment output surged 17.0% YoY. Specialized equipment manufacturing increased 9.1% YoY, automobile production rose 8.3% YoY, and railway, aerospace, and transport equipment manufacturing climbed 7.4% YoY.
Several advanced manufacturing products continued to post strong gains. Industrial robot output jumped 27.9% YoY, integrated circuits rose 22.9% YoY, service robots increased 19.8% YoY, and new energy vehicle production climbed 17.8% YoY.
1
1
1
134
Traditional industries remained much weaker. Non-metallic mineral products output fell -5.6% YoY, non-ferrous metal smelting declined -4.5% YoY, while steel production fell -2.8% YoY and cement output dropped -8.1% YoY. Crude oil processing also declined -9.1% YoY.
Consumer-oriented manufacturing showed mixed results. Automobile production fell -3.2% YoY overall, driven by a -23.5% decline in sedan output, although SUV production increased 13.7% YoY and new energy vehicle output remained strong.
Energy production was a relative bright spot. Electricity, heat, gas, and water supply output increased 7.6% YoY, with total power generation rising 4.2% YoY. Hydropower generation rose 13.0% YoY and solar generation increased 12.1% YoY.
Export-oriented manufacturing also remained supportive, with industrial export delivery value rising 10.1% YoY in May despite softer global demand conditions.
1
1
153
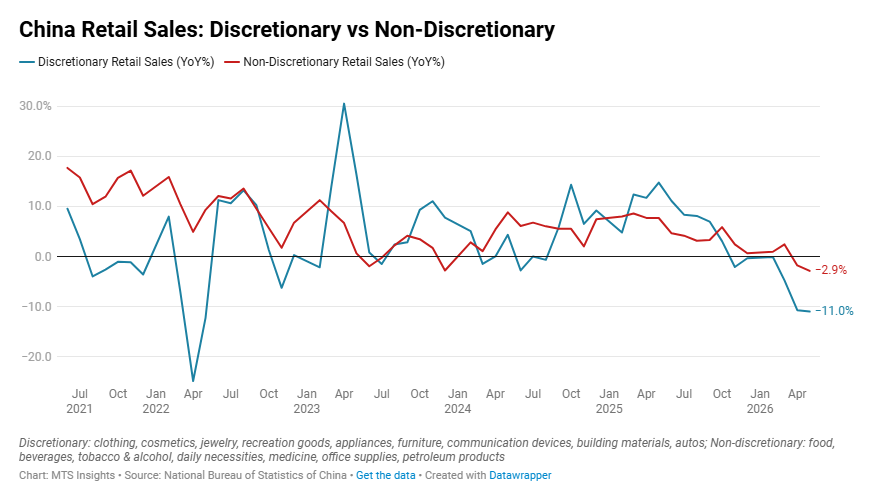
🇨🇳 China's retail sales unexpectedly contracted -0.6% YoY (vs no change expected) in May, the first annual decline since December 2022 and highlighting ongoing weakness in consumer demand.
The broader picture remains one of sluggish consumption. Total retail sales are up just 1.4% YoY year-to-date, while goods sales have risen only 1.2%. The May decline suggests household demand remains one of the weakest parts of China's economy despite ongoing policy efforts to support growth.

1
74
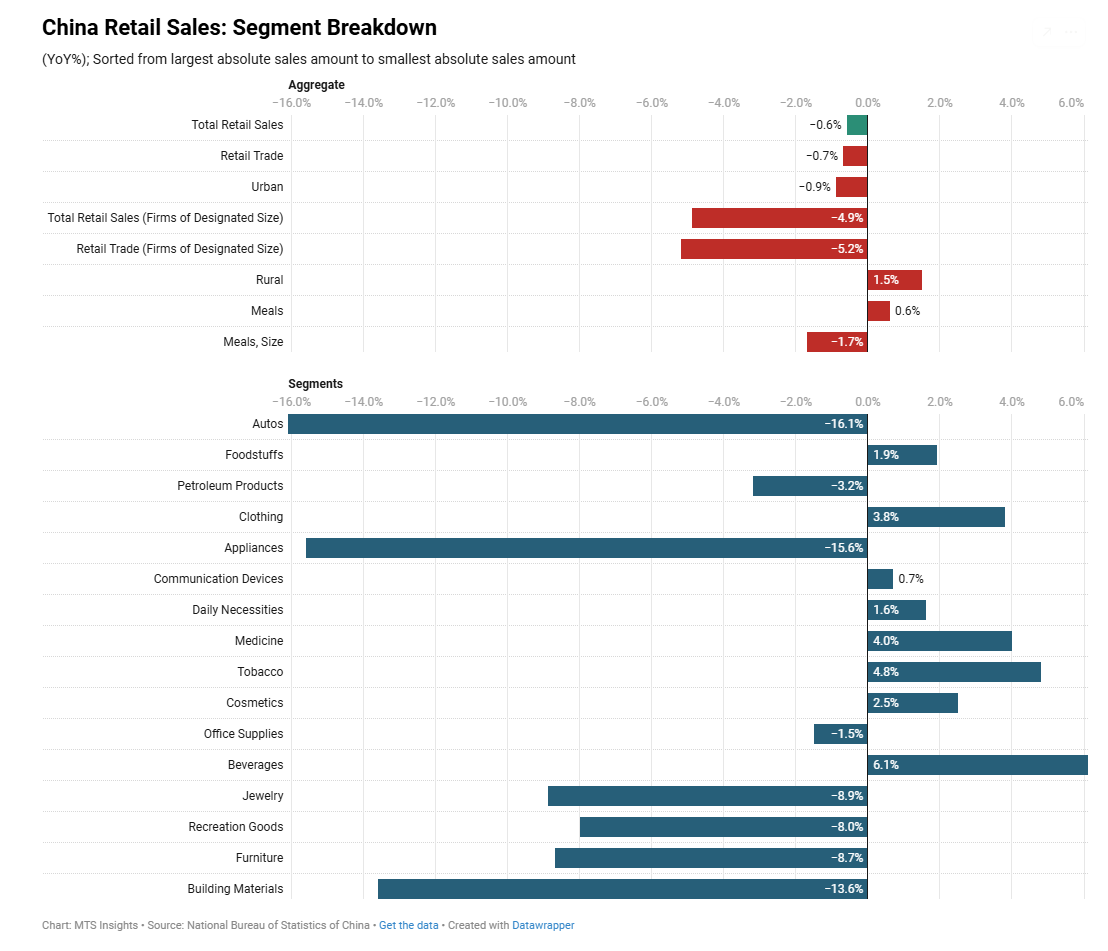
The downturn was heavily influenced by the auto sector, where sales fell -16.1% YoY. Excluding automobiles, retail sales still rose 1.1% YoY, suggesting consumer spending remains weak but not collapsing.
Areas of relative strength included online retail sales, which grew 5.0% YoY in the first five months of the year, along with solid gains in food, clothing, cosmetics, and communication equipment spending.
1
65
Several discretionary categories also struggled. Home appliances sales fell -15.6% YoY, building materials dropped -13.6%, furniture declined -8.7%, and sports & entertainment products fell -8.0%. Retail sales at large retailers contracted -4.9% YoY.
In aggregate, discretionary categories were down -11.0% YoY.
1
57