
Macro Spectrum is set up by a team of traders & strategists working across the globe in various asset classes. For details, please visit macro-spectrum.com
Joined July 2024
- Tweets 744
- Following 15
- Followers 1,374
- Likes 17
149 Photos and videos


What we see ahead: Below is our weekly report on major economic data points in G-7 this week & our expectations:
macro-spectrum.com/opinion/t…
1. Amidst brighter chances of an interim deal between US & Iran with respect to a memorandum of understanding, investor attention will turn to Wednesday’s FOMC meeting – the first of the Kevin Warsh era.
2. With the transition of Fed leadership, key features of the June FOMC meeting are more uncertain than normal. While initially changes might be more incremental than discontinuous, Chair Warsh has promised “regime change” at the Fed. His press conference will provide his first opportunity to detail his vision for what these changes might look like.
3. We expect a status quo on rates from FOMC with a hawkish FOMC statement watered down by new Fed Chair Kevin Warsh comments in post policy press conference.
4. In US macro data this week, we have retail sales, existing home sales, initial jobless claims & industrial production. Incorporating CPI and PPI data, we forecast core PCE inflation of 0.34% m-o-m in May from 0.23% in April. This would translate into y-o-y core PCE inflation of 3.43%, the highest reading since October 2023.
5. In UST dated supply. we have $13 BN of 20 year UST auction on Tuesday & $24 BN of 5 year TIPS auction on Thursday.
6. To summarise our views on US economy, while markets are pricing in a 80% probability of 25 bps hike by Dec’26 and some more by mid CY27, we expect that Fed is in for a long pause till Dec’26 as employment remains stable and core PCE remains elevated.
7. So, if the 1yr-1yr US SOFR inches up to 4.10-4.15 levels from CMP of 4.00 levels, we like to receive half risk at these levels & another half at 4.25. Stop to this view is 4.35 and TP is 3.80.
8. In RoW events, we have SNB policy decision on Thursday where we expect a stuatus quo.
9. We also have BOE rate decision on Thursday which is again likely a hold though with 2 member now demanding hike vs one last time. While we expect the BoE to raise rates by 25bp in July (to 4.00%), we also see two subsequent cuts in H2 2027 to take rates down to close to neutral level (terminal 3.50%).
10. We also have the BOJ meeting on Tuesday where we expect a 25 bps hike followed by a neutral press conference which might not support JPY. We expect JPY to test May'24 lows of 162.2 and any MoF intervention is unlikely before FOMC meet on Wednesday.
11. In RoW macro data, we have German Zew Survey data, UK CPI and UK retail sales data this week.
12. On the Iran conflict issue, we believe that we are in final stages of an interim deal which could come any time today or tomorrow. Brent prices have cooled down significantly to 87 levels and are likely to test 80-85 levels this week as an interim deal takes place. But in medium term, Brent should stabilise around 90 levels as inventories gets replenished and emergency stockpiles get filled again.
311

Jun 13
June BOJ Preview: The 25 bps Hike Won’t Support JPY: We have released a detailed preview report on the BOJ rate decision on 16th June:
macro-spectrum.com/opinion/j…
1. We expect the BOJ to raise its policy rate (uncollateralized overnight call rate) from 0.75% to 1.00% at its Monetary Policy Meeting (MPM) on 15–16 June.
2. We expect the BOJ to maintain its stance of continuing with rate hikes on the view that real interest rates are very low even as they approach the lower bound of the estimated neutral interest rate range. Given the rise in breakeven inflation (BEI) and persistent downward pressure on the yen, we think the BOJ might add a phrase emphasizing its commitment to price stability in a bid to win the market over.
3. W.r.t Governor Ueda's press conference, we do not expect Governor Ueda to provide any specific views on the pace or conclusion of rate hikes (including the terminal rate). With the policy rate following the prospective rate hike (1.00%) close to the lower bound of the BOJ's estimated neutral rate range (1.1-2.5%), it will be interesting to see whether the BOJ maintains its view that real interest rates are very low.
4. We think the BOJ is likely to announce at the June MPM that it will maintain its current plan for reducing JGB purchases (so-called tapering) through FY26 but stop tapering from April 2027 and leave monthly purchases unchanged at ¥2.1trn.
5. From a market perspective, this week’s BOJ’s 25bps hike may not be hawkish enough for JPY. A stronger anti-inflation message could support JPY, while insufficient hawkishness would leave intervention risk around the 160–163 area in focus. We believe that Ueda might find it difficult to sound hawkish and hence JPY should test the June’24 highs of 162.25. USD/JPY also appears to have recently regained its correlation with the US-Japan 5yr interest rate differential, showing the significance of this week’s BOJ & FOMC decisions. Any MoF intervention might wait till 163-165 levels.
295
Jun 13
June FOMC Preview: Warsh Vs Hawks: We have released a detailed preview note on the upcoming 17th June FOMC meet:
macro-spectrum.com/opinion/j…
1. We expect a status quo in 17th June FOMC meeting with a hawkish FOMC statement. New Fed Chair Kevin Warsh might try to tone down the hawkishness of the FOMC statement but without supporting data, he too might not want to commit too much himself.
2. We expect the Committee to remove an easing bias from the policy statement with unanimous support. The median projections for the federal funds rate are likely to show no changes for 2026 and 2027, followed by one rate cut in 2028. We expect the median longer-run projection to be revised slightly higher.
3. Chair Warsh is unlikely to submit his own economic and policy projections, consistent with his past criticism of forward guidance. In his press conference, we expect he will acknowledge the current hawkish macroeconomic environment but will likely make a case for policy easing in the medium term.
4. Since the April FOMC, US economy has shown consistent trends of strong employment with elevated inflation. Although core CPI inflation slowed to 0.208% m-o-m in May, we expect May core PCE inflation rebounded to 0.34%, driven by PCE components derived from PPI data. On a y-o-y basis, core PCE inflation likely inched higher to 3.43% in May, the highest since October 2023.
4. Fed Speak since the April FOMC has been hawkish. Several FOMC participants explicitly discussed the possibility of a rate hike. But there is still a dovish fraction at FOMC consisting of NY Fed President Williams, Governor Bowman & SF Fed President Daly.
5. Based on recent Feds Speak, we expect the median dots for 2026 and 2027 will rise to 3.625%, indicating no changes from the current rate level for the next one and a half years. In the long run, many policymakers will likely maintain their long-term disinflation scenario as their base case, and we expect the median 2028 dot to be 3.375%, consistent with one rate cut. We expect the longer-run median dot (a proxy of the neutral rate of interest), will be revised up slightly to 3.250% from 3.125%.
6. Since the March FOMC meeting, inflation data have been stronger than the March median projection implied. As a result, we expect the median inflation projection for both the headline PCE and core PCE price indices will rise over the near term.
7. Markets are pricing in a 80% probability of 25 bps hike by Dec’26 and some more by mid CY27. We expect short end pricing to remain around current levels varying between 50-100% of a rate hike by Dec'26.
246
Jun 10
ECB Preview: One hike now, one in September: We have released a detailed report on tomorrow's ECB meeting expectations:
macro-spectrum.com/opinion/e…
1. Tomorrow's ECB meeting might be the start of the phase "recalibration". Mme Lagarde will likely want to deliver as neutral a message as possible.
2. Wth markets pricing two to three rate hikes by December 2026, we believe the bar is high to ‘outhawk’ markets. Markets currently price around 46bp of cumulative hikes in H2 2026; assuming a similar amount is priced going into the June meeting, we would expect marginally less to be priced by the end of the press conference.
3. Tomorrow's ECB rate hike would be to ensure that medium-term consumer inflation expectations do not drift higher and de-anchor, and hence is for signalling purposes. We also believe the ECB’s view on the upper bound for neutral has likely shifted higher (it was previously 2.25% on the narrow band version), which means the ECB could feasibly justify a couple of rate hikes as a signal that it won’t leave inflation expectations or inflation unchecked without adversely affecting economic growth.
4. We expect Mme Lagarde to reiterate the ECB will not allow a repeat of the rise in HICP inflation stemming from the 2022 European energy crisis.
5. Our own view is ECB might hike twice by 25 bps in tomorrow’s & Sep meetings. We like to receive 2yr ESTR around current levels of 2.62 and expect TP of 2.40 levels with a stop at 2.80. This trading view flows from our argument that ECB might find it difficult to out hawk the current market pricing of 71 bps hike in total in REMCY26.
6. The task cut out for Mme Lagarde tomorrow is to preserve the possibility of another hike by reiterating factors that could still require one, while stopping short of signalling that another increase is likely.
149
Jun 7
What we see ahead: Below is our weekly report on major economic data points in G-7 this week & our expectations:
macro-spectrum.com/opinion/t…
1. With more positive news on the labor market last Friday, both Fed officials and market participants will focus on the other side of the dual mandate, inflation.
2. Accelerating job gains and steady unemployment suggest the current policy stance is not restraining the economy. Timely measures of job losses show few signs of stress, while backward looking benchmark data suggest we are unlikely to see a substantial negative revision to NFP later this summer. The unemployment rate has remained stable, and wage growth is decelerating faster than we had expected.
3. Sideways income growth suggests consumer spending should begin to cool later in the summer. But rising confidence in the labor market outlook does not extend to the inflation side of the mandate where pressures are mounting.
4. In US macro data this week we have the all important May CPI, initial jobless claims, May PPI, trade balance etc.
5. We see May core CPI inflation as likely moderating to 0.2% MoM from 0.376% in April as a temporary boost from technical adjustments to rent-related components diminished. Our forecast for headline CPI inflation is 0.454% m-o-m or 4.198% y-o-y.
6. In UST dated supply, we have $58 BN of 3yr UST supply on Tuesday, $39 BN of 10yr UST supply on Wednesday & $22 BN of 30 year UST supply on Thursday.
7. On the Iran conflict, there is no end in sight for the current middle east conflict. With no deal being announced, global crude inventories are nearing very low operational levels. If the Strait of Hormuz does not open by end June, we expect Brent to average 120 in Q3CY26 and 150 in Q4CY26.
8. So to summarise on US economy, we think new inflationary pressures from emerging sources along with anticipated acceleration in May core PCE inflation will keep policymakers vigilant on inflation risks. We maintain our Fed call of no changes in the policy rate through the end of 2027, but the balance of risks seems to be shifting toward the hawkish side.
9. We do not have any strong views on the US yield curve now. But we remain ve on DXY. Last week close was above 100 which is a ve sign for DXY. We now expect 100.60 and subsequently 102 as next target levels for DXY.
10. In RoW events, we have ECB meeting on 11th June where we see a neutral 25 bps hike followed by another 25 bps hike in Sep. In Eurozone economic data this week, we have German factory orders & German industrial production.
1
2
254
Jun 7
US CPI MAY’26 PREVIEW: Below is our detailed preview note on the US CPI May'26 data due on Wednesday:
macro-spectrum.com/opinion/u…
1. We see core CPI inflation as likely moderating to 0.2% MoM from 0.376% in April as a temporary boost from technical adjustments to rent-related components diminished.
2. Our forecast for May core PCE inflation is 0.33% m-o-m, up from 0.24% in April, which translates into its y-o-y change rate of 3.4%. Our forecast for headline CPI inflation is 0.45% m-o-m or 4.2% y-o-y.
3. Core goods inflation looks like a tug of war between waning tariff impact and newly emerging price pressures.
4. We expect super core inflation moderated due to a lack of hotel price inflation and negative residual seasonality.
5. Regular rent and OER inflation in April were boosted by positive payback after last year’s carry-forward imputation in October. Without the impact from this technical adjustment, inflation of rent-related components should return to a gradual downward trend in May.
6. On a whole, the laser focus of current Fed from inflation risks is unlikely to be wavering by May's CPI report. Strong aggregate demand, the AI investment boom, and a series of supply shocks all pose upside risk to the medium-term inflation outlook.
7. We maintain our Fed call of no changes in the policy rate through the end of 2027 although market is currently pricing in 25 bps of hike by end CY26.
8. We do not have any strong views on the US yield curve now. But we remain ve on DXY. Last week close was above 100 which is a ve sign for DXY. We now expect 100.60 and subsequently 102 as next target levels for DXY.
232
Jun 6
Crude’s calmness is scary: We have released a detailed report on what are reasons driving current calmness in Crude prices & how this calmness can get shattered if by end June SoH does not open:
macro-spectrum.com/opinion/c…
1. Even as the Iran conflict has completed more than 3 months, crude prices have been remarkably calm. If we were asked in Jan that where do we see Brent if SoH (Strait of Hormuz) was closed for 3 months, our answer will have been north of $120. So why this divergence between analyst expectations and the real market. And how long this divergence can continue if SoH does not open up.
2. As for the first question of why, the following are the reasons we can think of: 1) actual supply losses are lower than reported 2) demand losses are higher than estimated.
3. On the supply side, we estimate around 1.5-2 mbpd of crude being still supplied by dark ships. We also see increased supply from US, Brazil & Venezuela. On net, we estimate that incremental non-Gulf supply added about 2.1 mbd in March and 2.4 mbd in April yet nowhere near enough to replace the roughly 16 mbd of lost Middle East oil supply.
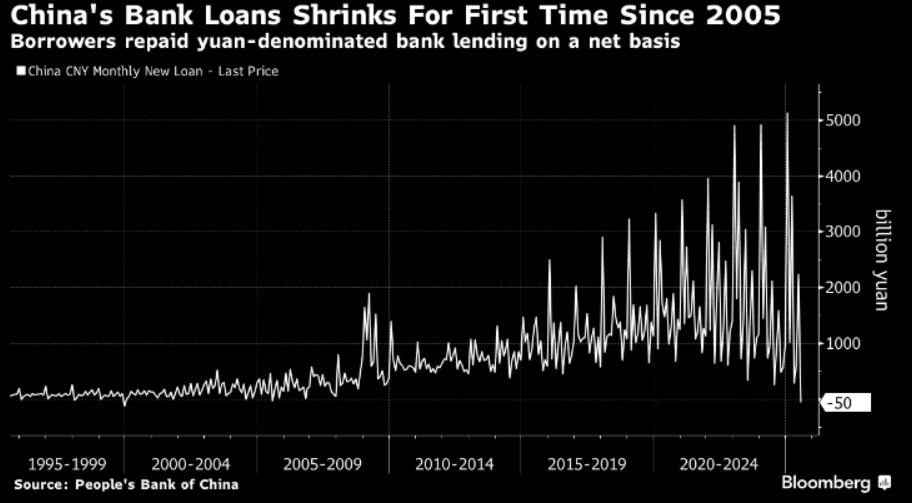
4. On the demand side, China has absorbed a disproportionate share of the adjustment in May. China slashed its crude imports by 3.8 mbd compared to year-ago levels, accounting for roughly 74% of the remaining decline in global crude imports relative to the 2025 average—effectively taking the hit and allowing other countries to stabilize their intake.
5. Also observed global oil inventories, including crude and products, have fallen by 4.6 mbd, an absolute drop of about 450 million barrels. Given the pace of draws, we still expect inventories to reach stress levels somewhere in late June, with operational floor levels approached by September.
6. Preliminary consumption data suggest demand fell by 1.9 mbd versus year ago levels in March well beyond the 0.6 mbd decline most of the analysts had pencilled in, given that physical supply was still landing. Going forward there could be demand declines of 3.0 and 4.2 mbd year-over-year, respectively, corresponding to demand destruction of 4.9 and 5.6 mbd in April & May.
7. Hence, the piece which is keeping the calm in crude prices is inventory. But the rate at which it is drawing down, we are very near to bare minimum operational levels. Hence, if SoH does not open by June, Crude can’t remain calm for ever. In such a scenario, we see average Brent 120 for Q3CY26 & 150 for Q4CY26 irrespective of above-mentioned supporting factors.
2
2
434
Jun 6
Is the Fed’s next rate action a rate hike: We have released a detailed opinion piece on if the next rate action from Fed is a hike:
macro-spectrum.com/opinion/i…
1. In yesterday’s May NFP report, total employment rose 172k, which, along with upward revisions, sent the three-month average to 188k—the best in just over three years. To give a context, the neutral rate for NFP is considered 50k currently.
2. The unemployment rate ebbed just 4bp with the rounded rate holding steady at 4.3%.
3. We have been writing in recent opinion pieces how the US economy is red hot and we have bullish on DXY since May.
28th May’26
macro-spectrum.com/opinion/t…
23rd May’26
macro-spectrum.com/opinion/k…
16th May’26
macro-spectrum.com/opinion/w…
4. What was more interesting to us was the market reaction to the NFP data yesterday. Asset markets (especially the FX market) started beginning to pay attention to economic data, setting aside the last 15 months’ concerns about tariffs, Greenland, oil, Iran, etc. This is reflected in the rise in US real interest rates to their highest levels since June 2025, and the 0.7% increase in the BBDXY after the NFP release.
5. But is there a way to counter the rate hike theory? Yes, there is the current pace of unit labour cost inflation in the nonfarm business and nonfinancial corporate sectors which is very unthreatening. As long as Warsh & co can prove that labor costs are not pushing inflation higher, they can wait out the strong economic data in short term.
6. Markets are now pricing in a full 25bps hike from the FOMC by end-2026, and almost two hikes by mid-2027.
7. So, the question we ask ourselves is: Can the next Fed action be a hike. Incoming Chair Warsh is likely to bring a more powerful dovish voice to the FOMC to replace outgoing Governor Miran, and Warsh is likely to have some allies on the Board and among some regional bank presidents, even as others (not all of whom are voters this year) have turned more hawkish. We expect it will be a more gradual process to reach consensus on the FOMC to hike rates, although we continue to see some chance it could occur by year-end. The jury is still out. We don't know yet.
1
1
303
May 31
What we see ahead: Below is our weekly report on major economic data points in G-7 this week & our expectations:
macro-spectrum.com/opinion/t…
1. The past week saw two important updates that may be consequential for the US economic outlook this year. First, data that feed into current-quarter GDP tracking have continued to show notable resilience in the face of the sharp contraction in oil supply and jump in energy prices. Second, front-month crude oil futures declined over $10/bbl last week on reports of an extended ceasefire that could re-open the Strait of Hormuz. While uncertainties remain, the acute risk phase for the global economy should be over if tankers can begin moving again.
2. In US macro data last week, core PCE came in slightly softer at 0.24% MoM but YoY remained at 3.3%. Trimmed-mean PCE — which Chair Warsh has highlighted as an alternative gauge of underlying inflation — eased to 2.3% y-o-y, about a full percentage point below core PCE. We believe that trimmed-mean PCE may be understating inflation risks, particularly because it has been slow to capture shifts in goods inflation dynamics and the recent change in the skewness of the inflation distribution. PCE trimmed-mean inflation underestimates the underlying inflation by 48bp on a y-o-y basis.
3. Coming to next week, the economic calendar may move back to the forefront for market participants. The main highlight will be Friday’s May employment report where we expect headline 105k forecast vs. 115k previously. Our forecast would bring the 3m average of NFP growth up to 136k – the strongest since December 2024. For our detailed preview note on the same, please see below:
macro-spectrum.com/opinion/u…
4. In other US macro data next week we have ISM services, ISM manufacturing, JOLTS & initial jobless claims. We do not have dated UST supply next week.
5. Fed speak last week reflected a broad-based shift towards a more hawkish tone on the FOMC, even as most officials continue to expect disinflation in coming months as their base case. Skepticism of labor productivity-led disinflation has been a focus for the FOMC recently. Several officials acknowledged AI’s potential to lift longer run growth but remain unconvinced that productivity gains can reliability ease inflation in the near term.
6. On Iran conflict, no clear resolution in sight yet. US President Donald Trump has demanded changes to a proposed agreement with Iran, triggering a fresh round of negotiations that could delay a final deal by several days. Our own take is a temporary 60-day agreement is likely this week around Wednesday considering both parties are agreeing to not seek war though they do differ on two major topics: SoH and enriched Uranium status.
7. To summarise on US economy, with Iran conflict continuing for more than 2 months now, we expect Fed to remain on hold for next several months till end CY26. Any future inflation developments might be the most-likely catalyst for an eventual resumption of rate cuts or pivot to hikes.
8. In RoW data, we have Eurozone May HICP data on Tuesday which is expected to accelerate to 3.3% from 3% in April. We see two ECB rate hikes in June and Sep this year as a result of higher energy prices.
158
May 31
US NFP MAY’26 PREVIEW: We have released our detailed preview report on May NFP (data due on this Friday) as below:
macro-spectrum.com/opinion/u…
1. We expect nonfarm payrolls (NFP) remained elevated at 105k in May against April's no of 115k and current market estimate of 89k. Our forecast would bring the 3m average of NFP growth up to 136k – the strongest since December 2024.
2. Lead indicators have been constructive, continuing to signal an acceleration in employment growth. ADP’s weekly private employment measure remained elevated through April and early May, and continuing jobless claims stabilized close to a multi-year low.
3. The unemployment rate likely remained steady at 4.3%. Measures of hiring and labor demand have shown tentative signs of a rebound, which we expect will lead to a gradual decline in the unemployment rate in H2 2026.
4. Average hourly earnings growth likely rebounded to 0.4% m-o-m. A negative calendar effect and an increase in the average workweek weighed on AHE in April, but underlying wage growth appears elevated, leading us to expect positive payback this month. Service-sector surveys show a pickup in expected wage growth, and the JOLTS quits and hires rates have stabilized in recent quarters.
5. Summary: A report in line with our expectation would likely keep Fed officials focused on inflation risks. We expect the Fed is likely to keep policy on hold in REMCY26, with inflation developments the most-likely catalyst for an eventual resumption of rate cuts or pivot to hikes.
6. From a market perspective, if the report comes in line with our expectations, we expect US bond yields to move higher by 5-6 bps from pre-event levels across the curve. We continue to believe in 2-10 US SOFR steepener as we believe 10yr UST yield has far higher potential to climb up in light of fiscal worries, continued equity traction & sustained selling by foreign investors. Our stop loss on 2-10US SOFR steepener is at 14 level and currently it is at 17. We have a profit target of 40 on this trade.
7. We expect DXY to remain strong post data release.
144
May 30
AI’s IMPACT ON US INFLATION & EMPLOYMENT: Unlike Kevin Warsh, we have a different view on AI's impact on US inflation & employment:
macro-spectrum.com/opinion/a…
1. Recent advances in artificial intelligence (AI) have raised hopes of a boost to economic growth. Many market participants believe that AI has the potential to be the most important general-purpose technology of our era. The recent inroads of generative AI in everyday applications in particular promise widespread efficiency gains. But we see a different picture.
2. AI boosts GDP by raising productivity and investment, with variable effects on the demand and supply sides of the economy. The output gap is the difference between aggregate demand (GDP) and aggregate supply (potential output). At first, supply exceeds demand in most regions, due to the concentration of early adoption of generative AI (GenAI) in “easy-to-learn” tasks. This leads to a swift increase in productivity that significantly surpasses the initial investment. Subsequently, as AI investment extends to less profitable areas of “hard-to-learn” tasks, the situation evolves with demand outpacing supply. This results in a positive output gap that puts upward pressure on prices. In the widespread AI adoption scenario, the effects on the output gap are twice as large as in a conservative scenario.
3. Hence in short term, AI raises productivity and lowers marginal costs, exerting downward pressure on inflation. But in long term, by nature of AI, intensely dependent on energy & commodity space along with limits on learning skills, AI leads to an uptick in inflation. In a conservative scenario, commodity prices may rise by between 1% and 2% by 2033 due to an AI induced increase in demand. In the widespread adoption scenario, the projected effects are twice as great.
4. A natural starting point in this analysis is the familiar view of AI as a productivity-enhancing general-purpose technology: by improving efficiency, compressing unit costs, and expanding effective capacity, AI can act as a structural disinflationary force. At the same time, the macroeconomic footprint of AI is not confined to productivity. Scaling and deploying AI requires costly complementary inputs and infrastructure, can reshape product-market pricing and market power, and can alter labor-market rents and wage-setting wedges. Moreover, the diffusion of AI has increasingly taken the form of an investment and infrastructure wave—most visibly through rapid expansion of compute capacity and data-center build-out—that operates as a demand impulse as well as a supply-side transformation. The sign, magnitude, and persistence of AI’s effect on inflation therefore cannot be inferred from a single channel or a single dataset; they are joint empirical and quantitative objects that depend on how these mechanisms interact in general equilibrium.
5. The net inflation effect of AI is not mechanically disinflationary even when productivity gains are present. A rise in productivity is a mechanism that exerts a systematic downward force on inflation by reducing unit costs, but it competes with forces that can raise marginal costs or desired markups during diffusion. AI specific input costs arise because the deployment of AI at scale requires scarce complementary resources—compute, energy, cooling, networking, and specialized capital—whose shadow prices can rise when capacity expands rapidly or adjustment is slow.
6. On the employment side, again we do not see any wide spread impact on employment due to AI adoption. Total job postings have been broadly stable, there is limited evidence of a change in the low firing environment across key layoff indicators & WARN indicators show no broad-based impact of AI as layoff remains low. To summarise, AI is still not a threat to US employment in general. In fact, wage growth remains the highest for graduates with bachelor degrees or higher degrees. There is limited relationship between wage growth & AI adoption according to average hourly earnings.
7. So, when the new Fed Chair Kevin Warsh says that he believes AI will lead to marked productivity gains & lower inflation, he is only looking at short term trend. Long term AI is inflationary.
1
300
May 28
THE STATE OF US ECONOMY-RED HOT: We have released the following report on the current state of US economy:
macro-spectrum.com/opinion/t…
1. While geopolitical uncertainty has surged since the start of the US-Iran war in late February, unlike last year’s “Liberation Day” shock though, the war has had little impact on a nascent cyclical acceleration. The investment acceleration we had expected to take hold in 2026 arrived ahead of schedule, with 2025 marking the strongest full year of equipment capex growth since the post-GFC recovery.
2. What began as a narrow surge in the tech/AI sectors has broadened to other industries and types of equipment spending. Capex has remained resilient in March and April. Capital goods shipments and imports have continued to accelerate along with domestic production of business equipment. Hyperscalers ramped up their capex guidance for FY 2026 in Q4 earnings calls around $130 BN higher than what they forecasted in Q3. This was further pushed up by ~$55bn during Q1 earning announcements, partly due to higher prices amid capacity constraints.
3. Despite the recent rise in interest rates, broader financial conditions appear accommodative, and bank C&I lending has continued to rise at a 15-20% annualized pace in recent weeks. Adding to the tailwinds for capex, tariff refunds have begun to ramp up. A cashflow windfall will likely support spending alongside strong growth in revenue and profits.
4. The only weak spot seems to be consumer spending. Consumption has been resilient since the start of the US-Iran war. This strength is likely unsustainable though, with households relying on one-time stimulus cashflows to offset higher energy costs. We estimate households received ~$45bn in additional tax refunds this year due to the One Big Beautiful Bill Act passed last summer. For comparison, through May, we believe higher gasoline prices will have cost consumers ~$30bn.
5. To summarise, we expect business investment to grow 7.8% in 2026 on a Q4/Q4 basis, driven by strong AI investment demand, expanded expensing provisions, and fading drags from the normalization of factory construction and tariffs. Coupled with last week’s GDP tracking data, this implies 2026 GDP growth of 2.1% on both a Q4/Q4 and full-year basis.
6. It's on the inflation side where we see FOMC members turning hawkish last few weeks. Most notable was the hawkish pivot in an outlook speech by Governor Waller, who has represented the dovish core of the Committee. Waller indicated that his risk assessment had shifted towards inflation, which has replaced the labor market as the “driving force” behind monetary policy in the months ahead.
7. Even household interest rate expectations are building in inflation expectations similar to financial markets. Specifically, the net interest rate expectations indicator from the Conference Board clearly shifted in the direction of foreseeing higher rates over the next twelve months.
8. The current difference between the 2-year Treasury yield and the effective fed funds rate is ~40bps but this week high was 50 bps. Historically, that spread has been a reasonably good leading indicator for future changes in the fed funds rate. For example, over the past three decades, the difference between the 2y yield and fed funds rate leads the year-over-year change in the latter by roughly eleven months with a peak correlation of 66%.
9. To conclude, recent Fed communications are consistent with a Fed that is well positioned near neutral but increasingly concerned that inflation may prove more persistent. While our baseline remains that the Fed is on hold near neutral indefinitely, we now see equal risks of a rate increase compared to a rate cut as the monetary policy outlook continues to be impacted by developments in the Middle East. We still think it is too early to have a convincing view on either a cut or a hike at least till we get clarity on the middle east conflict.
10. We will be soon releasing a detailed piece on AI’s impact on US inflation. We believe while AI’s productivity gains put a cap on long term inflation, short term price impact of AI capex is leading to elevated goods inflation via semiconductor chips prices, computer flash memory & old computers.
244
May 24
What we see ahead: Below is our weekly report on major economic data points in G-7 this week & our expectations:
macro-spectrum.com/opinion/t…
1. After Monday’s Memorial Day holiday, market participants will come back to a steady flow of data and Fedspeak, both of which will be evaluated in the context of Governor Waller’s hawkish speech last week.
2. US data remain hawkish, pointing to robust growth and building price pressures. Manufacturing and business capex continue to accelerate. The preliminary S&P Manufacturing PMI rose to a multi-year high.
3. We now expect the Fed to remain on hold for REMCY26 (versus our prior forecast of one cut in Q4CY26). Incoming Fed Chair Kevin Warsh is likely still motivated to cut rates. However, we expect easing political pressure, elevated inflation, and strong cyclical growth to support a prolonged pause.
4. In US macro data this week we have PCE, Q1GDP 2nd estimates, consumer confidence, intial jobless claims.
5. In dated UST supply, we have $69 BN of 2yr UST auction on Tuesday, $28 BN of 2yr FRN auction on Wednesday, $70 BN of 5yr UST on Wednesday again & $44 BN of 7yr UST auction on Thursday.
6. On the Iran conflict, Trump indicated in a post on Saturday that a peace deal was imminent but we have seen so many slips and misses that we wait for the final announcements from both sides. Our own view is that the ceasefire extension of 60 days is very likely. Hajj is wrapping up right now. Many stay 5–7 days afterward for Tawaf, departures, etc., so Saudi soil remains ultra-sensitive into early June. Iran is unlikely to escalate unless attacked in this window for fear of cratering its Pakistan channel. In US we have the world cup Football starting from 11th June till 19th July during which time the US side might like to have lower security threats.
7. In short term we see Brent cooling down to 90-100 range if the ceasefire does get announced as Trump indicated. We will be releasing a detailed report on the new Gulf situation post the ceasefire including our views on Brent future trajectory. Currently it is too early to give a definitive view in light of many failures on peace initiatives in the past two months.
8. With Iran conflict continuing for more than 2 months now, we expect Fed to remain on hold for next several months till end CY26. Good inflation complimented by sustained service inflation implies an elevated core PCE which does not give space for Fed to cut in light of a stable employment situation.
9. We are now bullish on Dollar and see 102 with a stop at 98, CMP is 99.25. Please see our detailed report on the same:
macro-spectrum.com/opinion/k…
10. In RoW macro data we have Australian CPI on Wednesday & Eurozone individual countries HICP inflation nos on Friday.
282
May 24
SpaceX IPO: A Moonshot Valuation Play: We have released a detailed report on why SpaceX IPO remains a moonshot valuation play for public markets even though the problem statement the company is trying to solve is perhaps more suited for private credit:
macro-spectrum.com/opinion/s…
1. SpaceX is perhaps the most ambitious IPO ever even by Elon Musk standards. It is attempting to secure a valuation approaching $1.75 trillion despite reporting significant operating losses across major divisions.
2. In it's prospectus filed last week, SpaceX sees a total addressable market of $28.5 trillion and said in its prospectus that identifying and creating trillion-dollar market opportunities is one element of its “repeatable business model.” The vast majority of its addressable market is outside of SpaceX’s existing businesses. There’s an $870 billion market for Starlink’s broadband business, a $740 billion market for Starlink’s mobile unit, a $600 billion digital advertising market for X to pursue and a $2.4 trillion AI infrastructure market. Then there’s enterprise applications, a $22.7 trillion market, based on an estimate from the Digital Cooperation Organization.
3. The issue is not with this forecasts. In fact what SpaceX is doing or attempting to solve is actually unique. It is a leader in launch services market. In fact it's launch revenue understate economics. SpaceX's launch sales were $4.1 billion in 2025, though that understates the segment's full economic power because services for its largest customer, the Connectivity division, aren't included in reported revenue and would likely add another $10-$12 billion. That could make launch a top revenue contributor. SpaceX has no worthy competition except perhaps Blue Origin. In 2025, SpaceX accounted for 81% of large rocket launches vs. 46% in 2019. Measured by kilograms, SpaceX lifted 85%. SpaceX is also well positioned for the Golden dome play via launch, interceptors & satellite communications.
4. It is at the perfect place for defence space inflection point although there is a bit of regulatory risk. Once certified for national-security missions, that payload jump can enable faster missile-warning deployments, rapid satellite replacement and large-scale LEO constellations at a pace no current launcher can match. The near-term ceiling is regulatory restrictions, where the FAA has capped Starbase at 25 Starship launches annually, and SpaceX is pursuing overseas sites to exceed that limit.
5. The problem happens when this vision needs support in public markets. Public investors are being asked to support one of the largest valuations in modern market history while accepting unusually high execution uncertainty.
6. Interestingly Elon Musk controls roughly 85% of SpaceX voting power through special class shares, limiting the influence outside shareholders will have over strategic decisions after the IPO.
7. SpaceX is targeting $75-$90 BN raise at a valuation of $1.75 TN. To put it in context, the entire U.S. IPO market raised roughly $170 billion in 2025, across more than 1,300 deals. If one uses SOTP model, Starlink’s consumer business might be valued at 30 times revenue, launch services at perhaps 5 times & the direct-to-cell segment at around 35 times. Those are very aggressive numbers. But the xAI business had revenues of roughly $500 million in 2025 — and at a $250 billion valuation, it’s being priced at 500 times trailing revenue. At the full $1.75 trillion IPO target and SpaceX’s projected 2026 revenue of around $28.5 billion for the combined entity, we arrvie at forward revenue multiple of roughly 61 times. On a trailing basis, the multiple is closer to 100 times. To justify a valuation at that level, SpaceX needs to sustain roughly 40% annualized revenue growth for a decade.
8. Moonshot organisations such as SpaceX are best funded by private credit which has the comfort of long gestation capital with them. Using public markets to raise funds does not serve the purpose of SpaceX or the public investor.
9. In the end the only winner in this IPO is Elon Musk himself. He’s the largest single shareholder, and a $1.5 to $1.75 trillion valuation would make him, by most estimates, the world’s first trillionaire. And that is where we believe the objective of this IPO lies.
10. Also SpaceX is targeting a listing on the Nasdaq and has reportedly been pushing for fast-track inclusion in the Nasdaq 100 — within just 15 days of listing, compared to the standard waiting period of up to a year. The logic is straightforward: Nasdaq 100 inclusion forces passive index funds to hold the stock, providing an automatic boost to demand post-IPO. The Nasdaq is apparently open to adjusting its rules. Welcome to the new world of Elon Musk where public funds will crown him the world's 1st trillionaire.
1
210
May 23
Mr Precious Metal doesn’t like Mr Bond Vigilante: We have released a detailed report why precious metals are not expected to do well in H2CY26 in light of rising bond yields globally:
macro-spectrum.com/opinion/m…
1. Last two weeks were unique because we saw rising bond yields globally along with rising DM equities but falling precious metals. DM yields sold off sharply across jurisdictions last 2 weeks driven by elevated energy prices amid inconclusive headlines on the Middle East from the Trump-Xi summit, a sharp increase in UK political noise and heavy supply across several markets.
2. We now see this trend continuing even if there is a Iran deal. The global economy is in the midst of a cyclical upturn in goods spending, which is putting upward pressure on prices. If our baseline view is realized—that is, that the Strait of Hormuz soon reopens and crude oil prices linger close to $100/bbl—a mix of goods sector cost pressures, tightening labor markets, and firm pricing power could push global core inflation well above 3%. Such an outcome would set the stage for a new round of global monetary policy tightening.
3. Core inflation is now sticky globally because of reduced supply chain resilience, service inflation remaining high, rise in short term inflation expectations & the fact that inflation is not any more range bound. Hence in line of above facts, we see short end yields globally remaining elevated during H2CY26.
4. This does not bode well for precious metals. Higher yields raise the opportunity cost of holding non-yielding assets, and markets are increasingly entertaining the possibility that the Federal Reserve may have to keep monetary policy tighter for longer or even raise rates again.
5. We also looked at correlation of Gold & Silver with DM short end yields i.e. 2-year bonds. As expected, precious metals have a significant -ve corelation with short end DM yields. The more the DM short end yields remain elevated, the more precious metals become unattractive due to lack of carry.
6. For precious metals, the risk-reward setup is becoming increasingly asymmetric. They are vulnerable to a larger correction if markets price in more rate hikes, stronger real yields and a firmer U.S. dollar which is our view too.
7. Rising borrowing costs, persistent inflation, elevated energy prices and deteriorating fiscal dynamics could push markets closer to a breaking point. Hence, we now see Gold testing 4000 levels & Silver testing 65 levels in H2CY26. The stop to this view is Gold at 4900 & Silver at 85. CMP of Gold is 4500 and Silver is 75.
285
May 23
KING DOLLAR IS BACK: We have released a detailed report today on why we believe Dollar strength is back and Dollar can rally significantly in H2CY26:
macro-spectrum.com/opinion/k…
1. Global macro-outlook has turned ve for Dollar. USD is benefitting from: 1. Carry/ Terms of Trade 2. A more balanced Fed 3. Firmer domestic data 4. Renewed US equity strength.
2. Shifting terms of trade have dictated FX returns in recent months. These ToT shifts should lead to diverging growth outcomes, which have started to become clearer in recent activity data, including the sharp downside surprise in China April activity data and the deceleration in the May flash PMIs for Europe. While there are a number of important exceptions, like CNY and commodity-intensive exporters, the net effect of the AI boom and higher-for-longer energy prices leaves the US looking like a relative outperformer once again.
3. Also the situation in the Middle East which is not mending itself as many would have assumed a month or so ago. Signs that the Hormuz strait will stay clogged for longer can only exert upward pressure on oil prices – with the dollar gaining 0.5-1% per 10% of higher oil prices in our estimates.
4. From the perspective of US macros itself. the US labor market is showing more signs of demand stabilization after months of softness weighed heavily on the USD. US inflation upside surprises are re-emerging, challenging expectations of limited pass-through to core inflation. US equities are in the midst of one of their great ~2m runs ever reinvigorating the notion of dollar-positive US exceptionalism via strength in the tech sector.
5. USD OIS curve is still meaningfully lower than the G10 average. This could narrow two ways - by 1) depricing RoW hikes, or 2) if US rates continue to creep higher on growth/inflation/Fed signalling.
6. On Euro itself, we’ve a bearish-EUR/USD forecast & now expect a range of 1.12-14 in H2CY26. The Euro is among the lowest yielders globally, growth momentum has substantially worsened vs the US, relative ToT deteriorated sharply. The real yield differential has narrowed further, completely reversing the improvement post-German fiscal u-turn in March 2025.
7. On JPY, we remain bearish and believe if not for intervention, JPY might have breached the crucial 162 levels.
8. On GBP too, we remain bearish & see 1.30 levels sooner than later considering last week’s set of poor data & continued political uncertainty.
9. Only AUD & CNH might remain insulated from DXY strength as AUD gets supported by commodity strength & CNH has a high current account surplus supporting it’s resilience.
10. To summarise, we now see DXY moving towards 102 levels in H2CY26 if 98 holds on the downside. DXY is currently at 99.25.
212
May 17
What we see ahead: Below is our weekly report on major economic data points in G-7 this week & our expectations:
macro-spectrum.com/opinion/t…
1. The Strait of Hormuz remains closed and the price of oil remains elevated leading to global bond selloff last week. While US equities mildly corrected on Friday, last week action was in bond markets. 10-year UST yields climbed 25bp over the past week and nearly 70bp since the conflict began. Markets have now fully priced one Fed hike by March, whereas last Friday that was closer to a 10% chance.
2. US economy remains strong as seen in macro data and we now expect Q2 GDP at 2%. The economy benefited from the wave of personal tax stimulus in March and April, and business surveys suggest firms may have brought forward activity to get ahead of future price increases and supply chain delays. The fading tax stimulus would be less of a concern if oil prices were to quickly retrace in coming weeks, but that seems increasingly unlikely.
3. We now expect Brent prices to remain sticky in the low $100/bbl even after the Strait reopening, eventually averaging $95/bbl for CY2026, as the bottleneck will shift from the physical chokepoint of the Strait to tanker availability and strong demand to rebuild inventories. Futures markets are not that far below and see crude still at $91 in December.
4. While the job markets continues to remain stable, inflation worries are front and center. Inflation data released last week were broadly hawkish, pointing to signs of building price pressures. We have revised up our core PCE tracking estimate to 0.30% m-o-m, which translates to 3.3% y-o-y, significantly above the Fed’s target.
5. Tech-related components are emerging as a new source of inflation, offsetting some slowdown in tariff-sensitive consumer goods. PPI’s price index for rubber and plastic products jumped in April. PPI’s truck transportation prices rose at their fastest pace in the series’ two-decade history, driven by higher fuel costs as well as limited capacity in the truck industry.
6. In summary, Fed remains on hold for next several months. We still expect a 25 bps cut in Q4CY26 as an insurance cut if inflation shows signs of stabilising or if there is a resolution on SoH.
7. We were stopped out in our 1yr-1yr US SOFR receive trade as it closed at 4.01 last week above our stop loss at 4%. We continue to like steepeners i.e. 2-10 US SOFR at current levels of 24 for a target of 40 with a stop at 14.
8. This week in US macro data we have Fed minutes, S&P PMIs, IJC, Univ of Michigan survey.
9. In dated supply, we have $16 BN of 20 yr UST auction on Wednesday & $19 BN of 10 year TIPS on Thursday.
10. In RoW data we have Canada CPI, UK CPI, UK fiscal deficit, Japan CPI & GDP along with Chinese activity data.
249
May 16
CROSS ASSET STRATEGY May’26: When times are volatile as they currently, a holistic view on cross assets is necessary for a sound judgement formation. Below is our cross asset strategy for May'26:
macro-spectrum.com/opinion/c…
1. Limited progress on the negotiations between the US and Iran has pushed oil prices modestly higher on the week closing at 109 for Brent, as persistent physical constraints continue to build pressure amid still limited visibility on the reopening of the Strait of Hormuz. We now expect Brent prices to remain sticky in the low $100/bbl even after the Strait reopening, eventually averaging $95/bbl for CY2026, as the bottleneck will shift from the physical chokepoint of the Strait to tanker availability and strong demand to rebuild inventories.
2. DM rates are pricing in hikes aggressively against our modest expectations. The US money market curve (1Yx1Y OIS minus effective Fed funds rate) is now vrly sloped with markets pricing ~30bp of hikes by June’27 (against our expectations of a 25 bps cut in Q4CY26), while €STR and SONIA curves are pricing between 2 -3 25bp hikes by the ECB (75bp) and BoE (66bp) before year-end vs. our call for a cumulative 50bp (June and September) and 25bp (July hike) respectively.
3. In Fx, while the broad Dollar is close to flat over the last few months, that obscures larger shifts under the surface and quietly building Dollar appreciation pressure. We have been emphasizing that terms of trade have been a key differentiator for FX returns in this more divided Dollar environment, and it is increasingly clear that two major forces—the energy shock and AI-driven demand—are responsible for the shortages causing that move. As the past week has demonstrated, we think the clearest risk for a stronger Dollar is if a wider energy shock begins to pressure growth, policy, and prospective returns in other developed countries, particularly Europe.
4. In the credit space, the absolute level of defaults has been trending higher from the very low levels that persisted in 2022/23 but remains near historical median levels. Interestingly, in contrast to the prevailing market narrative related to potential disruption of Software-focused firms, the sector composition mix still skews heavily towards capital industries and consumer-facing businesses. None of the metrics we monitor signal a near-term uptick in expected defaults in the US. In Europe, we still envision a modest increase in defaults through year-end, owing to a more challenging growth, inflation, monetary policy mix.
5. To summarise, we are bullish on 10yr Gilts, 10yr Bunds, bearish on Gold & Silver, bullish on DXY specially against EUR & JPY. We like 2*10 US steepeners and like receiving 1yr-1yr forward US SOFR. We are neutral on equities now and on Brent see a range of 95-120 for REMCY26. We like selling IVs in commodities especially crude and buying IVs in precious metals & DM equities.
200