
Joined August 2019
- Tweets 3,784
- Following 376
- Followers 551
- Likes 3,626
391 Photos and videos

MarigortaLab retweeted

May 21
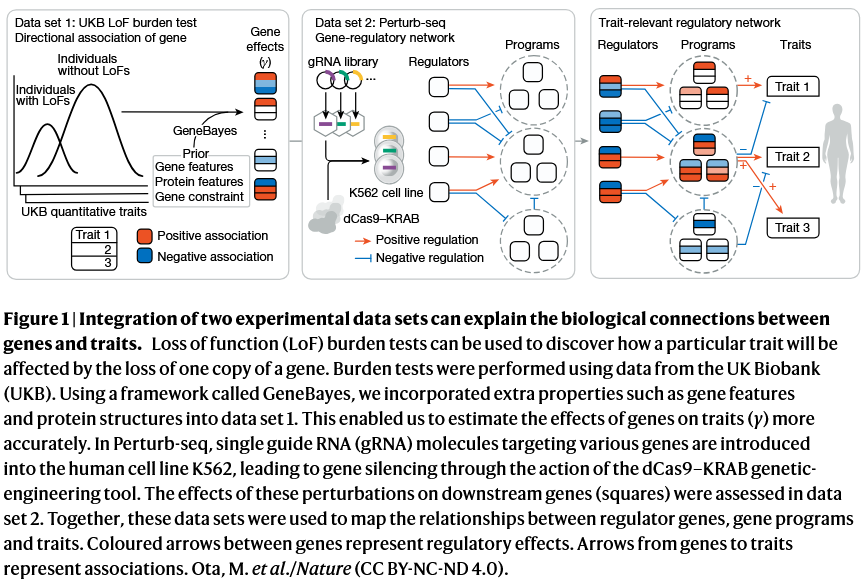
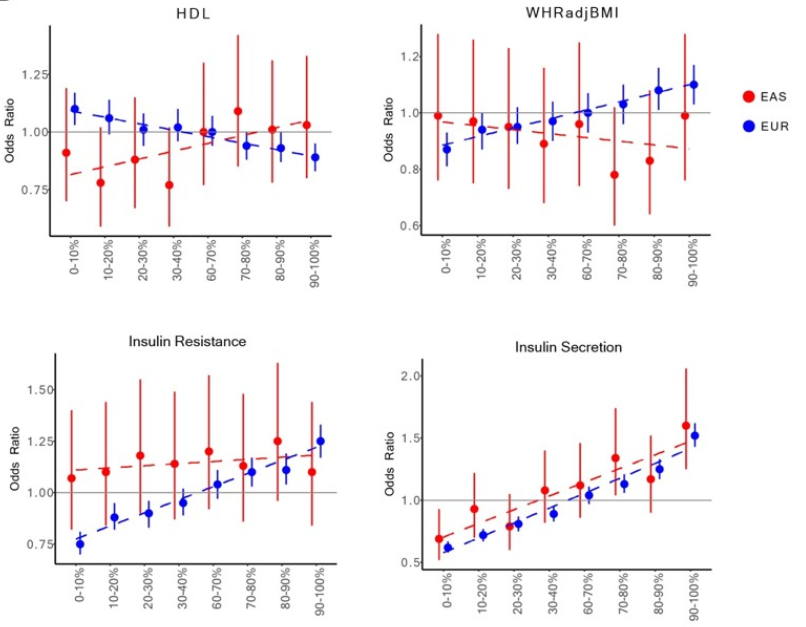
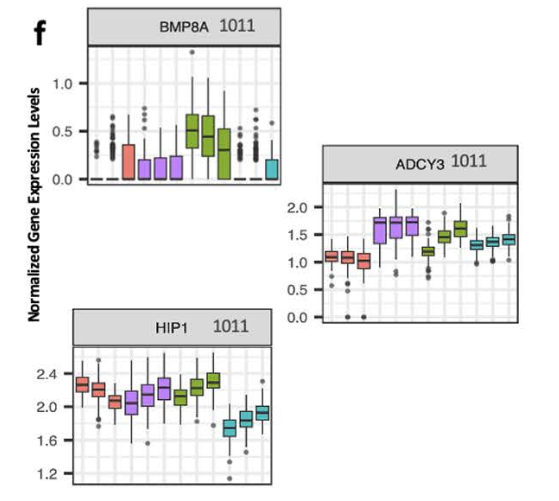
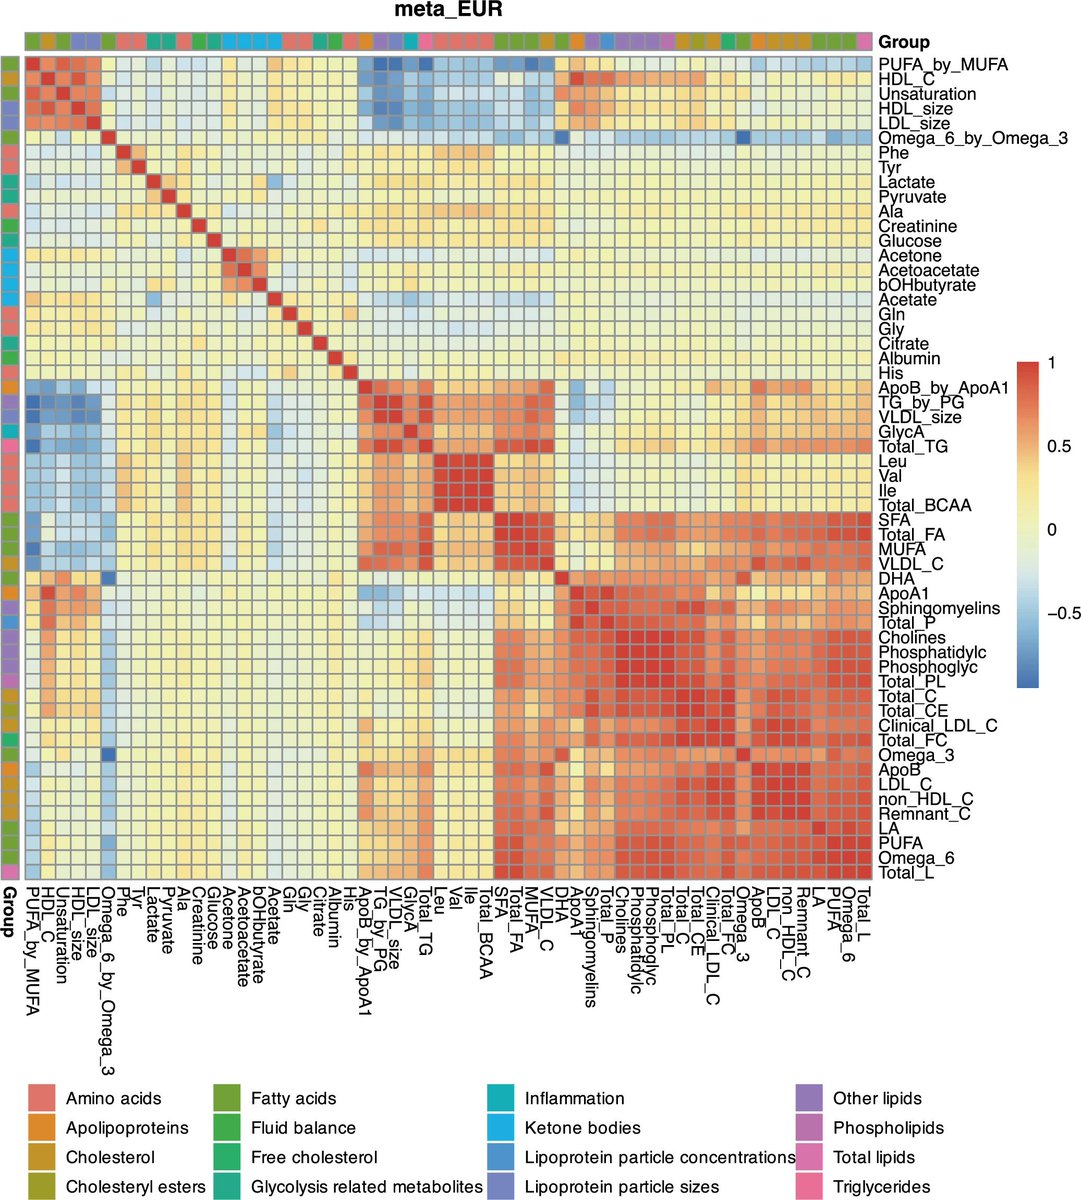
A new amazing resource for drug target explorations with genomic data was released today @Nature:
A massive meta-analysis GWAS for 249 NMR-quantified metabolites in UK Biobank and Estonian Biobank across 619,372 individuals👇
2
66
287
35,354
MarigortaLab retweeted

May 19
#WorldIBDDay | 🧬 Hoy, 19 de mayo, Día Mundial de la EII: Crohn y colitis ulcerosa, enfermedades crónicas que afectan a ~1% de la población
En #CICbioGUNE @brta_eus impulsamos investigación en medicina de precisión y microbiota @MarigortaLab @AnguitaLab
ow.ly/JIj350Z1x58


1
3
158
MarigortaLab retweeted

May 13
pubmed.ncbi.nlm.nih.gov/4204…
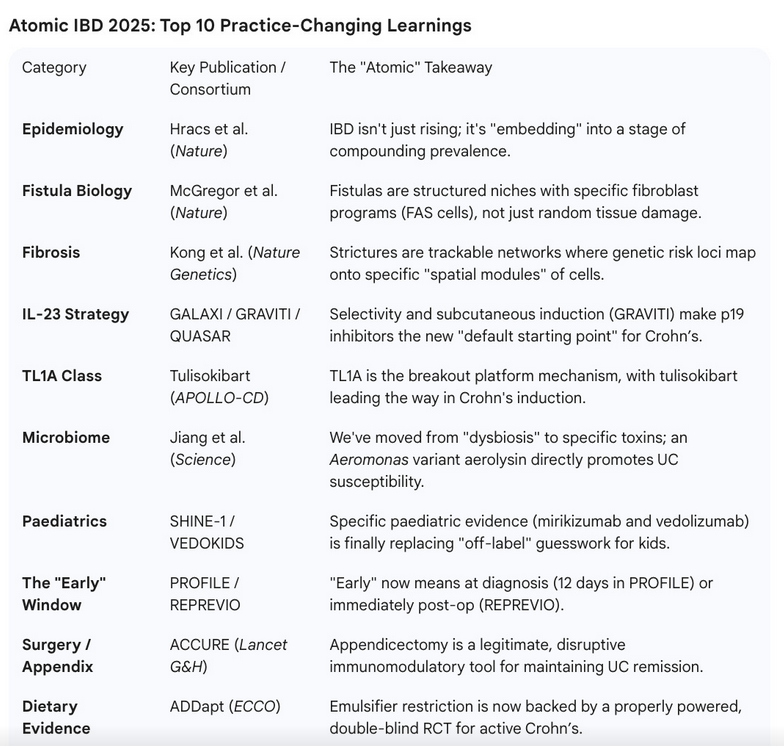
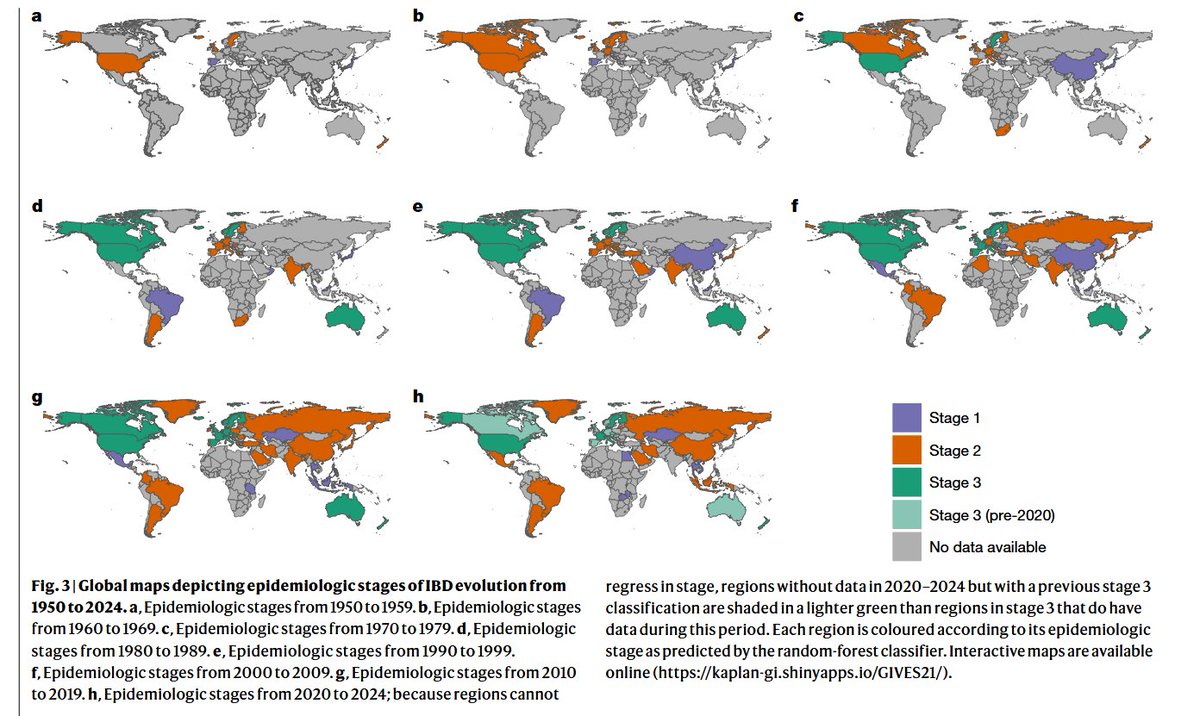
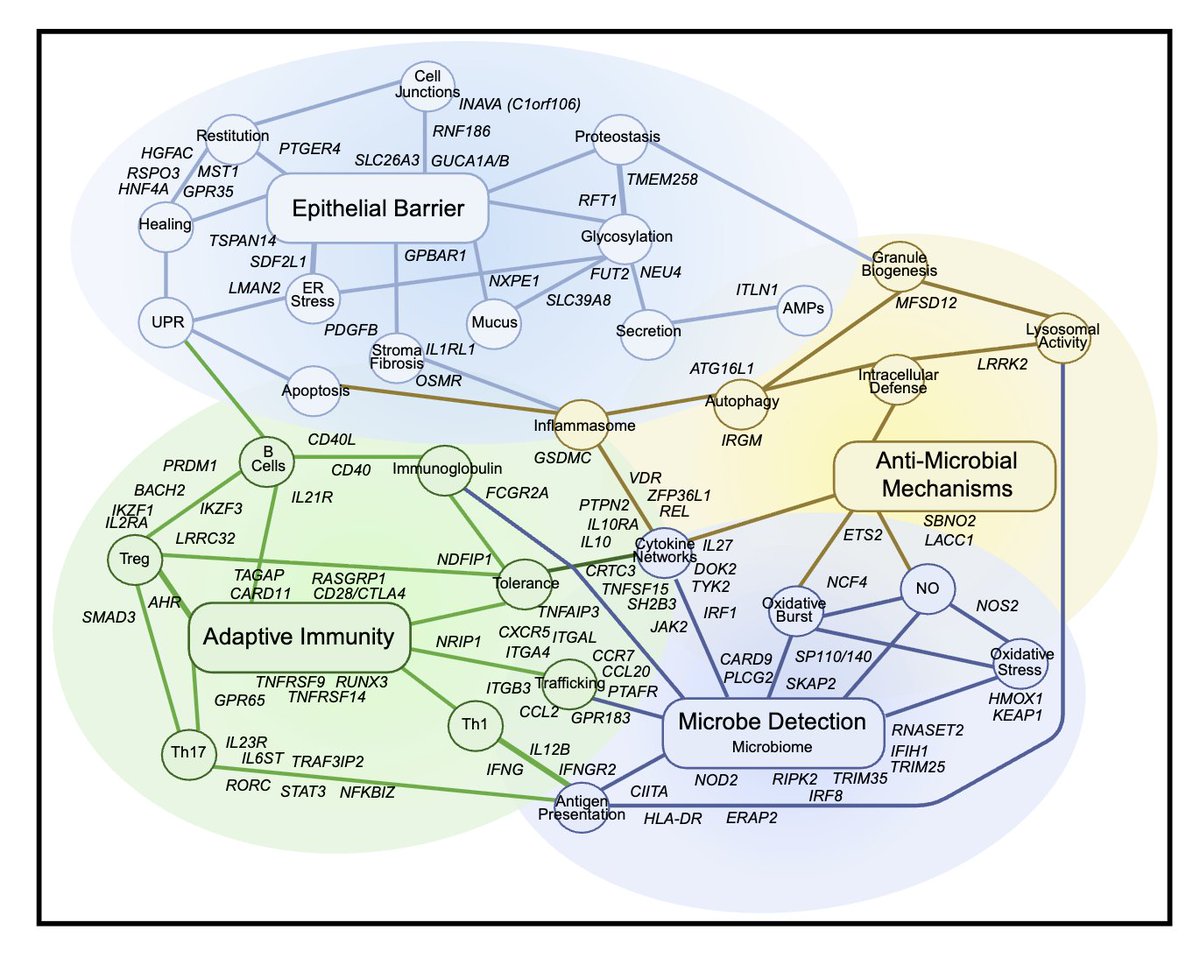
Mechanisms of inflammatory bowel diseases:Insights from human genetics and chemical biology
2
2
2,535
MarigortaLab retweeted

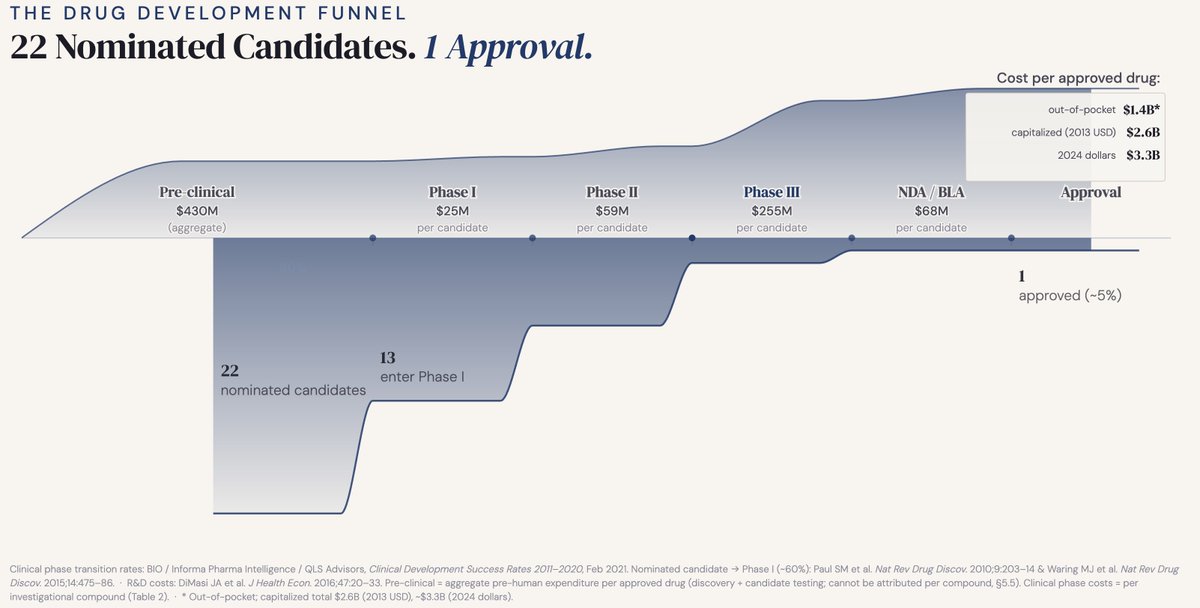
I recently vibecoded this plot in D3.js for a presentation. The funnel plot visualizes the attrition across different stages of drug development and the costs involved. The data and the concept behind this plot are now fairly common knowledge in the field. However, making this plot helped me find a few insights that may not be readily obvious in discussions about drug development costs and failures.
Before I share my insights, let me briefly walk through the plot for context. The plot visualizes the journey of a set of 22 nominated candidates, back-calculated from attrition rates needed to reach one approved drug, through the phases of development. The midline spine marks the stages along with cost labels from DiMasi et al. 2016 (pubmed.ncbi.nlm.nih.gov/2692…), the industry-standard reference, expressed per approved drug. The upper area curve is the cumulative cost (in 2013 dollars). The lower area curve shows the transition rates based on data from BIO/Informa (2021) (x.com/doctorveera/status/176…), Paul et al. (2010) (nature.com/articles/nrd3078) & Waring et al. (2015) (nature.com/articles/nrd4609) Nat Rev Drug Discov.
Cost of failures, not success
The most quoted number in drug development is also the most misunderstood one. When people say it costs billions to develop a drug, they picture a single molecule being shepherded from lab bench to pharmacy shelf at enormous expense. That is not what the number means. The billions are not the cost of one success. They are the cost of failures--all the failures that were necessary to produce that one success. Every candidate that got nominated, tested and quietly abandoned contributed to that figure. The billion-dollar headline is a measure of failures a company must stomach for one success.
The invisible part of the funnel
Most widely discussed failure rates in drug development start the clock at Phase I. That is actually a generous starting point. Before a drug ever touches a human, it survives a brutal pre-clinical filter that never gets a mention. Based on the limited data available, around 40% of formally nominated drug candidates never make it to human trials. The famously quoted "1 in 10" drug success rate does not count the preclinical attrition. If you factor it in, the odds of success drop from 1 in 10 to 1 in 22.
And even 1 in 22 is still optimistic as it starts counting only from formal nomination. Before that there are phases like target exploration, hit identification and lead optimization. That earlier funnel, from first exploration to nominated candidate, is almost impossible to quantify at an industry level. It lives inside company R&D pipelines and remains proprietary. The nominated candidate is already a survivor before it enters the visible funnel. The true odds are therefore likely worse than 1 in 22.
Pre-clinical costs rival clinical
Clinical trials, especially late-stage, have a reputation for being expensive. DiMasi et al. estimates $255M per candidate entering Phase III versus $59M in Phase II and $25M in Phase I. That steep cliff before Phase III is exactly what makes the "funnel". Every gate before III exists to prevent quarter-billion-dollar mistakes.
But here is what that framing misses. Pre-clinical development is invisible in most cost discussions, yet in aggregate it is not cheap. DiMasi reports $430M out-of-pocket pre-clinical spend per approved drug, which is an aggregate cost spanning the entire pre-human pipeline. The data does not allow a per-compound breakdown. Now compare that to our portfolio-level trial costs: 7 entering Phase II at $59M each is $413M, 2 entering Phase III at $255M each is $510 M. The most expensive phase per trial and the most invisible phase in the pipeline cost roughly the same. And nobody talks about the second one.
The Phase II graveyard
If you look closely at the transition rates, one number will stand out: 29% of drugs from Phase II make it to III, the narrowest part of the funnel. The killer here is not safety, it's efficacy. Waring et al. found that pre-clinical failures are dominated by toxicology (59%) and Phase I failures by safety signals (25%), which makes sense as we have reasonably good early tools for catching dangerous compounds before they cost too much. But Phase II failures are led by efficacy (35%), because there is no pre-clinical substitute for asking whether a drug actually works in humans at therapeutic doses. That question can only be answered in Phase II, expensively, after millions have already been spent getting there.
The implication here is to invest disproportionately in early efficacy signals not because safety does not matter, it does. But it usually declares itself early. Efficacy ambushes you late during the most expensive phase before III, and by then the bill is already large.
Buying the race, not the winner
We often come across news of billion dollar acquisitions in the biotech field, which might make you wonder how all that we discussed so far applies there. A company that began with just one target successfully navigated their way into late stages of trials and got acquired for billions of dollars. On the surface it might look like one company is being bought for their one success. But that's not the full story. That company is just one survivor out of dozens if not hundreds of parallel single-target companies that ran a similar race and quietly failed. They never show up at the deal table, but in reality they are all priced in. The buyer is not paying for what that one company spent. It's also paying for what other failed companies spent in that target space. The truth is the market ran a portfolio experiment across many bets, and this acquisition settles the tab. Whether the winner got there by conviction or pure luck does not matter. What matters is the buyer bought their way to the end of the funnel by paying what it would have cost to run the race themselves across hundreds of candidates.
Not broken. By design.
It is worth stepping back and wondering if the funnel reflects a broken system that needs fixing. Of course, not. The shape you see is not a failure of the system, it is rather a deliberate design of drug development. The logic is front-loading of attrition: fail cheap, fail fast, and invest heavily only in the survivors. Pre-clinical cuts are inexpensive. Phase I cuts are manageable. By the time you reach Phase III and spend a quarter of a billion per compound, make sure your earlier gates have done brutal and honest work.
The funnel is not broken. But its shape does raise an uncomfortable question: are early filters aggressive enough? Every weak candidate that slips through the early gates carries an expensive price tag before it eventually fails anyway. The cost of a leaky funnel is not just the money. It is the time, the patients enrolled in trials for drugs that should not have made it that far, and the opportunity cost of resources not spent on better candidates.
10 Mar 2024

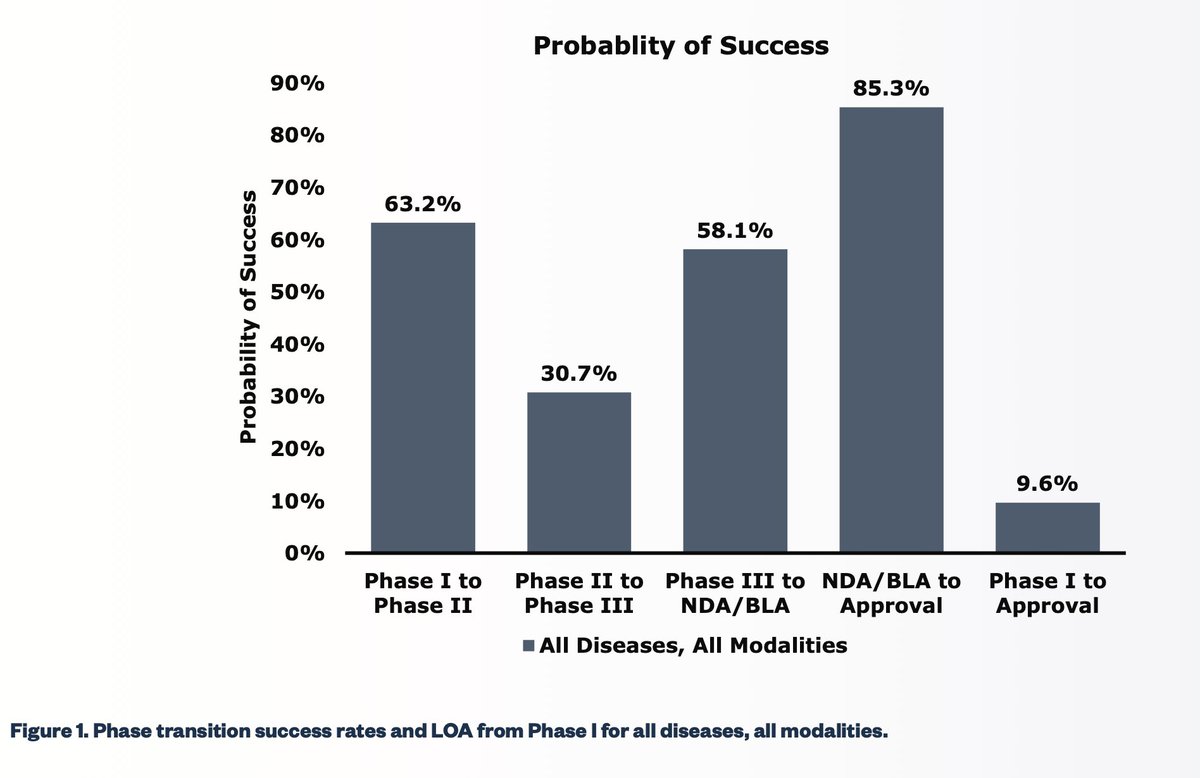
I was trying to find the source of the famously quoted ~90% failure rate for drug programs that enter clinical trials. Here is a report published by the Biotechnology Innovation Organization (BIO).
Based on the analysis of 7,455 drug programs from 1,103 companies that were in various stages of clinical development during 2006-2015, the overall likelihood of approval (LOA) for a drug candidate that enters phase 1 trial is 9.6%.
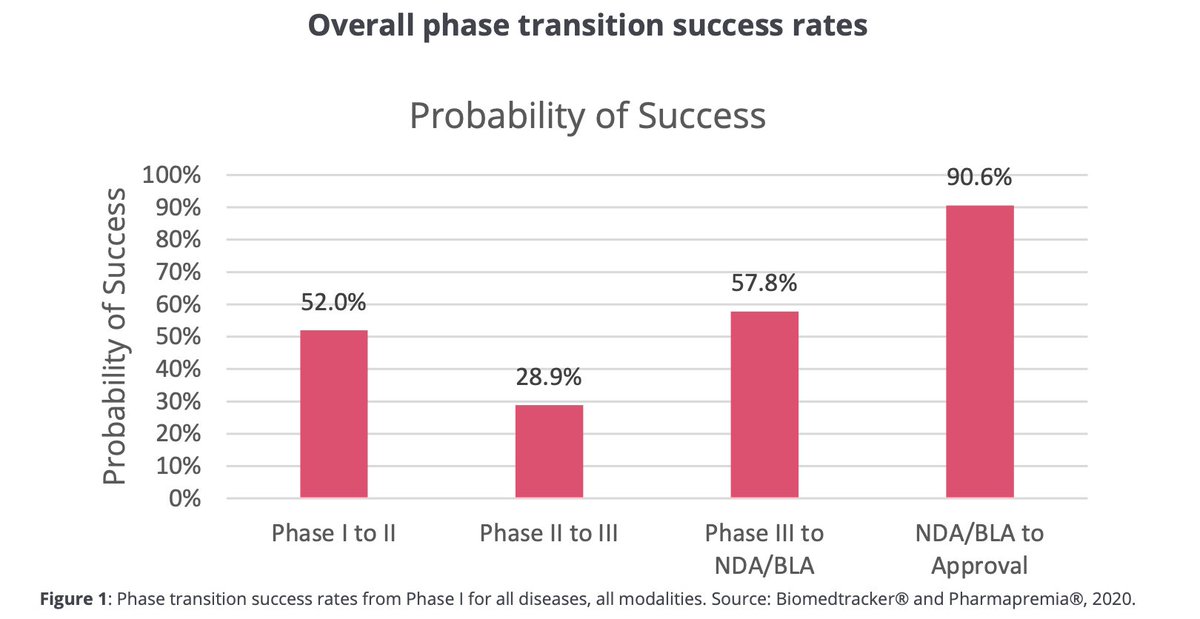
This number falls further to 7.6% in their latest report based on data between 2011 to 2020 from 9,704 drug programs from 1779 companies. (The number is calculated by multiplying the phase-transition success rates across all stages).
Fascinatingly, the lowest phase transition rate in both analyses was seen for drugs moving from phase II to III, which seems to be the most critical and companies are most willing to kill their darlings to save money on large, expensive phase III studies.
Links:
1. bio.org/sites/default/files/…
2. go.bio.org/rs/490-EHZ-999/im…
3
14
70
9,339
MarigortaLab retweeted
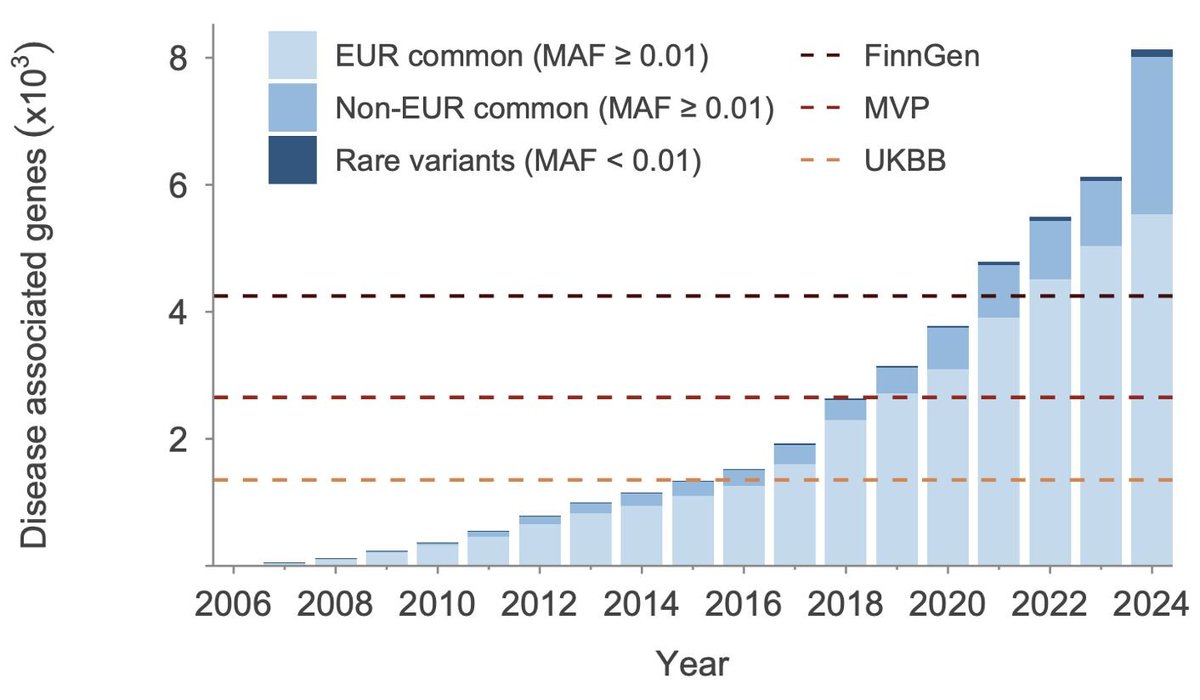
This new preprint by Open Targets is one of the most comprehensive efforts to date to connect the dots across all available (>100K) GWAS datasets that have been generated over the last two decades👇
4
21
85
6,715
MarigortaLab retweeted
Apr 21
#bioGUNE_Thesis | Researcher Juan Antonio Miguel González will defend his #PhD thesis:
📖 “Genomic Evaluation of Therapeutic Targets for Immune-Mediated Inflammatory Diseases through Mendelian Randomization”
👤@MarigortaLab
🔗 ow.ly/bikq50YNpCK
🕜 April 23rd, 11:00H

1
1
297

Apr 16
Who said this? 😏
"I don’t actually think very much of all the ‘mathematical theory of evolution’ stuff, it is all ultimately based on the quite fallacious notion that selection coefficients belong to genes, whereas actually they belong to phenotypes"
24
Apr 10
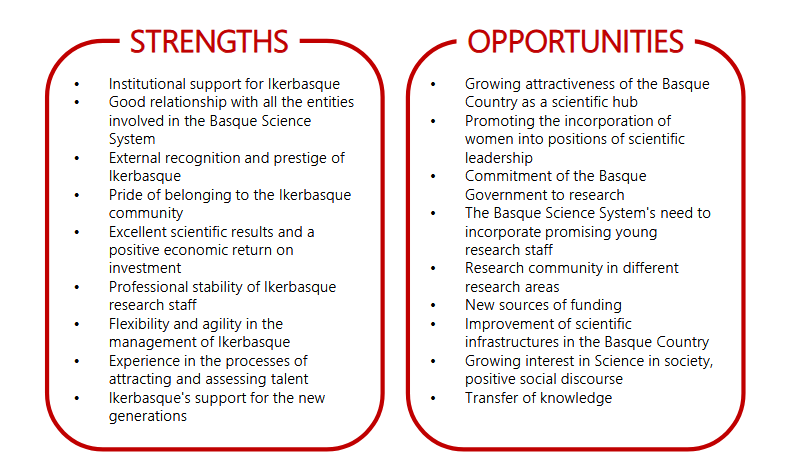
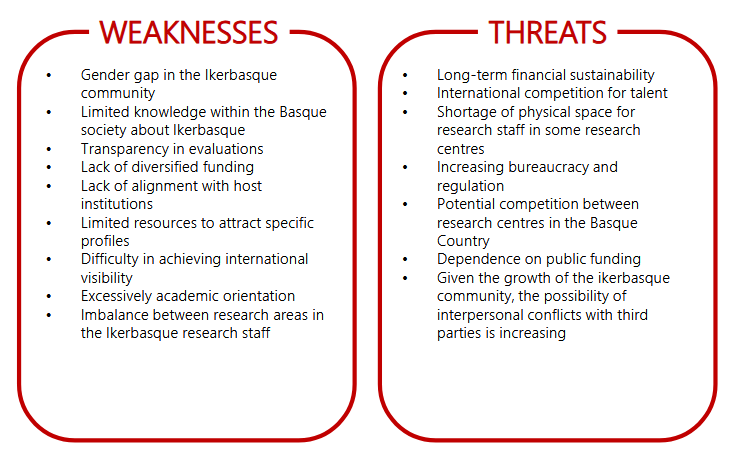
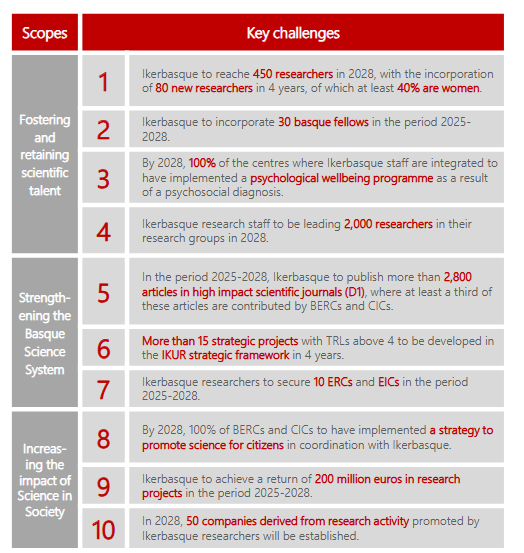
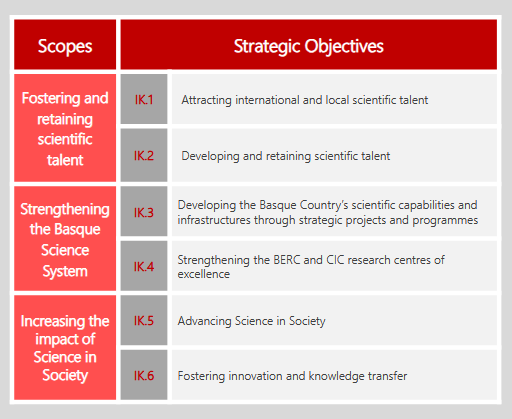
Ikerbasque 2025-28 Strategic Plan
ikerbasque.net/sites/default…
🙂Honest DAFO & huge focus on talent & system building
😒Yet, reads more planning than strategy
Enabling Basque scientific muscle is a great challenge.
But I do miss more articulation of specific priorities/choices and why
50
MarigortaLab retweeted

Apr 8
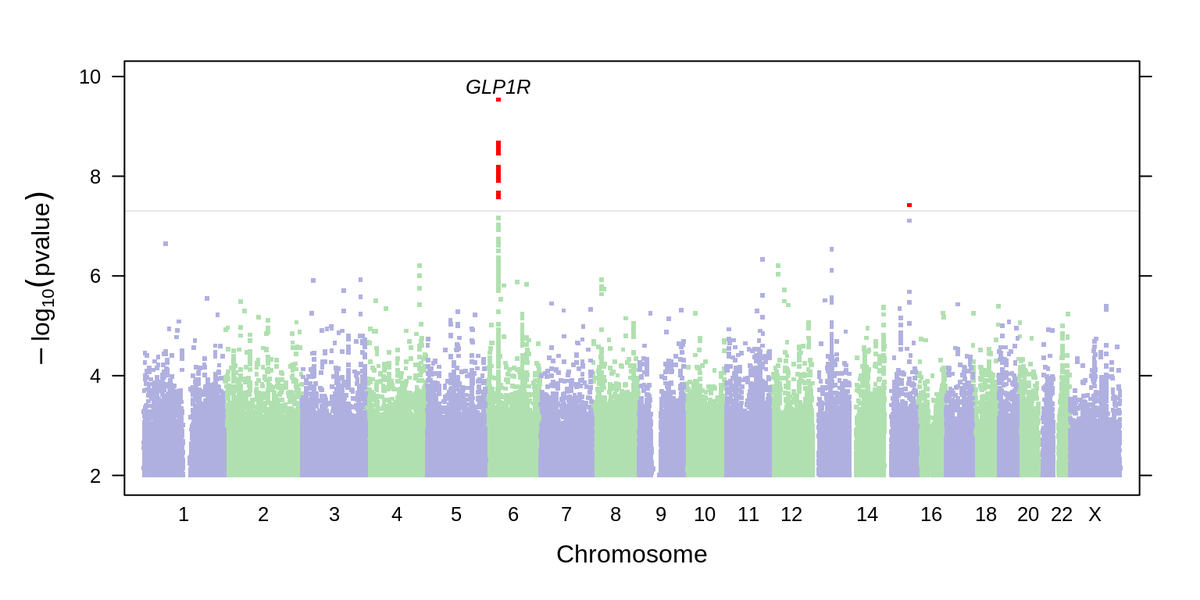
By running a GWAS on data we collected from an online survey about GLP-1 medication, we found a missense variant in GLP1R that predicts treatment success. This makes sense! GLP1R is the target of the GLP-1 medications!
1
6
35
3,623
MarigortaLab retweeted

Apr 2
StratGWAS is our new tool for more efficient GWAS of heterogeneous diseases. Instead of treating cases equal, it weights them based on relevant phenotypic information such as medication use, age of onset or recruitment strategy. Full details on MedrXIv medrxiv.org/content/10.64898….
2
16
76
4,833
MarigortaLab retweeted

It’s well known that inflammation increases cancer risk, but how?
The answer: the epigenome "remembers" inflammation and primes stem cells for cancer.
Here is our paper: nature.com/articles/s41586-0…
And a special shoutout to the lead author @snaga13
A 🧵
15
130
568
42,624
Mar 27
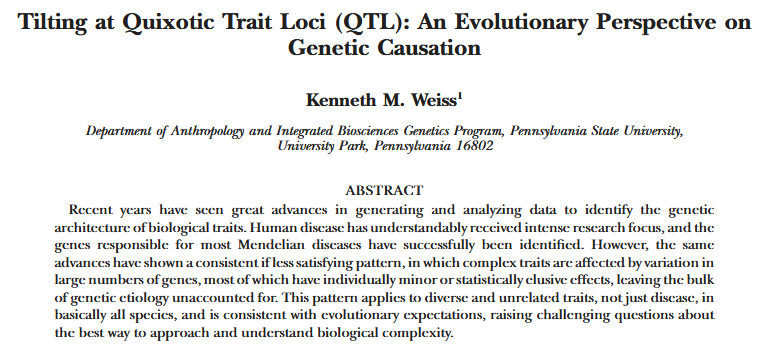
Another oldie one!😃
"Tilting at Quixotic Trait Loci (QTL): An Evolutionary Perspective on Genetic Causation" by Ken Weiss
Always loved the Mississippi analogy
➡lost of tiny streams end up having a role
➡understanding the flow > just "counting each drop"
pmc.ncbi.nlm.nih.gov/article…


34
Mar 25
Oh, just came across this oldie one😯
"Infectious Causation of Disease: An Evolutionary Perspective" by Cochran et al.
gwern.net/doc/genetics/selec…
Many ideas aged well, but the one I like the most is that genes shape susceptibility to infection (rather than "directly" cause disease)
39
MarigortaLab retweeted

Mar 23
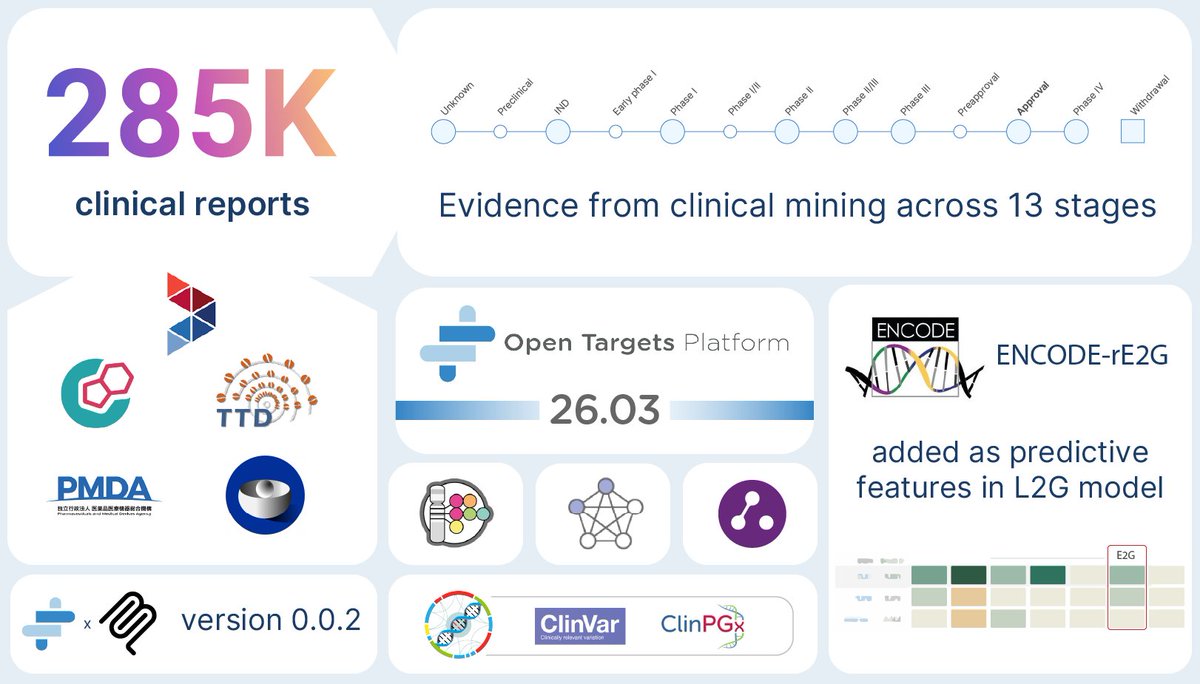
The @OpenTargets Platform spring 🌼 release is out — and this one marks the beginning of something we've been building towards for a while.
1
3
9
475
Mar 17
"Best way to put it, nobody fucked with Ernst Mayr" 😅
Bob Trivers died...
skeptic.com/article/robert-t…
59
Mar 11
"Human Genetics: The Hidden Text of Genome-wide Associations"
A classic one from 2007, with lots of great ideas inside, even if, weirdly, it was not cited much...🤨
cell.com/fulltext/S0960-9822…
1
74
MarigortaLab retweeted

Feb 20
The math on this project should mass-humble every AI lab on the planet.
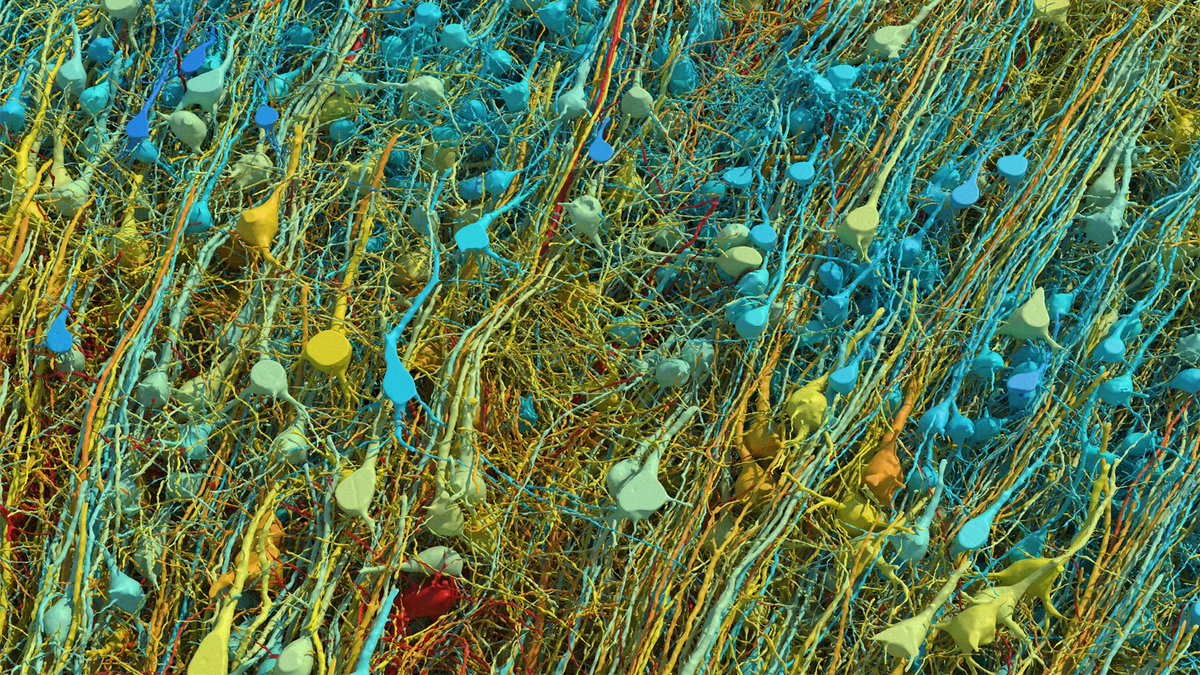
1 cubic millimeter. One-millionth of a human brain. Harvard and Google spent 10 years mapping it. The imaging alone took 326 days. They sliced the tissue into 5,000 wafers each 30 nanometers thick, ran them through a $6 million electron microscope, then needed Google’s ML models to stitch the 3D reconstruction because no human team could process the output.
The result: 57,000 cells, 150 million synapses, 230 millimeters of blood vessels, compressed into 1.4 petabytes of raw data. For context, 1.4 petabytes is roughly 1.4 million gigabytes. From a speck smaller than a grain of rice.
Now scale that. The full human brain is one million times larger. Mapping the whole thing at this resolution would produce approximately 1.4 zettabytes of data. That’s roughly equal to all the data generated on Earth in a single year. The storage alone would cost an estimated $50 billion and require a 140-acre data center, which would make it the largest on the planet.
And they found things textbooks don’t contain. One neuron had over 5,000 connection points. Some axons had coiled themselves into tight whorls for completely unknown reasons. Pairs of cell clusters grew in mirror images of each other. Jeff Lichtman, the Harvard lead, said there’s “a chasm between what we already know and what we need to know.”
This is why the next step isn’t a human brain. It’s a mouse hippocampus, 10 cubic millimeters, over the next five years. Because even a mouse brain is 1,000x larger than what they just mapped, and the full mouse connectome is the proof of concept before anyone attempts the human one.
We’re building AI systems that loosely mimic neural networks while still unable to fully read the wiring diagram of a single cubic millimeter of the thing we’re trying to imitate. The original is 1.4 petabytes per millionth of its volume. Every AI model on Earth fits in a fraction of that.
The brain runs on 20 watts and fits in your skull. The data center required to merely describe one-millionth of it would span 140 acres.
Feb 17

🚨: Scientists mapped 1 mm³ of a human brain ─ less than a grain of rice ─ and a microscopic cosmos appeared.

1,159
11,911
63,702
4,617,914
MarigortaLab retweeted

Feb 10
✅ The UK Government has today granted access to half a million UK Biobank participants' coded GP data for health research.
This change will dramatically increase the power of UK Biobank's dataset to advance the diagnosis, treatment and management of conditions handled by GPs.

3
26
68
6,072
MarigortaLab retweeted

Jan 27
Class is often overlooked as a driver of observed career and wealth disparities. This paper is a pretty incredible study into the role of class in the career progression of academia.
Class has a substantial impact at nearly every stage of the academic pipeline.
Important work.
On a personal note, this tracks with my own experience as a first-gen student. In grad school, I was shocked at the number of peers who had academic parents. They arrived on the first day knowing about the journal publishing system, the importance of conferences for networking, etc.
Jan 27

📢now forthcoming in ECMA!
The Class Gap in Career Progression: Evidence from US Academia
Class is rarely a focus of research or DEI in elite US occupations.
Evidence suggests it should be: we find a large class gap in at least one occupation - tenure-track academia...🧵

33
84
791
366,735
MarigortaLab retweeted

Jan 21
Barbara McClintock's discoveries were so far beyond the understanding of the time that other scientists ignored her work for more than a decade. But she persisted, trusting herself and her evidence. She was awarded the Nobel Prize "for her discovery of mobile genetic elements."
Watch the very moment she received the Nobel Prize in Physiology or Medicine in 1983.
43
497
2,647
82,425