
Catholic. Depressed since 1536. Seething since 1688. But.....Dum spiro spero. Politics? Disraeli advised by Ernest Bevin. A Reactionary. Damn the Whigs.
Joined February 2022
- Tweets 6,260
- Following 203
- Followers 281
- Likes 53,970
45 Photos and videos


Pinned Tweet

17 Mar 2023
"The whole modern world has divided itself into Conservatives and Progressives. The business of Progressives is to go on making mistakes. The business of Conservatives is to prevent mistakes from being corrected."
G.K. Chesterton
1
7
41
8,107
Jun 11
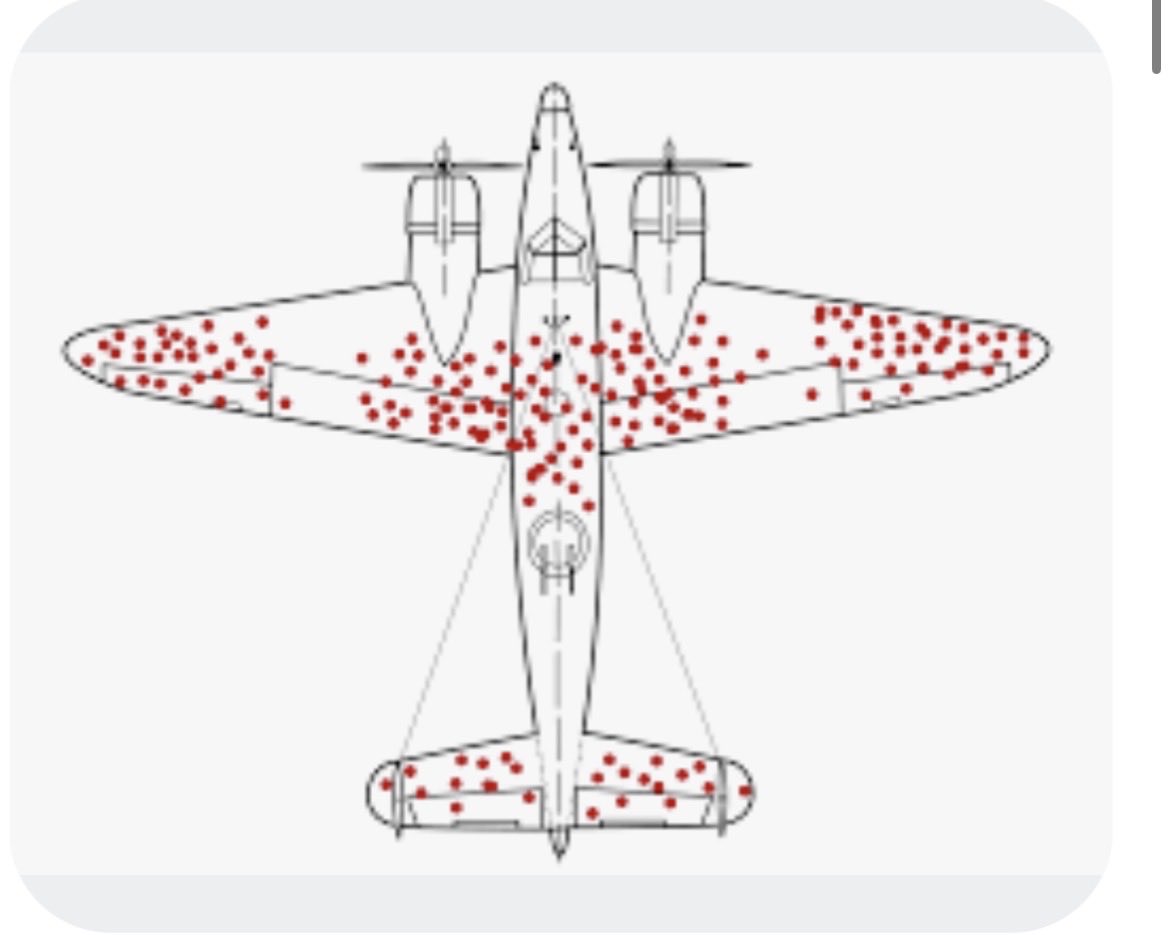
Not looking so clever a tweet today.
4
34
Mark Bailey retweeted

Jun 10
Astonishing that they were able to speak fluent lanyard
10
19
387
3,871
Mark Bailey retweeted

Jun 3
It’s as if the Horse Gunners from the Retreat from Mons were brought back to life en.wikipedia.org/wiki/Affair…

Jun 3

Boots carried by her horse🕊️
An emotional farewell was bit to Lance Bombardier Ciara Sullivan as her coffin travelled to The Guards Chapel
3
4
71
20,011
Mark Bailey retweeted

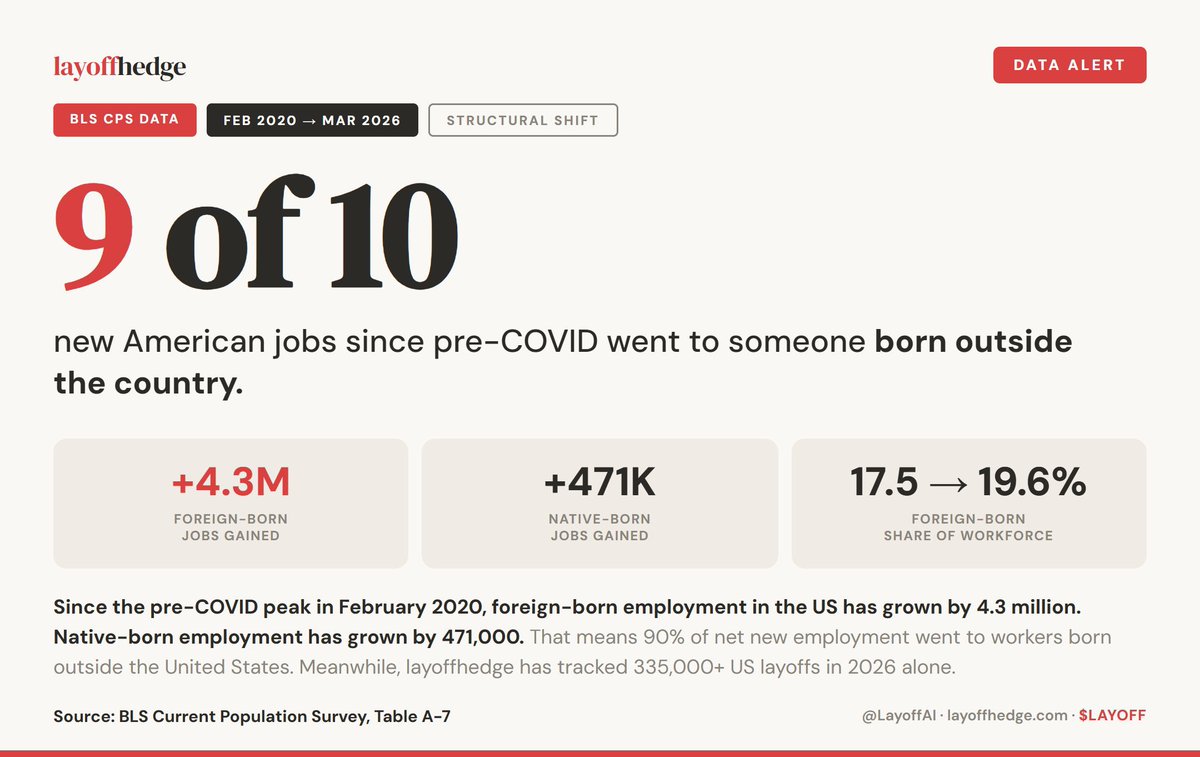
America's number is 9 in 10.
Britain's is 10 in 10.
Every net new job created in the UK since the pandemic has gone to someone born outside the country.
UK-born employment hasn't grown at all.
May 29

9 of every 10 new American jobs since pre-COVID went to someone born outside the country.
3
26
181
24,438
May 27
The Johnson family. Hard pushed to think of a more toxic collection of narcissists.
May 27

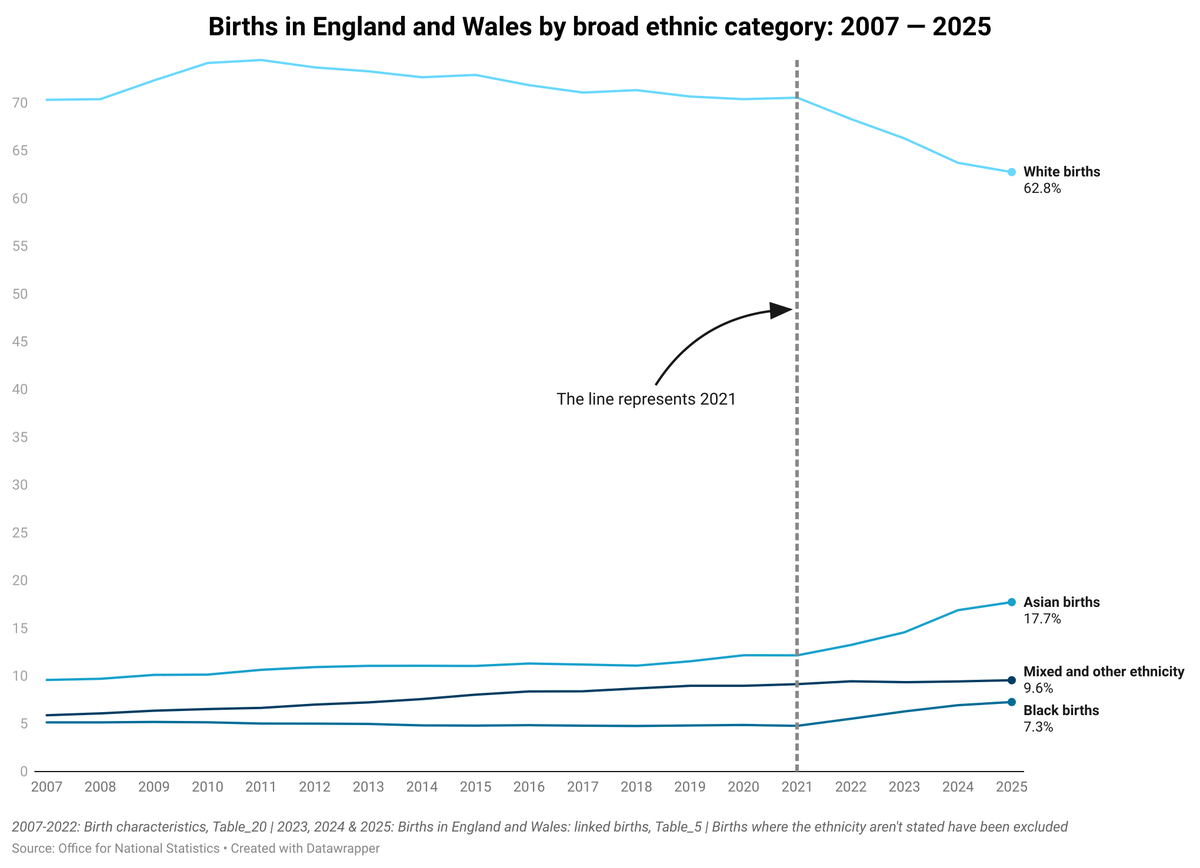
The Boriswave might be the most significant demographic event in centuries.
The stability from 2007 to 2021 was quite noticeable, but after 2021 when the post-Brexit immigration system was put in-place and non-EU immigration surged, look at the increase in Asian births.
1
4
34
2,276
May 27
Ben speed running ideological derangement in real time. Thing of wonder.

OK let’s have a look at three ways this chart is trying to hide Brexit damage by manipulation.
First, if you take 2016 as your start year at 100 you start the clock at the shock itself, thereby obscuring the pre-existing trajectory. That’s how you hide the fact that business investment was growing at ~6%/yr before the vote and then stalled. It’s essential to the pro-Brexit argument to hide or deny strong pre-2016 growth.
Second, a favourite of those trying to hide Brexit damage is to pick weak comparators that the 🇬🇧 was traditionally stronger than. That’s why they are so keen to show🇫🇷🇩🇪, the latter with its specific energy and industrial shock. They never want to show you 🇬🇧 economy against trade and services-driven economies like 🇳🇱🇸🇪🇩🇰 which are better comparators in some ways. Against a proper 33-country synthetic control group 🇬🇧 business investment is 12-18% below where it would have been had we remained by 2025. The result is 🇬🇧 now has the lowest investment share of any G7 economy at 17.9% of GDP.
Third, the metric used here is another way to obscure Brexit damage. Gross Fixed Capital Formation combines business investment and government capital spending, which flattens and hides the private sector signal. A government infrastructure can lift the aggregate while business investment which is what actually reflects private sector confidence stays feeble. That’s exactly what happened in 🇬🇧: a study by economists at Stanford University, the Bank of England and the National Institute of Economic and Social Research found that by 2024, business investment in other advanced economies was up around 25% on 2016 levels. In 🇬🇧 it had risen by just 4%.
1
52
Mark Bailey retweeted

May 25
Wake up babe, the Vatican is making better launch videos than tech startups
May 25

Produced by the Dicastery for Integral Human Development and EWTN a video reflection on Magnifica Humanitas, Pope Leo XIV’s first encyclical on safeguarding the human person in the time of artificial intelligence, opened the historic launch event on May 25, 2026 in the Vatican.
15
659
5,310
162,053
Mark Bailey retweeted

May 25
lol I know lawyer’s drafting when I see it….

112
183
1,127
46,817
May 24
Sue Gray: the anti-matter of political strategy. Bye, bye, Andy. It was fun having you around.
May 23

Starmer's ex-chief of staff Sue Gray joins team Burnham as key adviser - as Tories prepare for snap election trib.al/gQJPjxs
68
May 24
RT @akuareindorf: @Frances_Coppola You (on the left) are lecturing me (on the right) about women who don't conform to patriarchal norms of…
433
May 22
So brave. So powerful……
…..switches off replies.

Today my heart is with our trans community, treated so abysmally in this country.
Draft guidance means trans people are barred from services they could previously access & inclusive service providers will be at legal risk.
Green Party statement: greenparty.org.uk/2026/05/22…
3
80
Mark Bailey retweeted

May 10
These people don't see any irony whatsoever in seeking out common cause between Scotland, Wales and Northern Ireland.
It's almost as though we're the same people.
May 9

Pleasure to speak this afternoon with the leadership of Plaid Cymru & Sinn Fein - @RhunapIorwerth, @MoNeillSF and @MaryLouMcdonald.
The direction of travel and demand for independence is clear, and Westminster should grasp the significance of this moment.
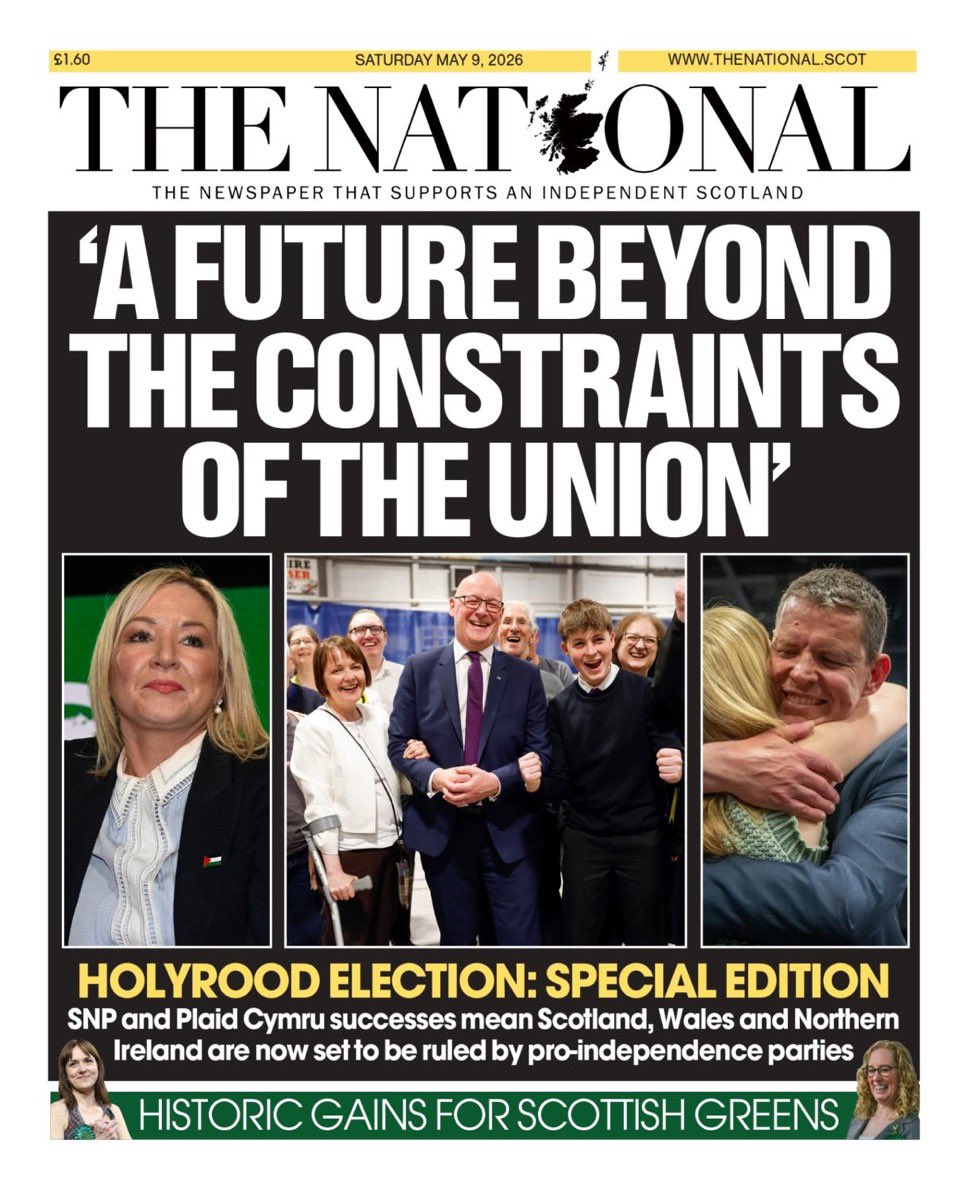
ALT Front page of The National newspaper with the headline: 'A Future Beyond The Constraints of The union'
2
7
28
1,532
Mark Bailey retweeted

May 7
To give you an idea how out of control things have got, UK public spending is now £48,000 per household.
61
255
1,717
159,050
May 3
Every time. African or Asian. Rage bait posters are so predictable.

A gentle reminder that a man who goes to work to “provide for his family” is actually sacrificing nothing And would still have to work if he didn’t have a family
106
Apr 30
"This is because the appeal that EU membership holds to them is largely aesthetic rather than political in nature...."
Bingo!
Apr 30

There is no real argument for rejoining the EU, argues @baylissbaghdad in his latest column for our online subscribers — and nobody makes one
thecritic.co.uk/the-ghost-da…
2
82
Mark Bailey retweeted

Apr 27
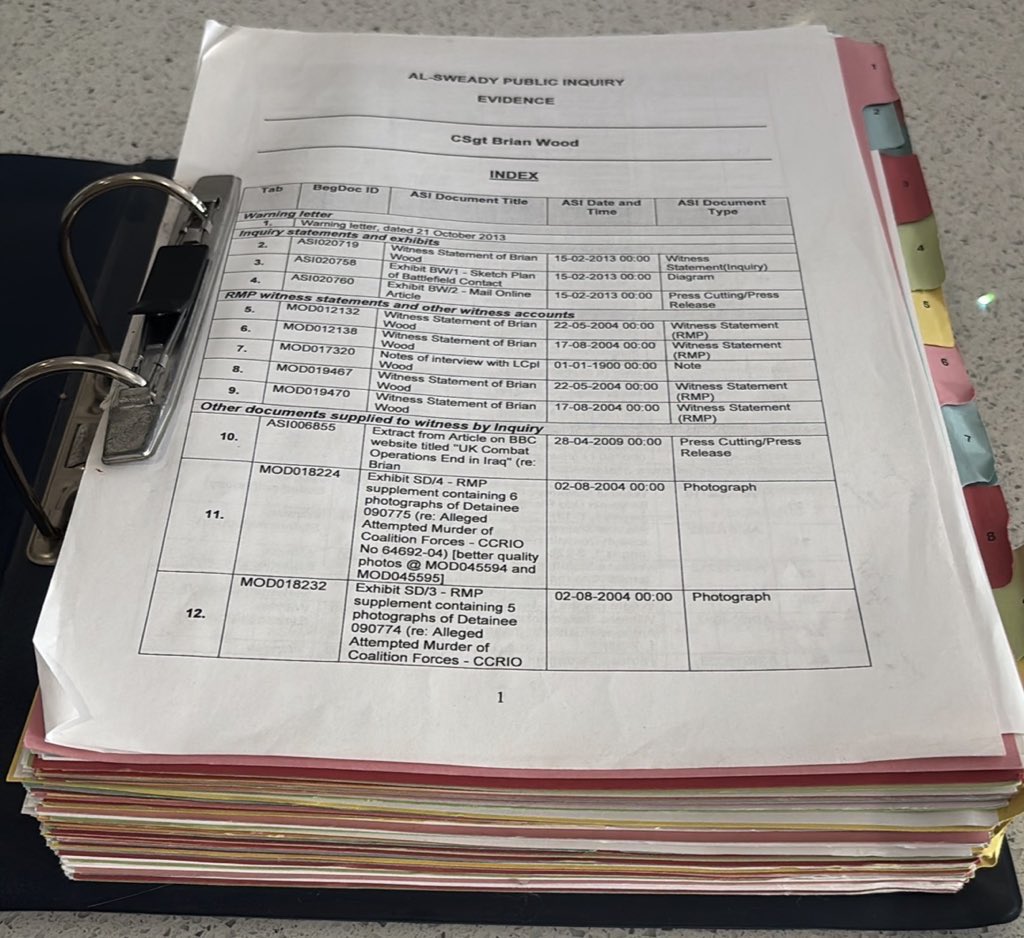
This is my hearing bundle from the Al Sweady inquiry. It brought an end to my military career after 17 years of exemplary service. The stress, pain, and heartache were overwhelming—driven in large part by Shiner & Hermer.
A medal glitters but it also casts a shadow - Churchill

137
1,056
3,908
193,378
Apr 28
South Asian male desperately posting rage bait for the $
49
Apr 12
Maybe Singapore should charge for the Straights of Malacca, Spain/Morrocco/UK(Gibraltar) for the Straights of Gibraltar, Turkey for the Bosphorus, S.Africa for the Cape, etc., etc..
They’re not making ‘International Business Titans’ like they used to. The old sort could tell stupidity on its face.
Apr 12

I am genuinely struggling to understand this logic.
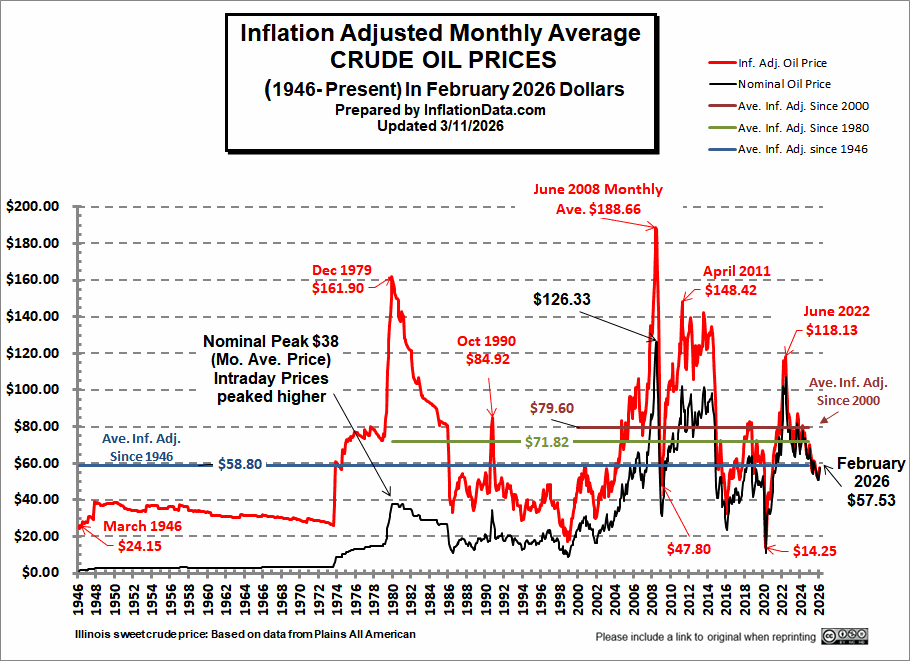
If the rest of the world is willing to pay a small toll to Iran to keep oil flowing and stabilise markets, then why does the U.S. feel the need to block all shipping, especially when it is not dependent on that oil?
157
Mark Bailey retweeted

Apr 2
“You’re absolutely right. I meant left”


ChatGPT is now available in CarPlay.
The voice mode you know, now available on-the-go.
Rolling out to iPhone users running iOS 26.4 where CarPlay is supported.

255
7,232
69,477
2,756,279