Joined April 2026
- Tweets 839
- Following 84
- Followers 100
- Likes 843
445 Photos and videos


Pinned Tweet

Jun 11
I’ve been observing the market quietly.
I wanted to finish this post after about a week’s worth of trading.
If the stop loss was set at that line, then re-entry planning should come into effect. The question is… is it still a reversal or is the whole setup about to be invalidated?
I’m still leaning that this is a good range and believe a reversal is in play, but I’m willing to let go of that if it continues under the last demand line.
There are many ways to play it: re-enter now and set the stop loss at the demand line; wait and enter at the demand line with a stop loss an appropriate percentage under it; or take a more conservative approach by waiting for the next line(s) above for better confirmation.
Remember we are under the major moving averages, so understanding that this could still fail is definitely on the table.
Also this post isn’t to shill this stock. I don’t care who buys it. It’s more of a discussion relating to having a strategy before making a trade. There’s a lot of strategies out there and there’s also a lot of good setups out there!
Do what’s best for you and not me.

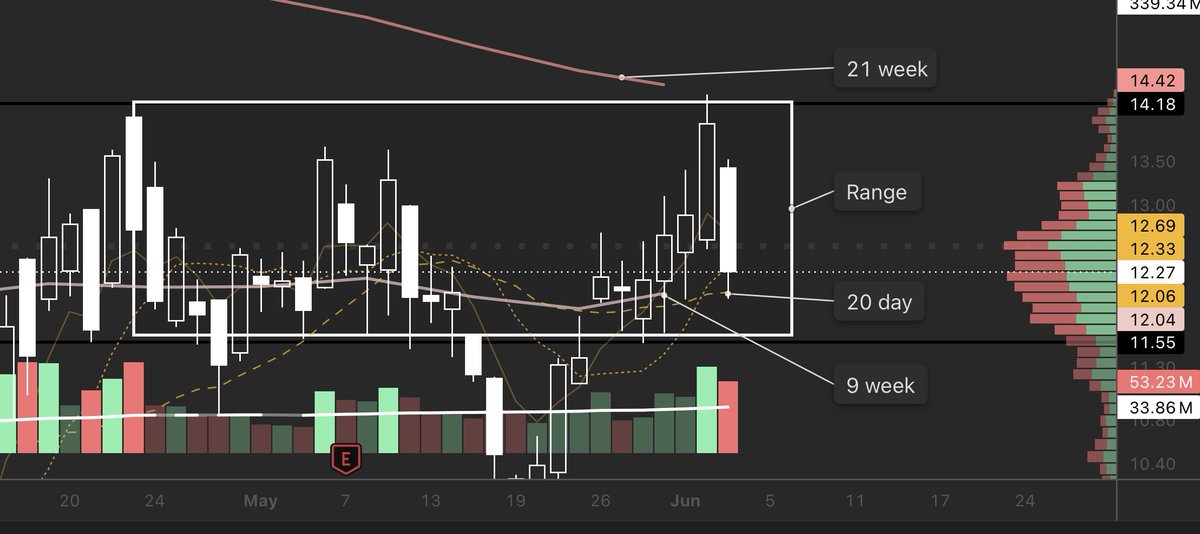
Today was a rough session for several stocks, but $SMR (NuScale Power) stands out because I’ve charted and traded this company.
***Lengthy Post Warning***
The stock experienced a meaningful pullback that was large enough to test traders conviction.
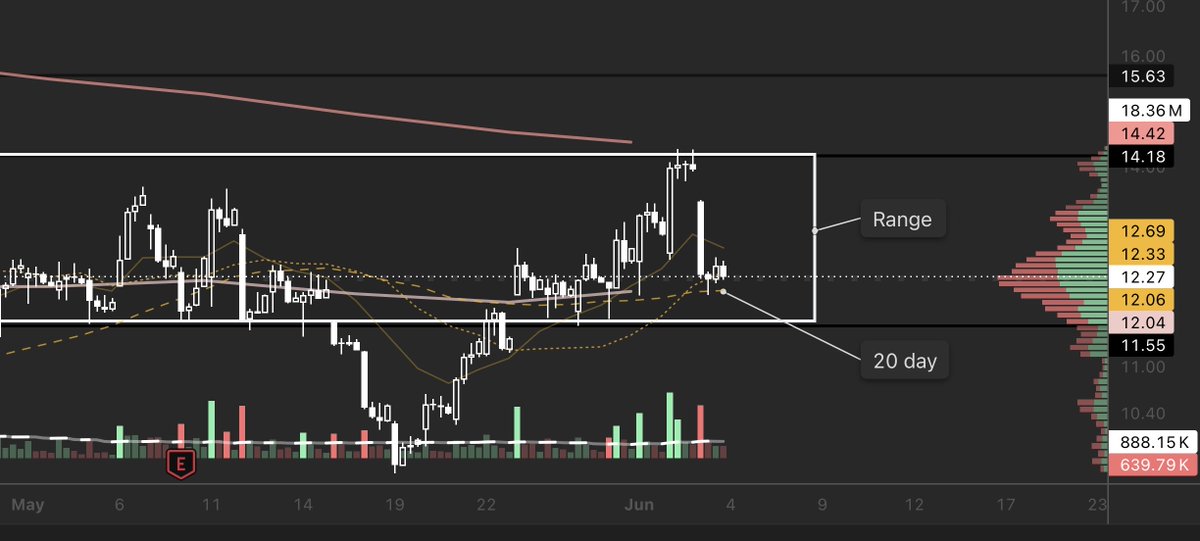
To manage the volatility, I outlined a white box on the chart representing the trading range where I would plan my entry. More importantly, I wouldn’t enter at the very top of the box. Instead, I would try to make entry towards the lower side. This approach reduces the risk of taking maximum loss on any single swing while still participating in the setup (the box).
$SMR remains trading above both its 9-
day and 20 day moving averages. On the 2 hour chart, you can see the candle bodies consistently hovering near the 9 day MA, showing the stock is still finding some footing in that area.
The pullback itself wasn’t surprising. As price approached a clear supply wall (what we can also refer to as a near-term ceiling), resistance was expected. That level also coincided with the 9 week moving average, adding another layer of potential selling pressure. Tagging multiple resistance areas at once often leads to exactly this kind of reaction.
Meeting resistance is a normal part of trading. Especially in volatile names like $SMR. What matters now is how price behaves within the white box. I’m watching to see if the lower boundary of the box holds as support. There’s no guarantee, of course, but that’s the level I’m using to test my conviction.
If the stock breaks and holds below that demand line, I would likely exit the position and look for a higher probability reentry later rather than holding through an invalid setup.
Of course risk management needs to be said here and stop losses should be placed where you see fit.
130
👀
May 13
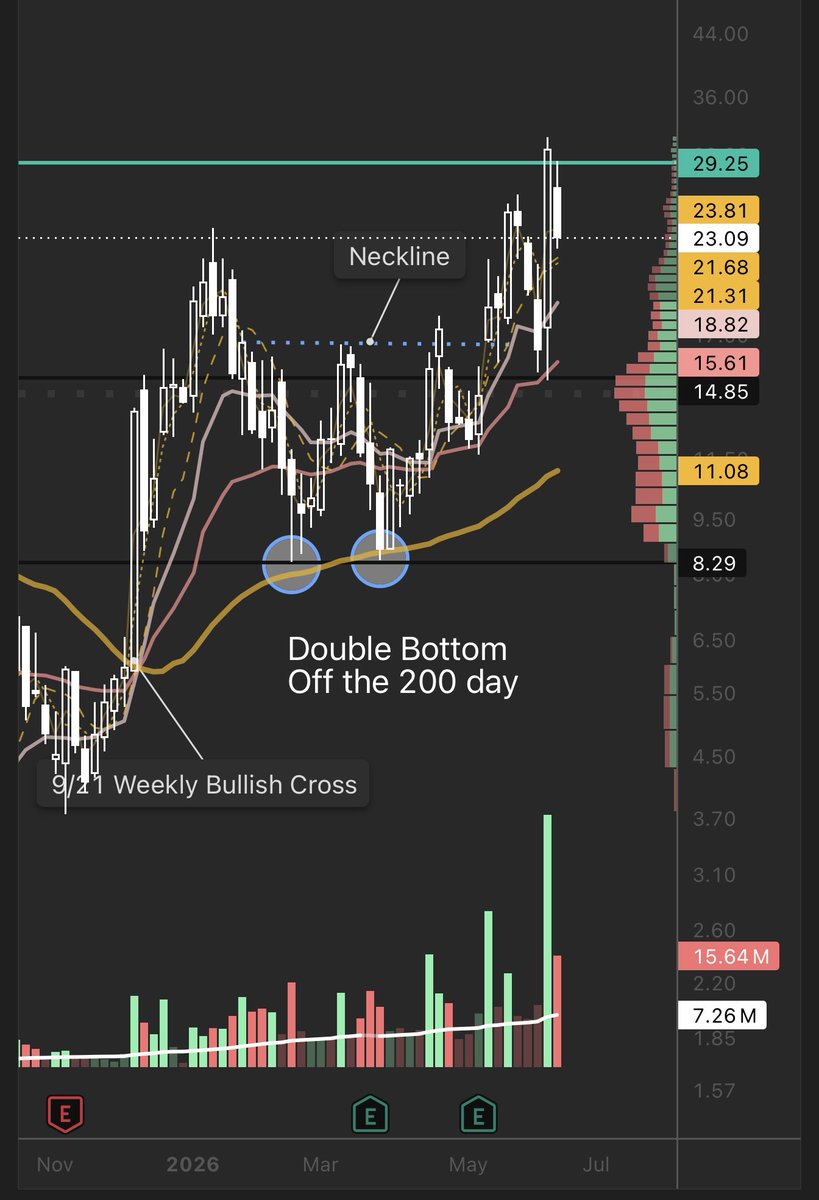
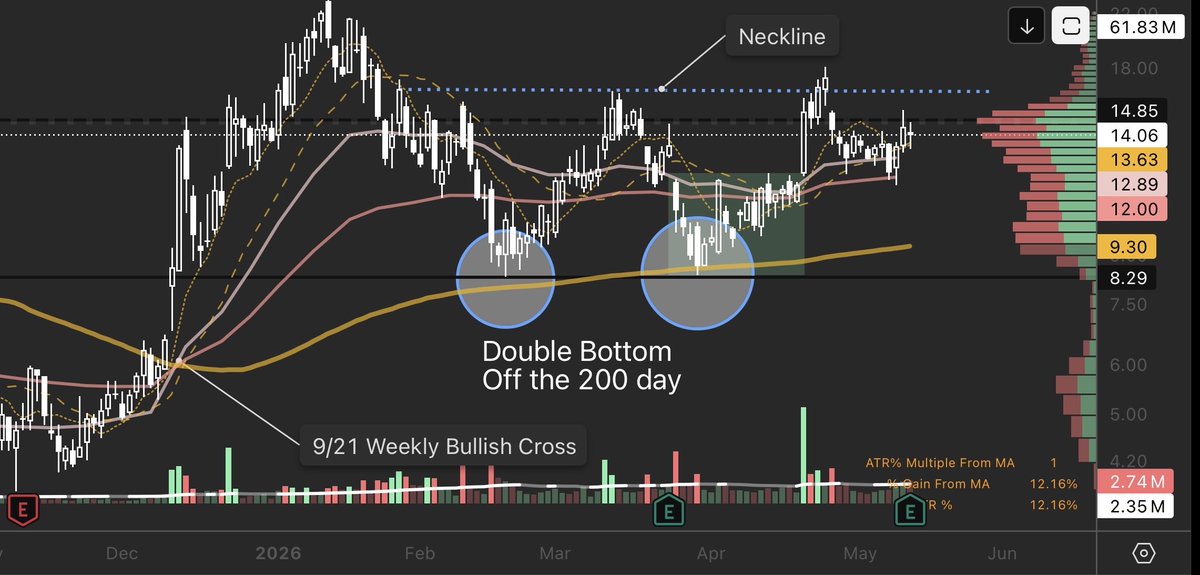
$VELO Velo3D is still working on the double bottom pattern. It still looks good hanging above the moving averages.
59
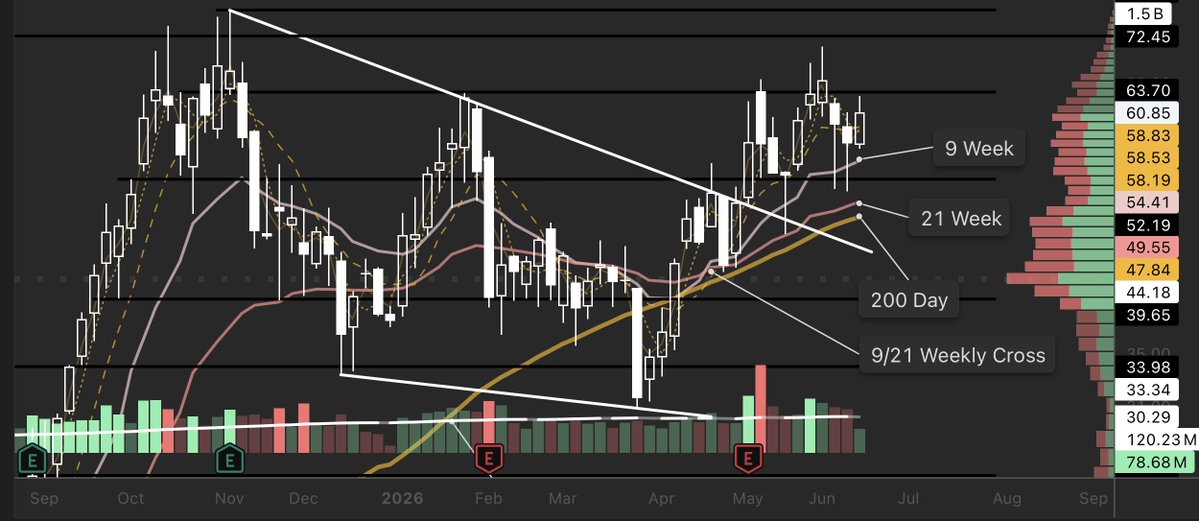
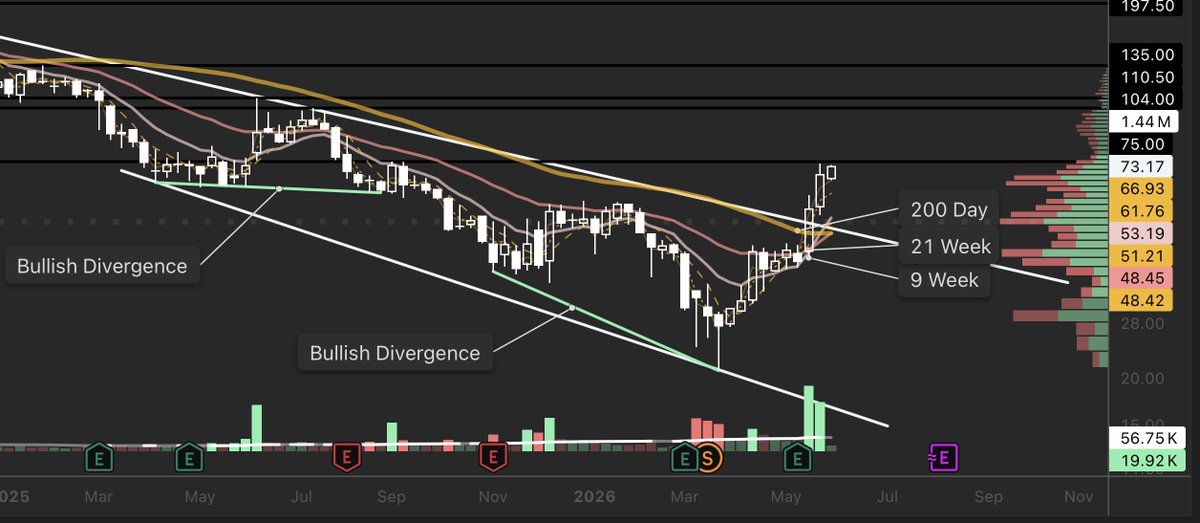
$IREN is above all major moving averages and continues climbing out of the falling wedge.
I can see it taking off soon.
The chart is in 3 day intervals for anyone wondering.
1
1
261
Jun 11
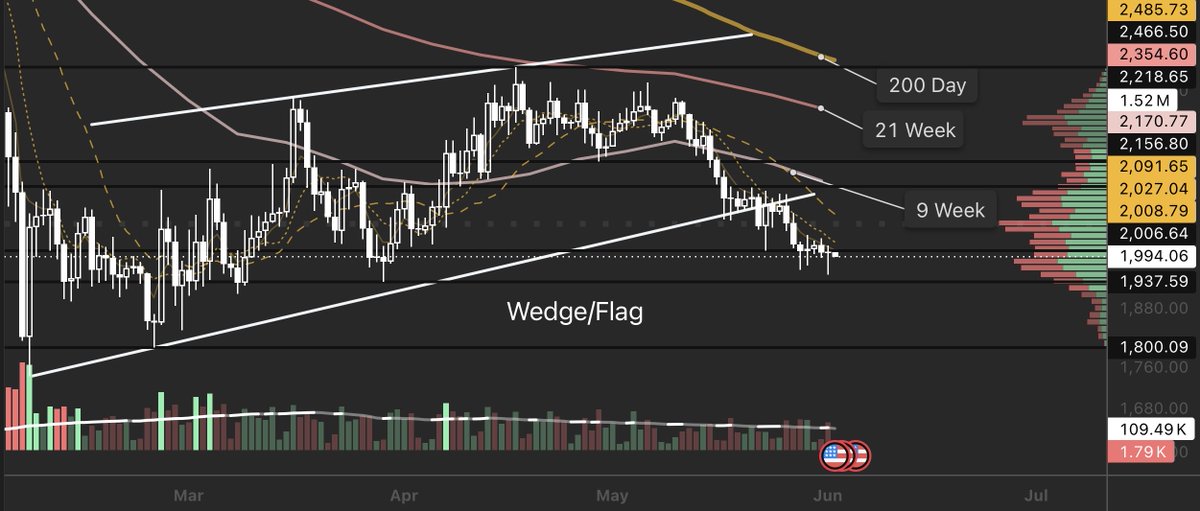
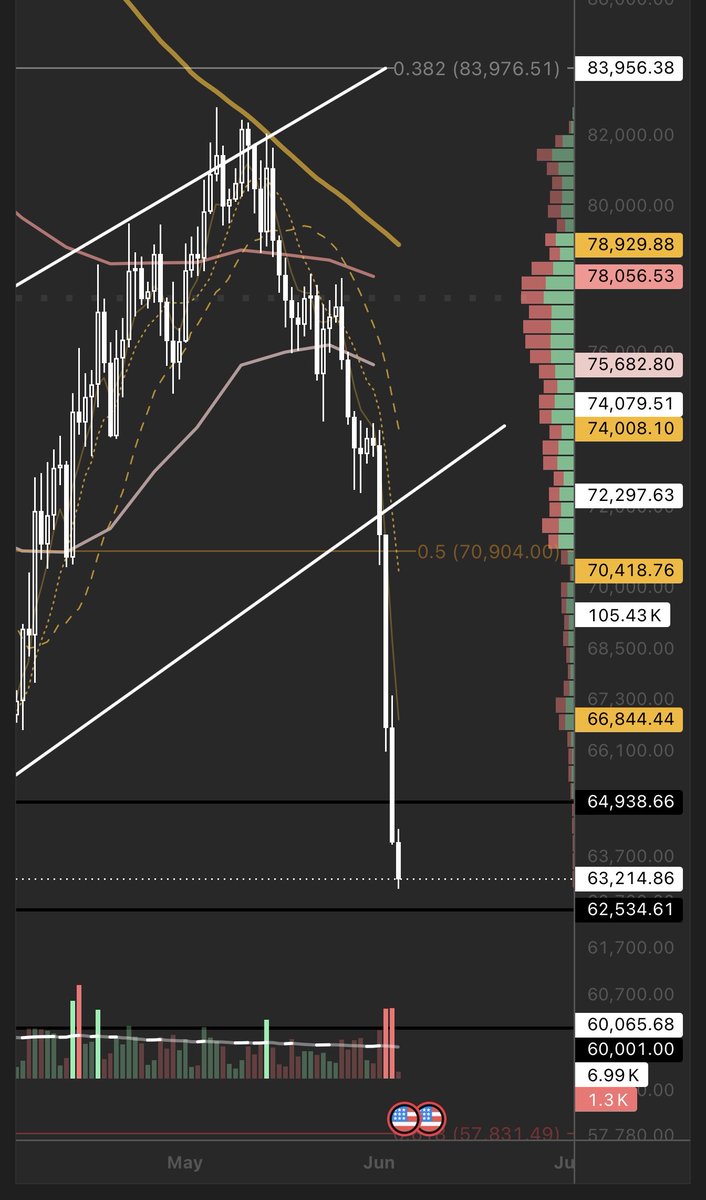
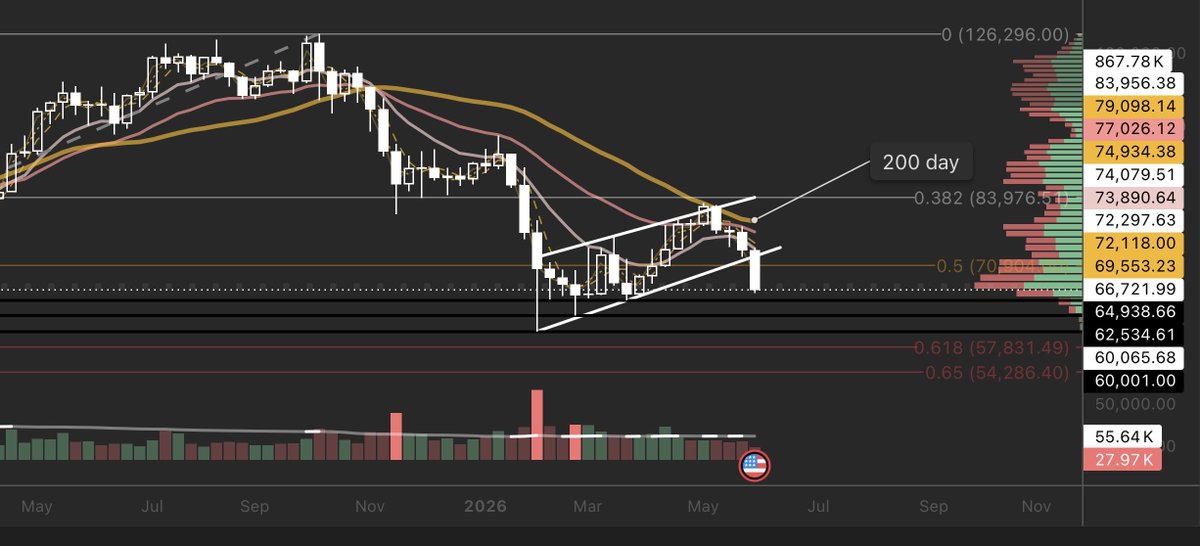
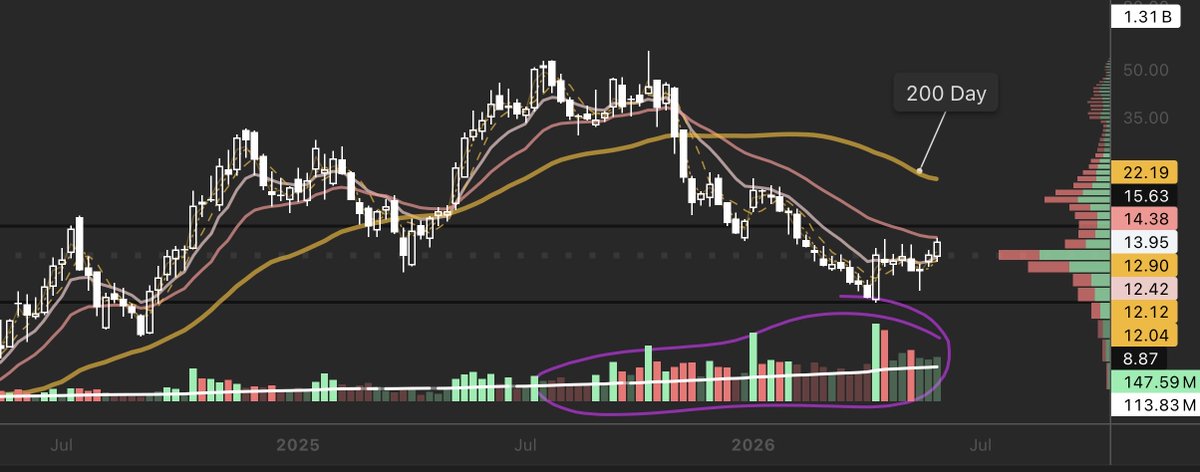
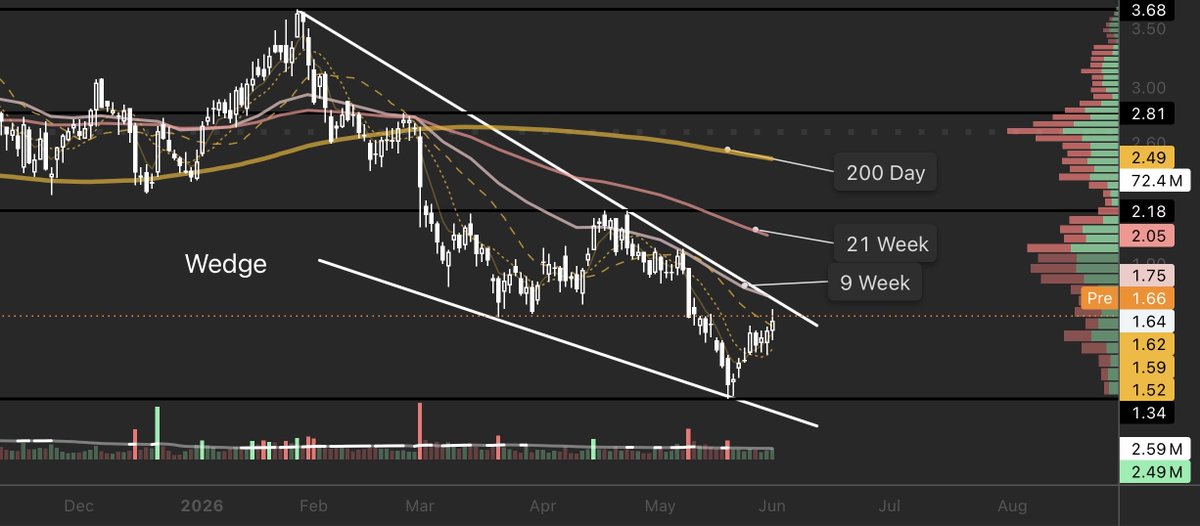
I like that Bitcoin $BTC has a clear falling wedge and the 200 day sits inside.
The only question now is whether the wedge has finished forming or if there is still more pain ahead.
As I mentioned before, I’ve had my eye on lower targets, but I wouldn’t hate if it made this range the floor.
39
Today was a rough session for several stocks, but $SMR (NuScale Power) stands out because I’ve charted and traded this company.
***Lengthy Post Warning***
The stock experienced a meaningful pullback that was large enough to test traders conviction.
To manage the volatility, I outlined a white box on the chart representing the trading range where I would plan my entry. More importantly, I wouldn’t enter at the very top of the box. Instead, I would try to make entry towards the lower side. This approach reduces the risk of taking maximum loss on any single swing while still participating in the setup (the box).
$SMR remains trading above both its 9-
day and 20 day moving averages. On the 2 hour chart, you can see the candle bodies consistently hovering near the 9 day MA, showing the stock is still finding some footing in that area.
The pullback itself wasn’t surprising. As price approached a clear supply wall (what we can also refer to as a near-term ceiling), resistance was expected. That level also coincided with the 9 week moving average, adding another layer of potential selling pressure. Tagging multiple resistance areas at once often leads to exactly this kind of reaction.
Meeting resistance is a normal part of trading. Especially in volatile names like $SMR. What matters now is how price behaves within the white box. I’m watching to see if the lower boundary of the box holds as support. There’s no guarantee, of course, but that’s the level I’m using to test my conviction.
If the stock breaks and holds below that demand line, I would likely exit the position and look for a higher probability reentry later rather than holding through an invalid setup.
Of course risk management needs to be said here and stop losses should be placed where you see fit.
1
3
630
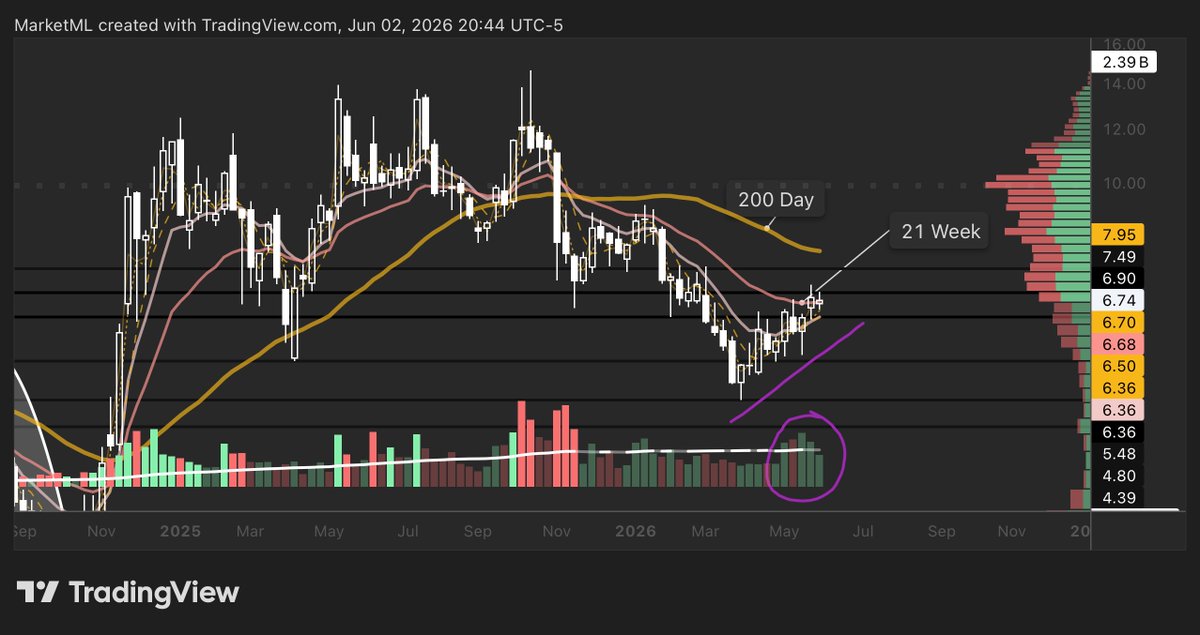
I would like to mention I made a mistake relating to the moving averages. I had my screen brightness turned down and my averages mixed up.
Here’s a zoomed out chart for $SMR using the daily. You can see it being rejected at around the 21 week and then bouncing off the 20 day & 9 week moving averages as support.
1
211
$BTC Bitcoin is guilty.
bitcoin:native Bitcoin is falling out of the wedge.
I’ve never removed the fibs for this reason.
Yes, there’s still time for it to flip the script, but it’s guilty until proven innocent.
98
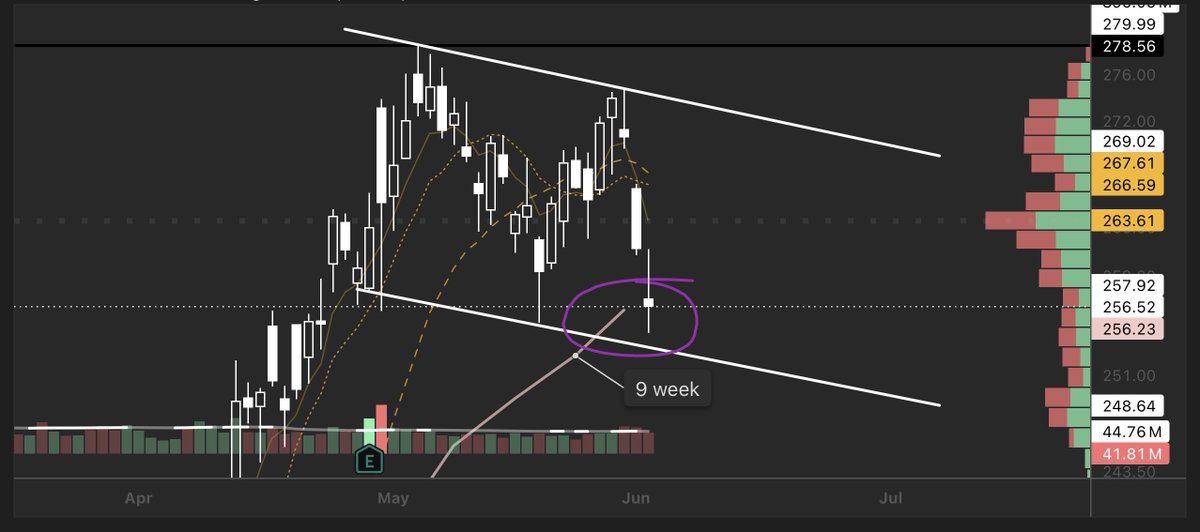
$AMZN Amazon is holding at the 9 week moving average.
It’s still a little early, but it has this possible flag pattern building out.
Which is bullish 👍
113
bitcoin:native Bitcoin is falling out of the wedge.
I’ve never removed the fibs for this reason.
Yes, there’s still time for it to flip the script, but it’s guilty until proven innocent.
1
151
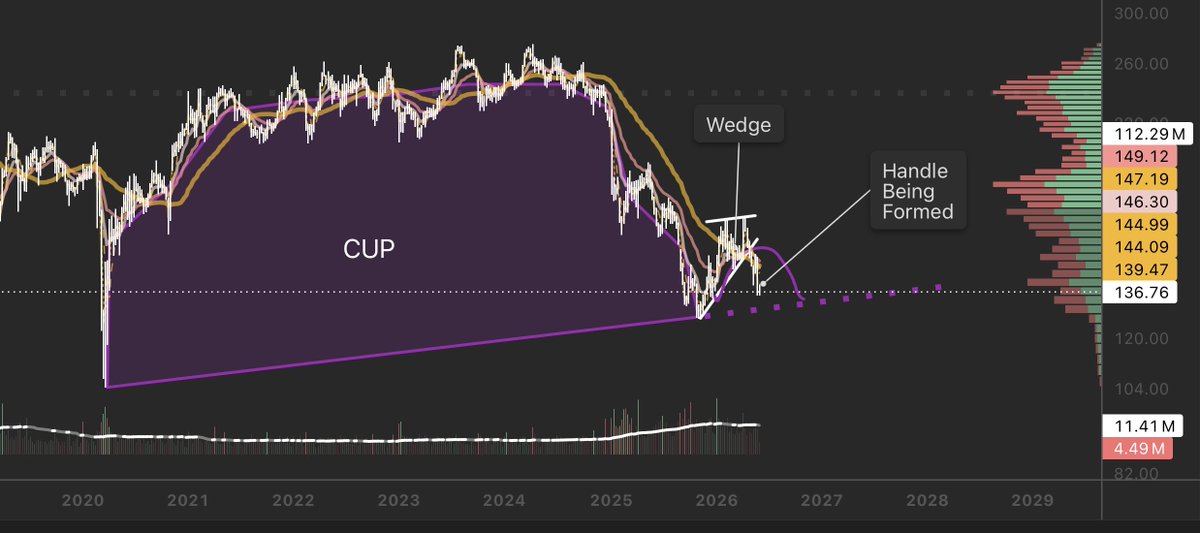
$STZ Constellation still forming the cup & handle.
Apr 30
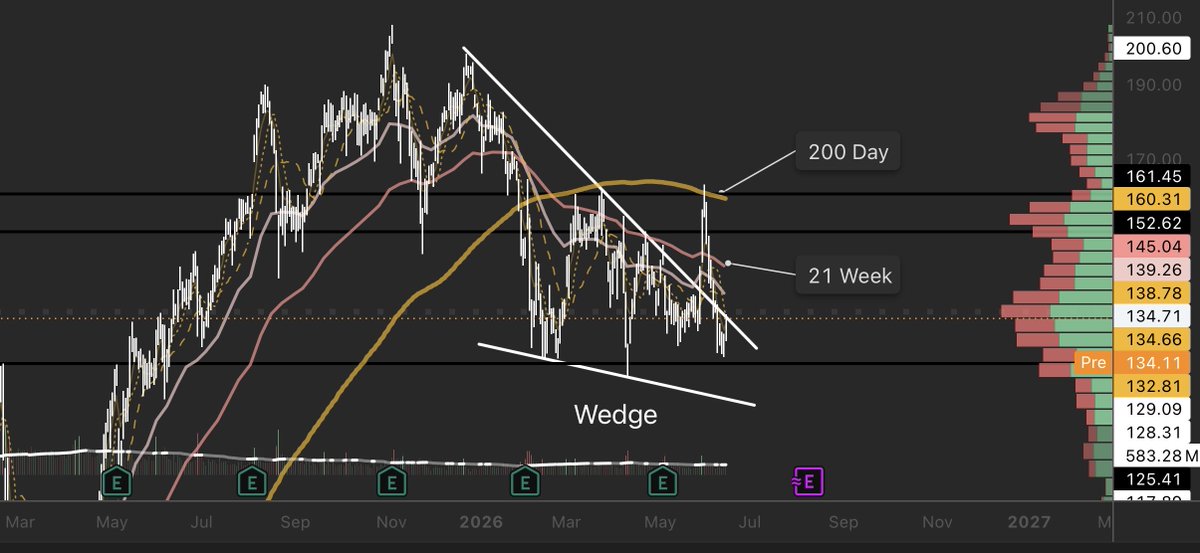
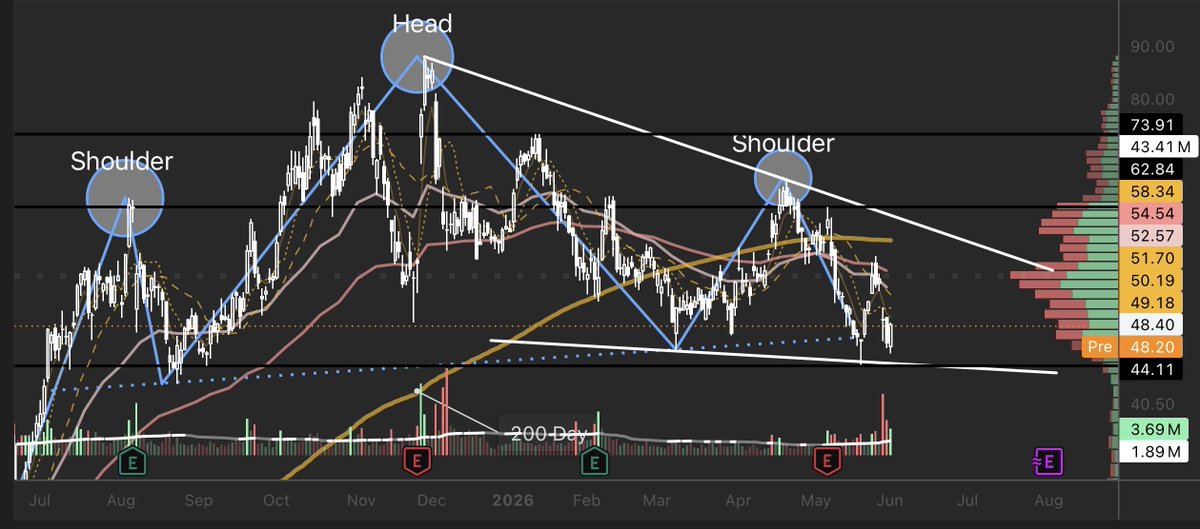
$STZ Constellation Brands: Is this a long reversal, or is it creating an inverted cup and handle?
The first picture shows that, long term, it created a cup.
The next picture shows that, short term, it had a nice reversal and started forming a wedge. Rising wedges typically fail unless the stock is not as bullish as it appears.
Currently, it is right at the 200 day moving average. I would like to see if the 200 day acts as support over the next month.
I would like to add that the 9/21 weekly cross hasn’t been crossed in over a year.


55
$ACHR Archer Aviation
The volume may not be lighting up, but it is increasing from its previous weekly closes. I want it to make that 21 week key support.
192
$SMR Nuscale Power
Sometimes, just keep it simple.
I want to see it take that supply wall as it takes on the 21 week moving average.
181

$COOK Traeger continues breaking out from the falling wedge.
That $75 supply wall is the current obstacle. I didn’t catch that on my previous post.
May 29
$COOK Traeger
Another great setup playing out. I don’t have it marked, but $75 and $105 area are both walls for it. It doesn’t mean it won’t break those walls. I’m just telling you where to expect resistance and/or support.
47
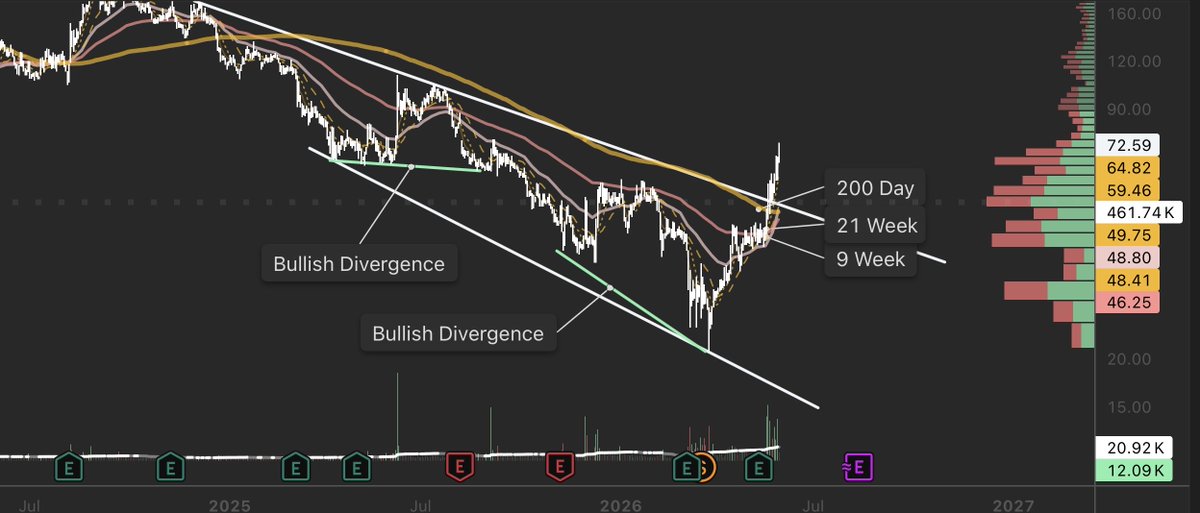
$EU enCore energy is still in a falling wedge.
I’m keeping a close eye on it to see if it wants to break out.
1
76