
Joined March 2021
- Tweets 5,521
- Following 511
- Followers 5,811
- Likes 6,866
1,565 Photos and videos


Pinned Tweet

Apr 19
$troll is up 60% since my post.
Usually I can tell when a coin is bottoming and ready to reverse, even if it is only for a shorter term move.
When I saw $neet running, the first coin that came to my mind was $troll.
The copyright angle also made it more interesting because no other coin could really vamp it.
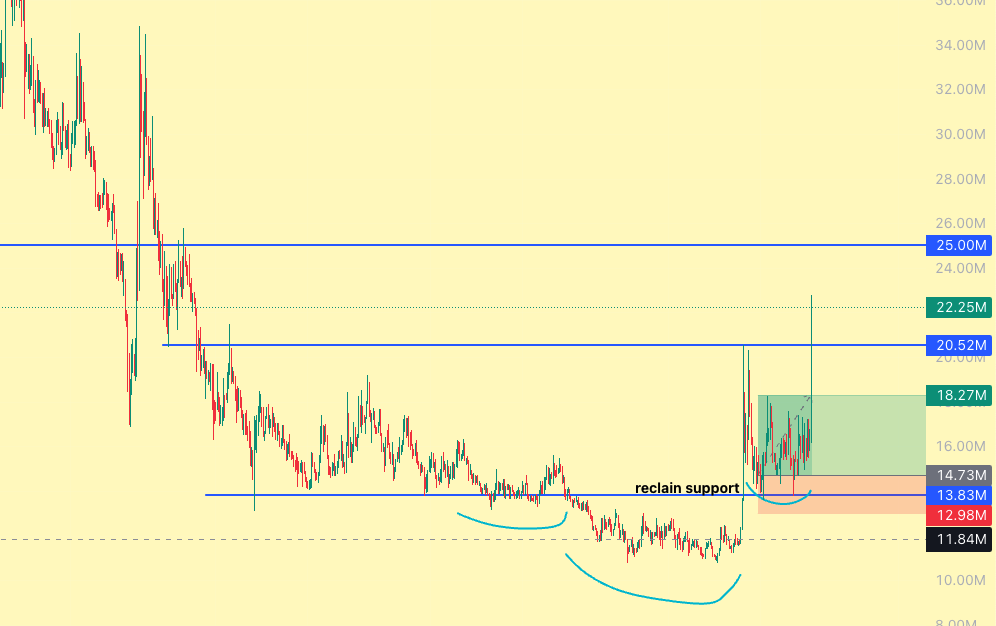
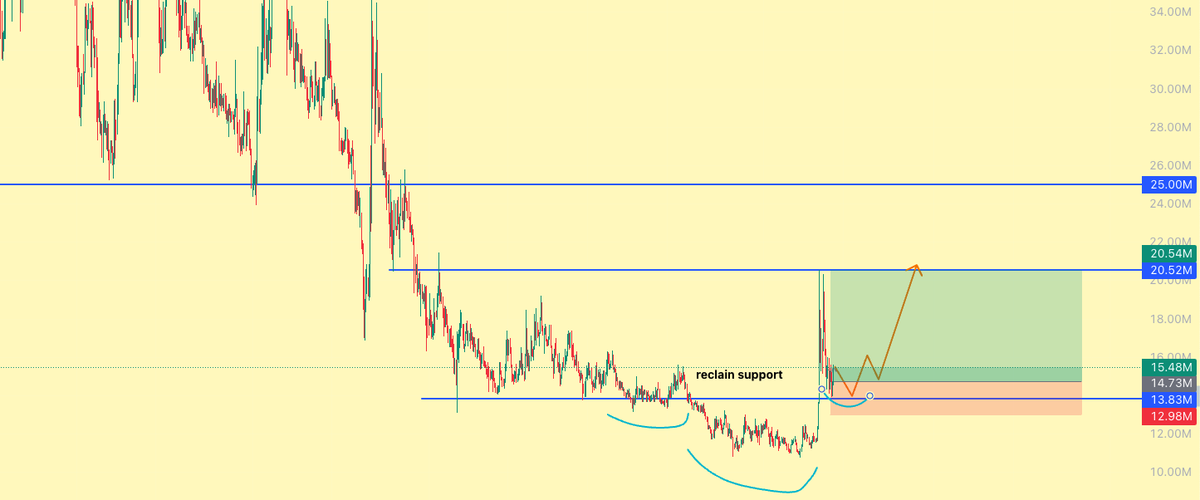
From the chart,
it reclaimed the 13.8M support and that was key for me that there are no more sellers left
Now what am I expecting?
To be honest, it already exceeded my expectation from the trade.
But in the short term, I still think it can push into the 25M area.
Apr 13

One of the coins I am also watching is $TROLL, especially after $NEET pumped.
On the chart, it reclaimed the previous support around 13M and then rallied to 20M.
Right now, the main thing I want to see is that support continue to hold.
I would say the best area to look for an entry is around 14M support, with a target around 20M near the previous swing high.
What makes this setup good is that the invalidation is also easy. If it loses 13M, then the setup is probably wrong and you cut it.
2
1
34
23,533
9h
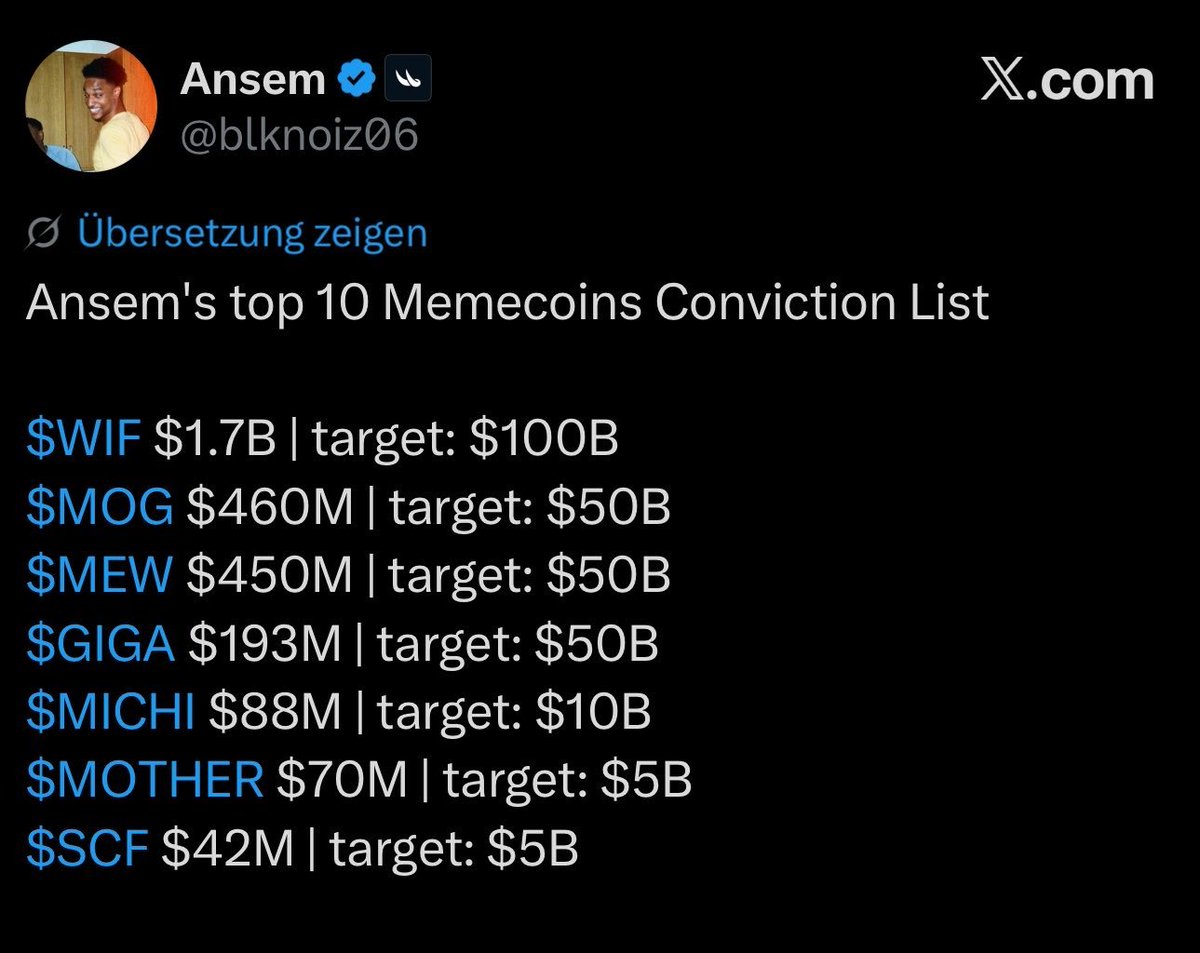
Remember to take profits.
None of these hit the targets he predicted, and now they’re down 99%.
3
1
22
641
19h
My greedy side wanted $HYPE lower for the long, but the moment it swept liquidity below support and reclaimed, that was the best entry.
1
1
12
535
Jun 15
Some people sold their bags to buy this scam coin
It will go to zero
2
1
14
1,068
Jun 14
solana:Dz9mQ9NzkBcCsuGPFJ3r1bS4wgqKMHBPiVuniW8Mbonk looks good after retesting the breakout range.
2
1
14
725
Jun 14
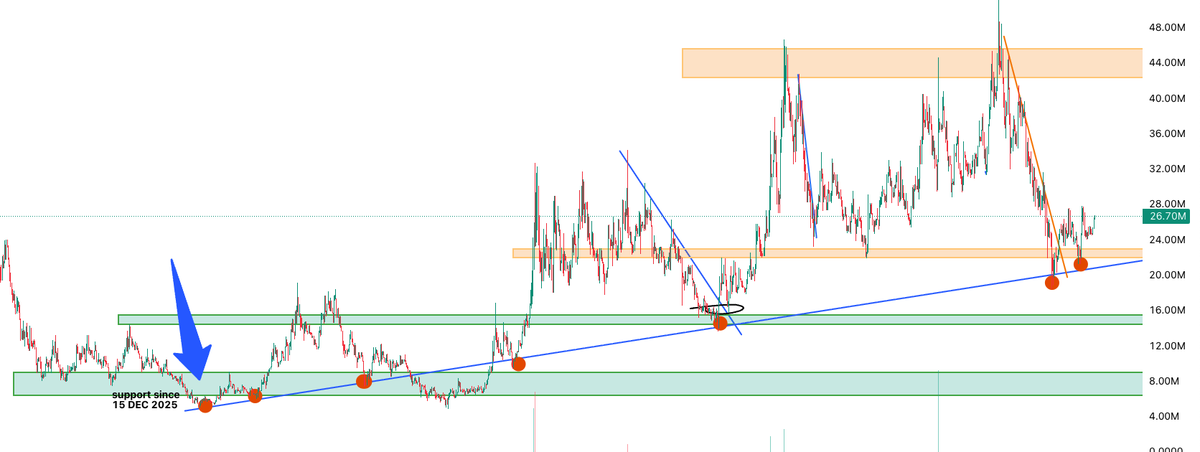
One thing I noticed in crypto is that patterns repeat a lot, even when the market feels uncertain.
Look at $NEET.
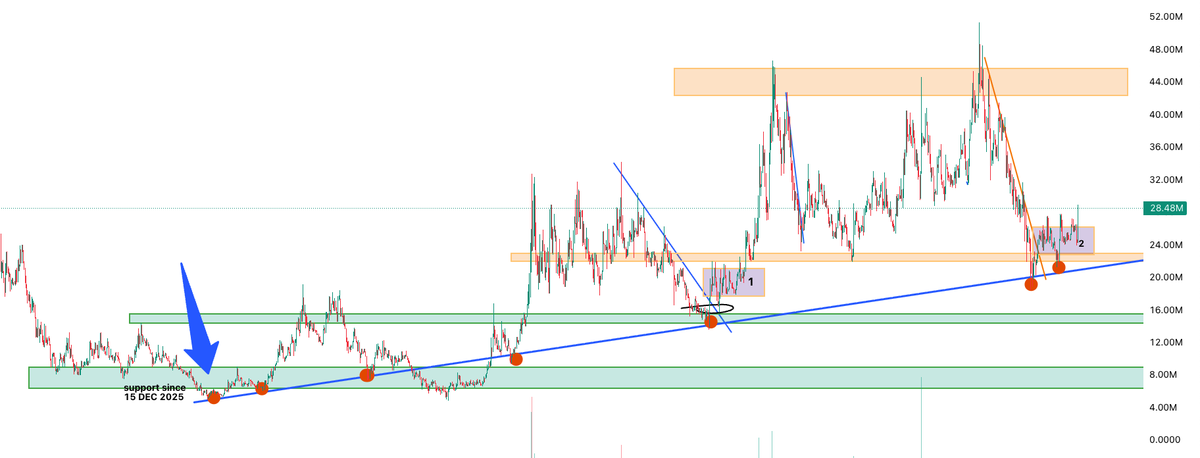
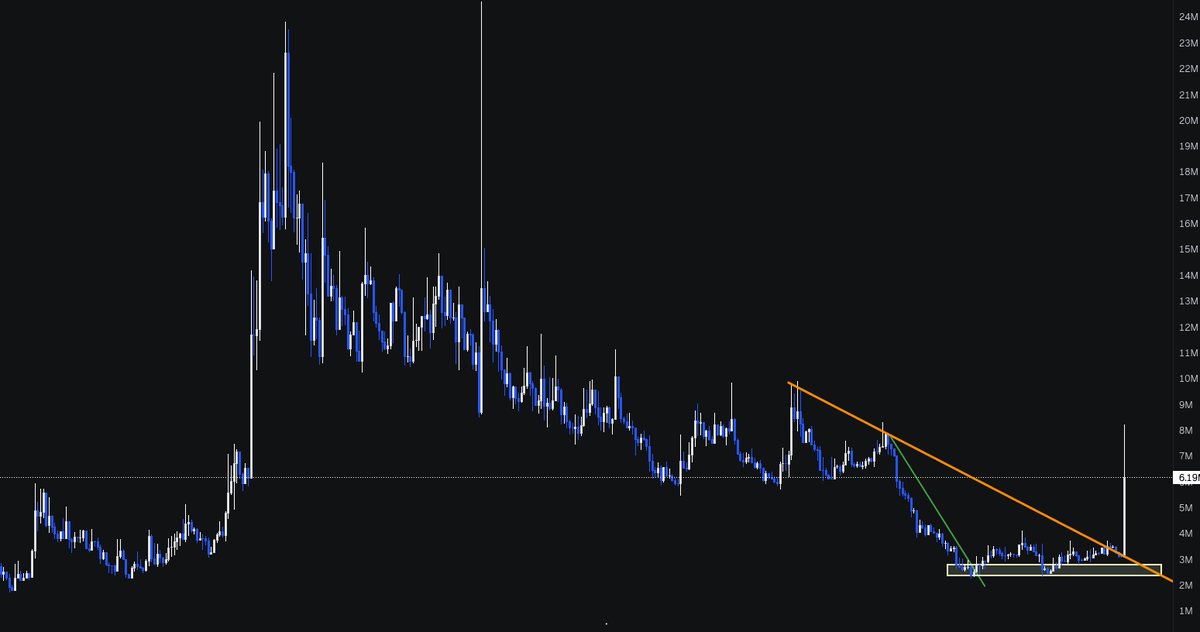
This higher timeframe trendline support has been holding since Dec 15, 2025. Every time price comes back to it, it reacts.
The last touch was around 20M, and it held again.
That is the area where the risk is clear.
If the trendline breaks, the idea is wrong. If it holds, the upside back to resistance is much bigger.
Another thing I noticed is the blue boxed structures.
Before the last big move, price reclaimed support, chopped in a tight range, then expanded higher.
Now we are seeing something very similar again after the trendline reclaim.
Same HTF support.
Similar consolidation.
Same type of structure before expansion.
If this pattern repeats, $NEET can make a move back to the upper range and maybe even push for a new ATH.
Jun 13
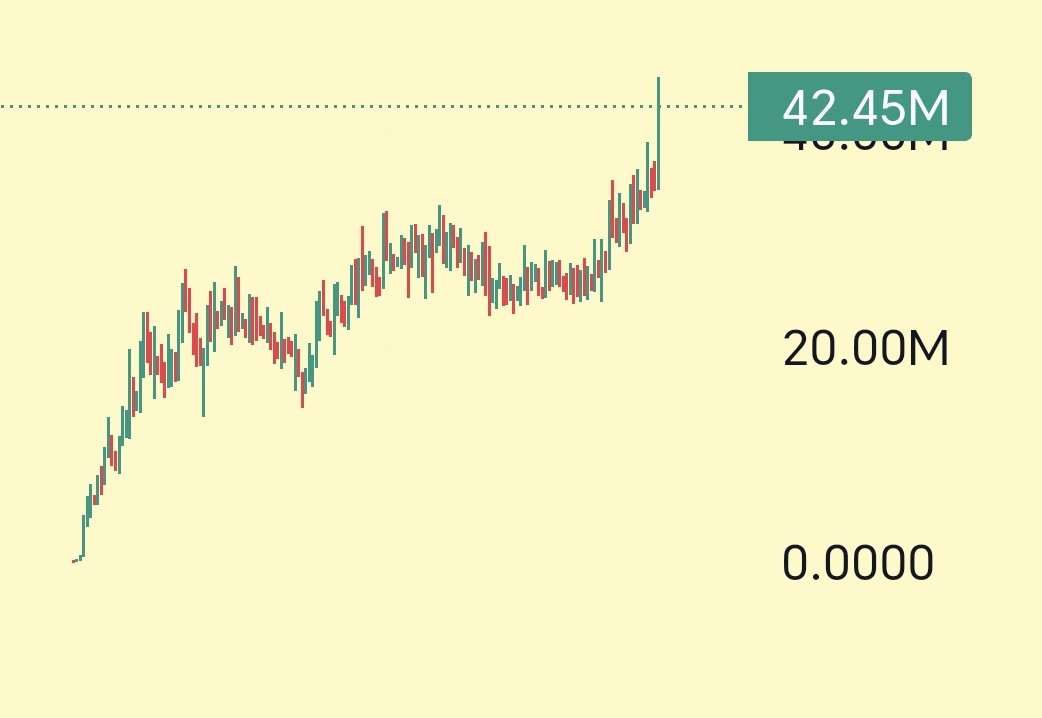
I have been analysing the $NEET chart.
What stands out to me is that the same trendline support has been holding since Dec 2025.
Every time $NEET had a major pullback into this line, it reacted and continued higher. Now it has tested that same support again around the 20M area after coming down from the 45M zone.
So far, the reaction from 20M looks good, and price is trying to reclaim the 26–28M area.
If this trendline continues to hold, then 20M was likely the bottom and $NEET should start pushing higher again.
But if it loses this trendline and closes below the 20M area, then the short-term structure turns bearish and recovery becomes much harder.
2
25
1,520
Jun 14
I never share topped coins or random bad trade ideas.
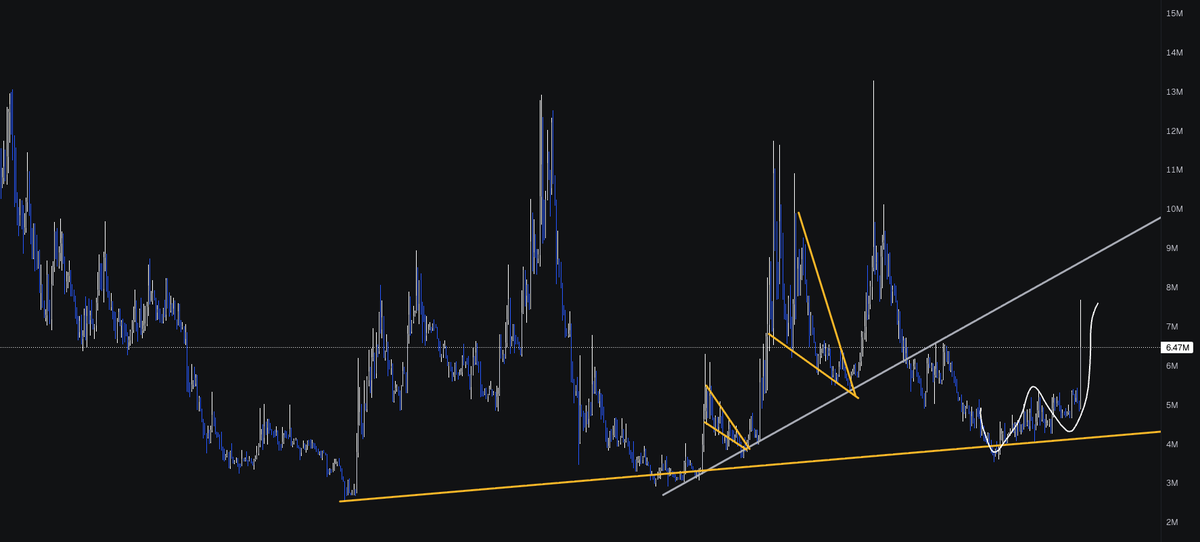
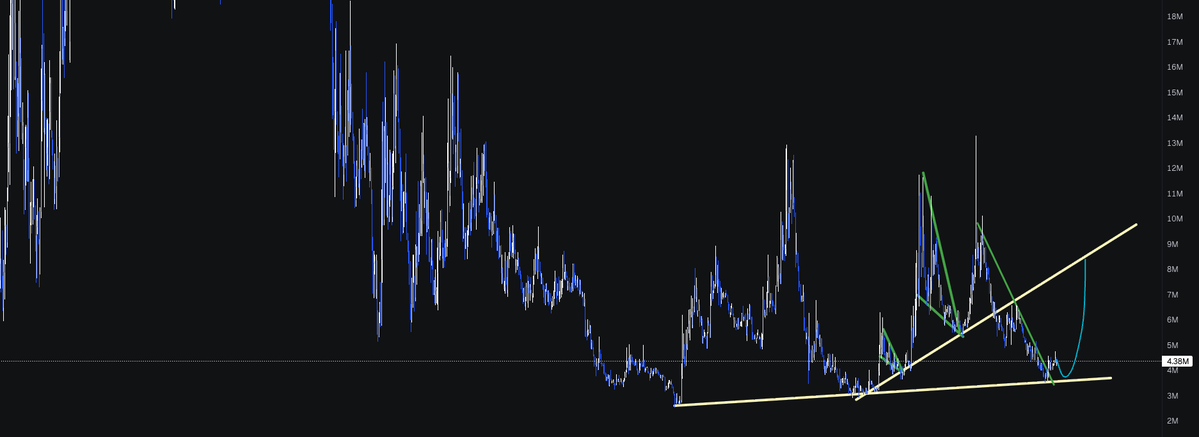
When I found $WOJAK, it was sitting near the bottom around a key support zone.
That is the type of trade I pay attention to because the risk is limited and the upside is much bigger.
The main reason this trade stood out to me was the higher timeframe trendline support. It already held twice before, and the third touch is not late if the structure is still good.
The goal is not to overcomplicate it.
Buy near support, invalidate if the level breaks, and ride it back toward the upper resistance.
That is exactly what happened with $WOJAK. It is now almost up 2x from the area I was watching.
When charts are bottoming, there is usually no attention.
It feels boring. But that is usually the best time to position yourself before everyone starts chasing.
Jun 7
Best case scenario for SOL ethereum:0x8de39b057cc6522230ab19c0205080a8663331ef
retest and push higher
2
1
14
843
Jun 14
This time I did not sell for peanuts and I did not miss the gulag express.

2
2
22
998
Jun 14
I bought $BURNIE near the bottom and shared it in the discord and it is now up 3x
Was it guaranteed? No.
But the trade was good enough for me.
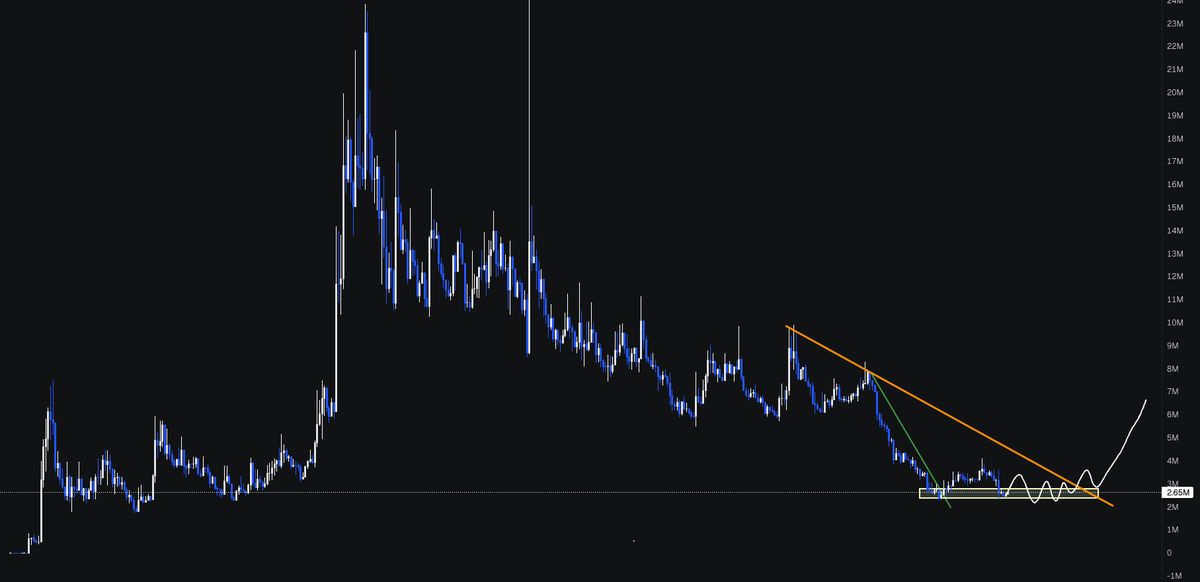
Consolidation range, double bottom below the 0.86 fib, and price sitting near the downtrend resistance.
Then you add good X engagement, memes still alive, and a narrative people actually care about.
Chart attention clear invalidation is all you need
2
2
25
1,215
Jun 14
i do not what happened but $burnie is sending
it is up 3x
Jun 10
Double bottom on solana:CGEDT9QZDvvH5GmVkWJH2BXiMJqMJySC9ihWyr7Spump.
This is what I’m expecting:
Consolidation for a while, then a break of the downtrend line.
and then you get easy trade
5
16
865
Mx retweeted
Jun 14
This mindset will kill your port.
You are hoping one coin will save you instead of actually playing the game and compounding your wins.
no one knows where it will go
2
1
12
648
Jun 14
which one would you bid. solana:BcHEaaTCvycPwwsJ9yQTXdHP9X2gCLkznDbZ8VySpump or solana:B6f27ETGcjgGNB1fqULJbXVmw9FnL8HgBp7R83hmpump

6
1
11
938
Jun 14
$troll breaking out

Jun 13
best case scenario for solana:5UUH9RTDiSpq6HKS6bp4NdU9PNJpXRXuiw6ShBTBhgH2
textbook pattern

8
6
37
2,357
Jun 13
I have been analysing the $NEET chart.
What stands out to me is that the same trendline support has been holding since Dec 2025.
Every time $NEET had a major pullback into this line, it reacted and continued higher. Now it has tested that same support again around the 20M area after coming down from the 45M zone.
So far, the reaction from 20M looks good, and price is trying to reclaim the 26–28M area.
If this trendline continues to hold, then 20M was likely the bottom and $NEET should start pushing higher again.
But if it loses this trendline and closes below the 20M area, then the short-term structure turns bearish and recovery becomes much harder.
2
2
21
2,775