
Advancing knowledge of Earth's frozen regions.
Joined September 2008
- Tweets 7,511
- Following 580
- Followers 18,029
- Likes 4,173
2,148 Photos and videos


Pinned Tweet

18 Nov 2022
You can also find NSIDC on:
Facebook: facebook.com/NSIDC
Instagram: instagram.com/nsidcnews/
YouTube: youtube.com/nsidc1
18 Nov 2022

In today's uncertain Twitter climate, we'd like to direct you to, and encourage you to follow us on, our other social media platforms:
Facebook: facebook.com/CIRESnews
Instagram: instagram.com/ciresnews
YouTube: youtube.com/@CIRESvideos
Mastodon: newsie.social/@CIRESnews
7
8
25
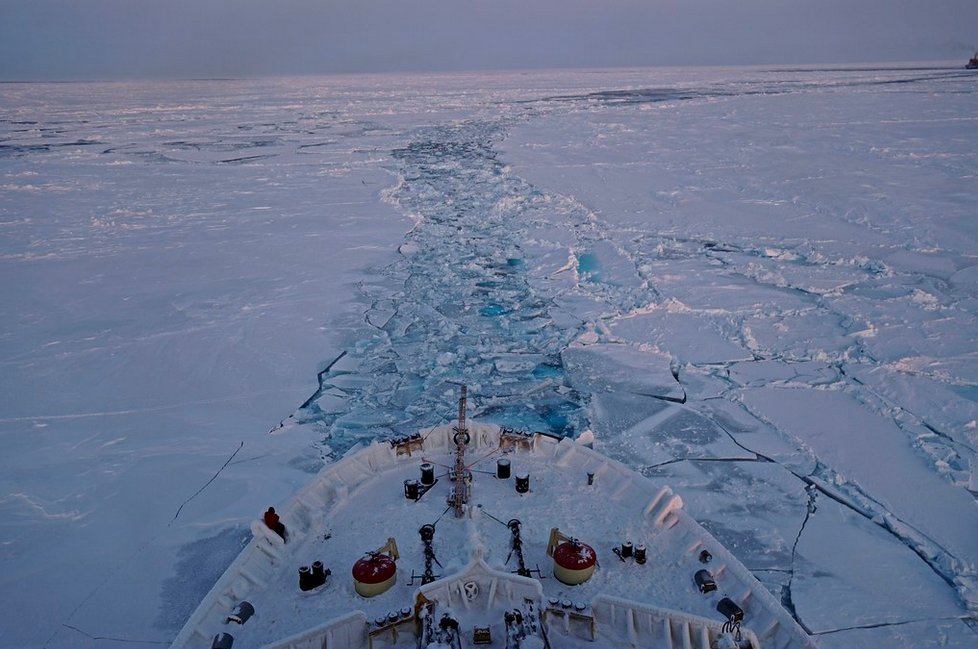
Grease ice makes the water resemble an oil slick, the small crystals of ice held closely together reflect and refract light similarly to how oil will on water. Photo by Nina Munteanu. Find more terms of Earth's frozen region in NSIDC's glossary: nsidc.org/learn/cryosphere-g…
1
3
204
Name three differences between Arctic and Antarctic sea ice. Find the answers in NSIDC's learn pages and why scientists focus more on Arctic sea ice: bit.ly/4xg3YbH
2
1
228
Scientific data should be FAIR: Findable, Accessible, Interoperable, and Reproducible. Openscapes helps with that. Be inspired to collaborate on your research! bit.ly/4erHL2V
3
3
204
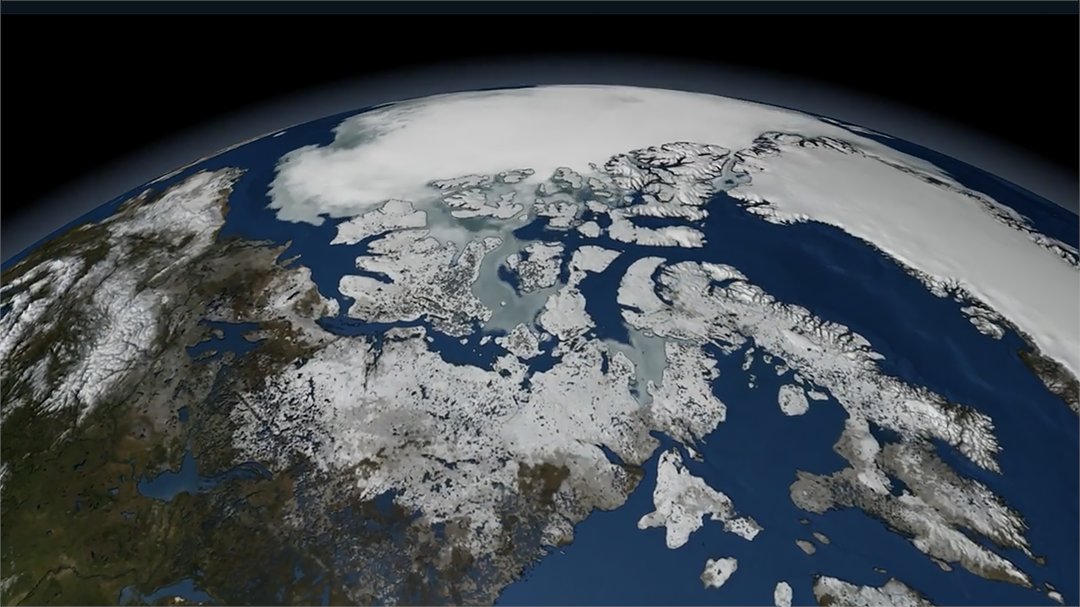
The Advanced Microwave Scanning Radiometer-Earth Observing System's (AMSR-E's) sensor can pierce clouds. Even in polar darkness it tracks sea ice changes year-round. AMSR-E data are available from the NASA NSIDC Distributed Active Archive Center (DAAC). bit.ly/43jRNgn
4
6
369
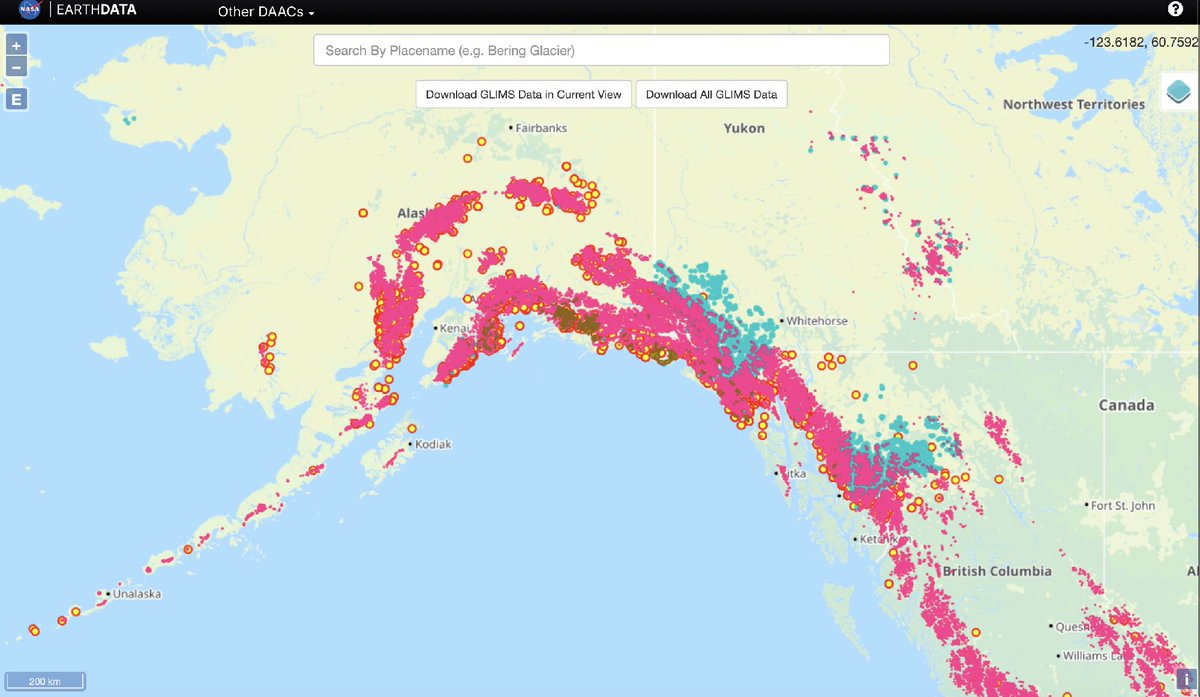
Zoom in or out as much as you like with the Global Land Ice Measurements from Space (GLIMS) Viewer. GLIMS data are distributed by the NASA NSIDC Distributed Active Archive Center (DAAC). glims.org/maps/glims
223
The National Oceanic and Atmospheric Administration at NSIDC (NOAA@NSIDC) program is one of the only places in the world that archives long-term records of Earth's frozen regions. See the most popular products: nsidc.org/data/data-programs…
4
5
425
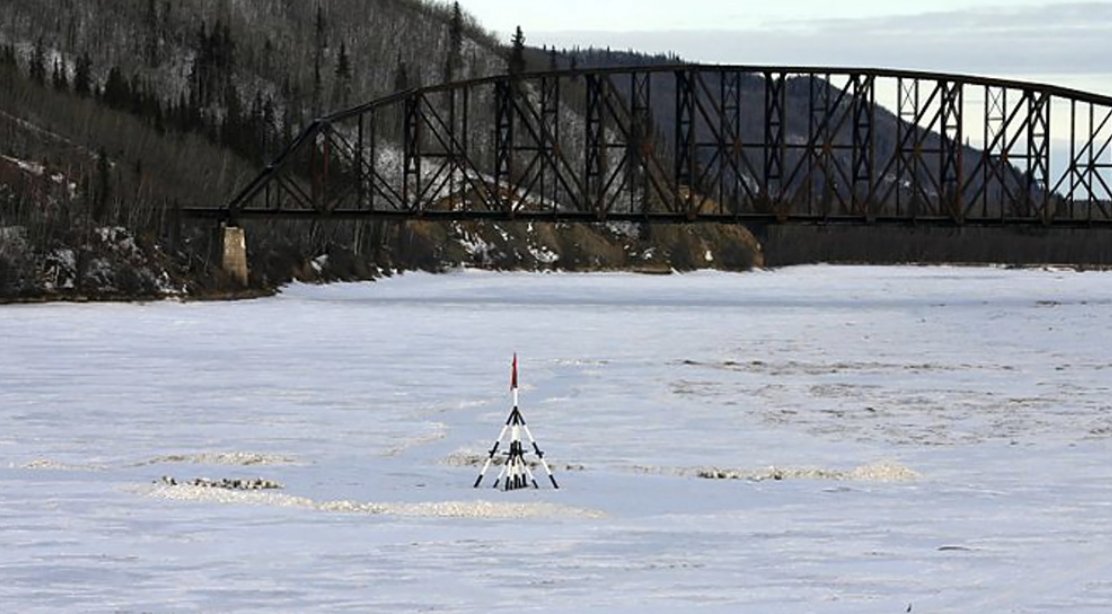
Since 1917, Nenana, Alaska, has hosted a contest to predict when ice on the Tenana River breaks up come spring. A tripod, wired to an onshore clock, is planted during freeze up. The clock stops when the tripod moves. See the data at the NASA NSIDC DAAC: bit.ly/43i7Lrk.
1
7
477
Did you know that the NOAA Multisensor Analyzed Sea Ice Extent-Northern Hemisphere (MASIE-NH) offers daily images and times series plots for individual Arctic regions? Such as Baffin Bay, which has hit a record low since early May. Check out other regions: bit.ly/4aqImiP
1
1
1
263
With support from @NASA, the Snow International (SINTER) and CUHASI Snow Measurement Field School will take place in New Hampshire next year. Participants can apply later in summer 2026; learn more from last year's snow school: bit.ly/4eradSs
1
197
The NSIDC monthly newsletter is due to come out shortly. Don't miss out. Sign up to learn more about NSIDC's research, data, and stories. bit.ly/3Q1Snvv
1
1
168
Snow-covered area across the West was 49 percent of average for May, ranking last in the 26-year satellite record. Snow water equivalent remained well below average in most states, confirming a worrisome outlook for the summer. Read NSIDC's Snow Today: bit.ly/3Q20sRs
5
5
415
The Extreme Ice Survey (EIS) images at NSIDC include over 1.5 million glacial photographs from 2007-2022, capturing time-lapse changes in arctic and alpine landscapes. This collection provides crucial data on the speed and extent of glacial retreat. youtube.com/watch?v=5wtlbhjc…
2
300
The NASA NSIDC Distributed Active Archive Center (DAAC) has updated Sea Ice Concentrations from Nimbus-7 Scanning Multichannel Microwave Radiometer (SMMR) and Defense Meteorological Satellite Program (DMSP) SSM/I-SSMIS Passive Microwave Data through 2025. bit.ly/4wWJzrO
1
4
395
The Daily Great Lakes Ice Concentration data set consists of daily gridded ice concentrations from December 20, 1972, to May 21, 2023, as gridded ASCII text files with corresponding browse images and shapefiles also available since the 2003 ice season. bit.ly/3RDUqH6
1
5
273
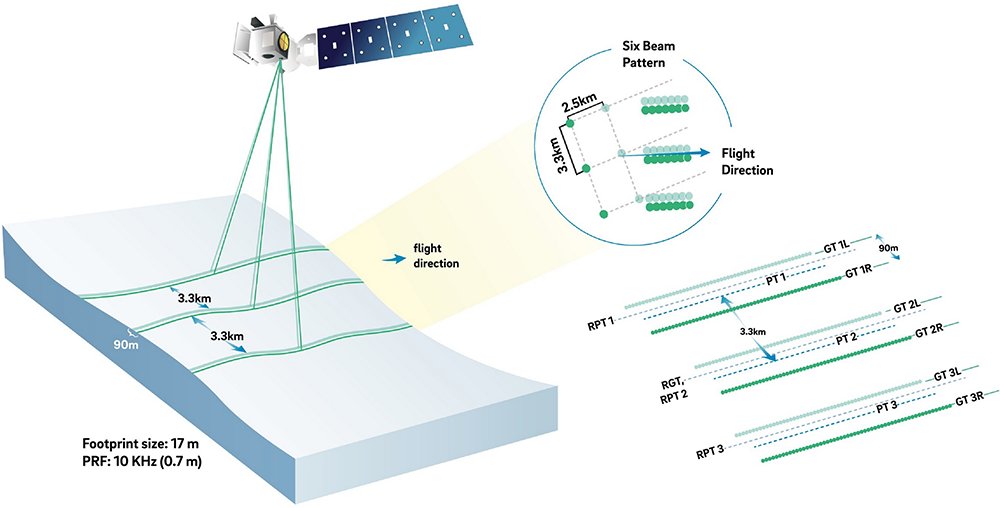
NASA's Advanced Topographic Laser Altimeter System (ATLAS) aboard Ice, Cloud and Elevation Satellite-2 (ICESat-2) employs three pairs of laser beams aimed at Earth’s surface, emitting 10,000 pulses per second, with 300 trillion photons per pulse. bit.ly/4ai0ICD
3
7
286
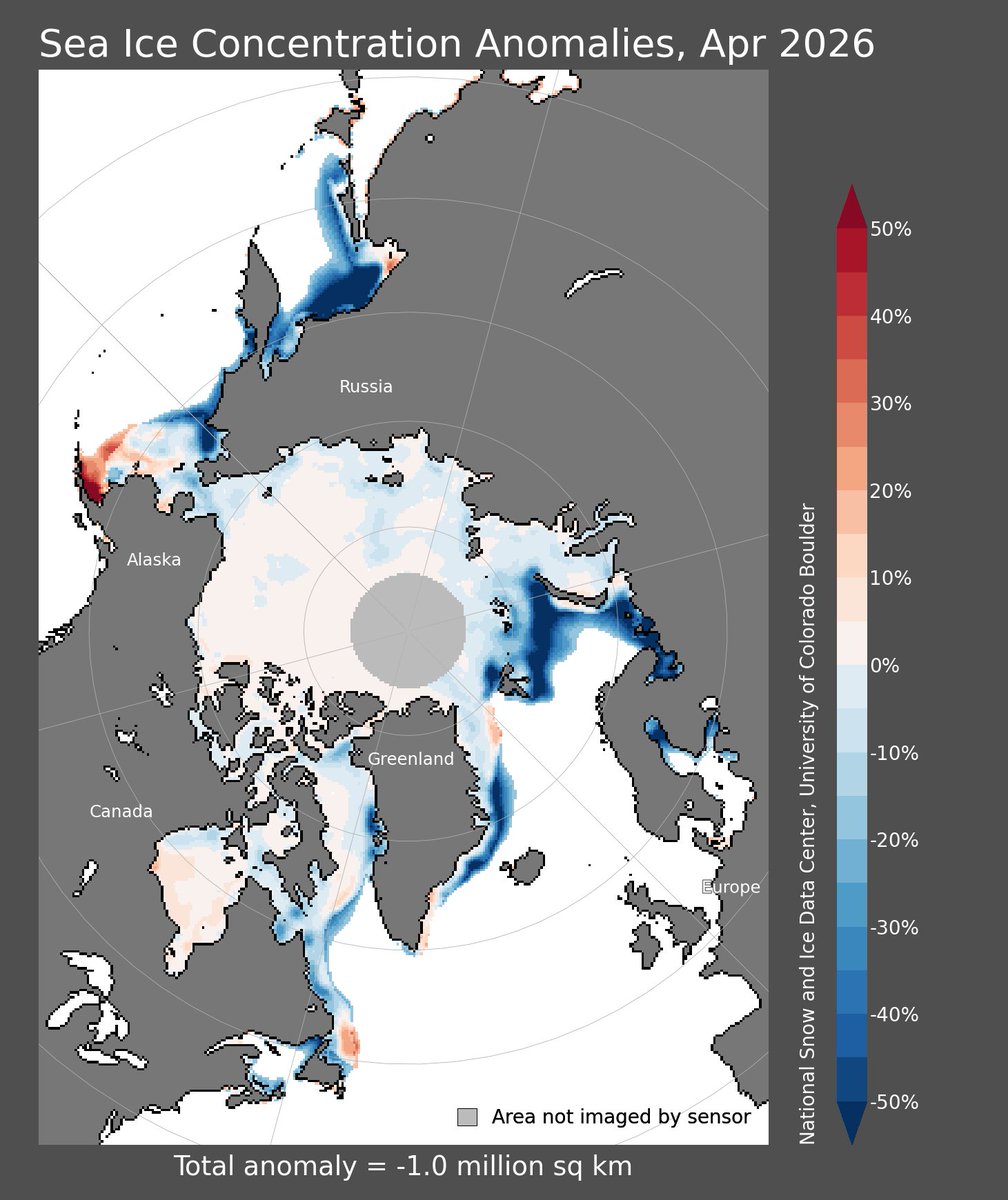
NOAA's monthly Sea Ice Index shows changes in polar sea ice extent and concentration since 1979. The index also offers monthly images of differences from average in ice concentration: blue values indicate below the 1981-2010 average, red are above average. bit.ly/4rC92nn
2
3
9
425
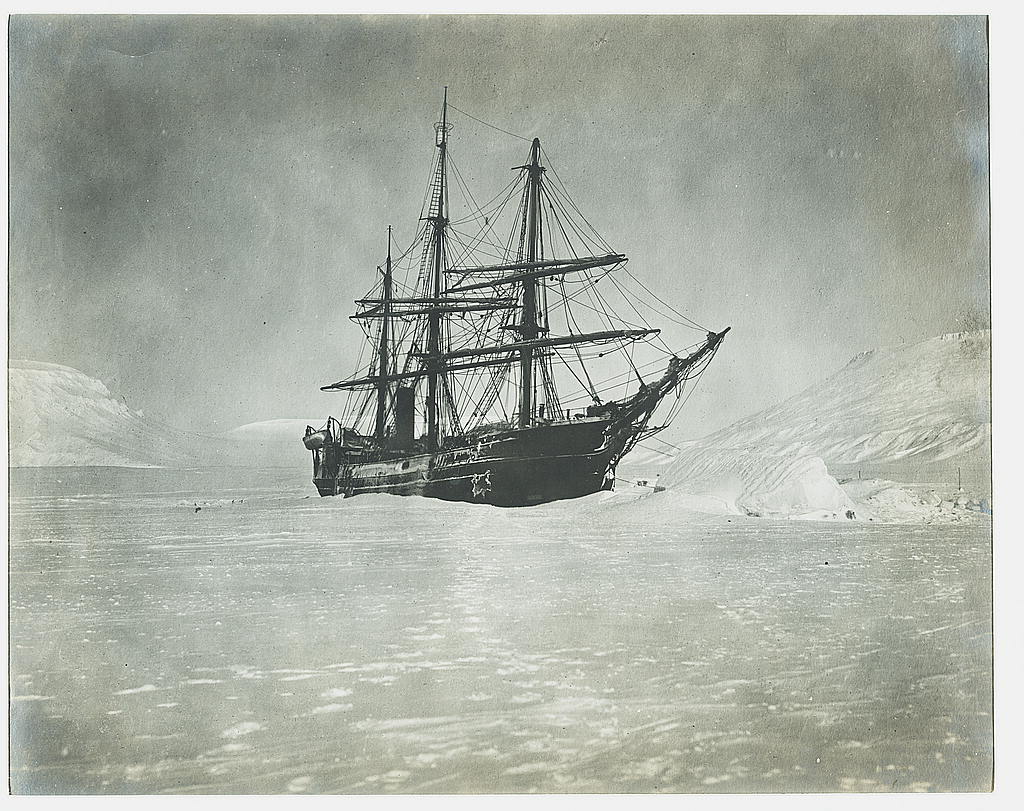
Before satellites, scientists stitched together aerial photographs of big features, such as Greenland’s Jakobshavn Glacier. This composite image dates from 1970 and 1971 and is now available in the NSIDC Glacier Photograph Collection. nsidc.org/data/glacier_photo…

3
6
265
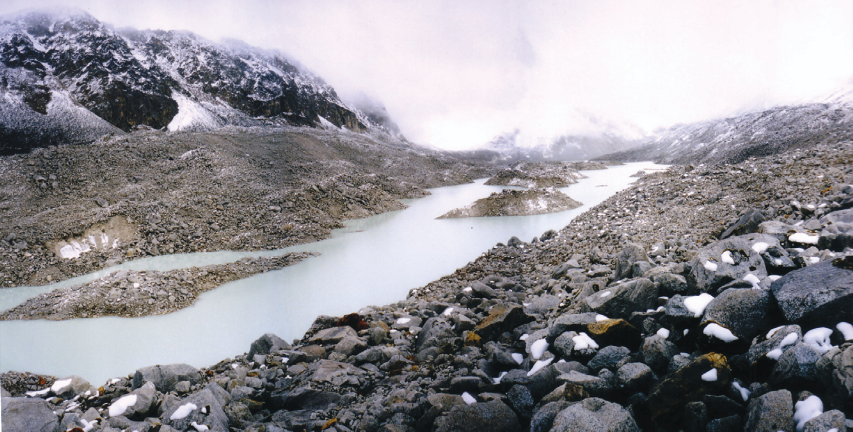
High Mountain Asia has glaciers topped with debris topped with lakes, and you can find those lake extents at the NASA NSIDC Distributed Active Archive Center (DAAC). bit.ly/4uG9djc
1
6
389
Take a climate change tour of the cryosphere with our Google Earth activities. nsidc.org/data/google_earth

5
258
The NSIDC Distributed Active Archive Center (DAAC) NASA Earthdata Cloud data collection includes all NSIDC DAAC data that have been migrated into the NASA Earthdata Cloud, which is a lot of data, enough to fill libraries. nsidc.org/data/earthdata-clo…

1
6
344