
Financial Data Scientist. Former Stockbroker, Former Intelligence Analyst discussing women, guns, and money.
Joined May 2025
- Tweets 9,147
- Following 1,223
- Followers 381
- Likes 28,744
365 Photos and videos


Pinned Tweet

30 Sep 2025
A thread 1/2
The Real History of School Violence in the United States: A Comprehensive Analysis:
Mass Casualty School Violence: Comprehensive Data Analysis
Based on rigorous analysis of mass casualty events (4 killed or wounded, excluding perpetrators and gang violence), the data reveals important patterns in American school violence that challenge common narratives about recent trends.
Historical Timeline and Key Incidents
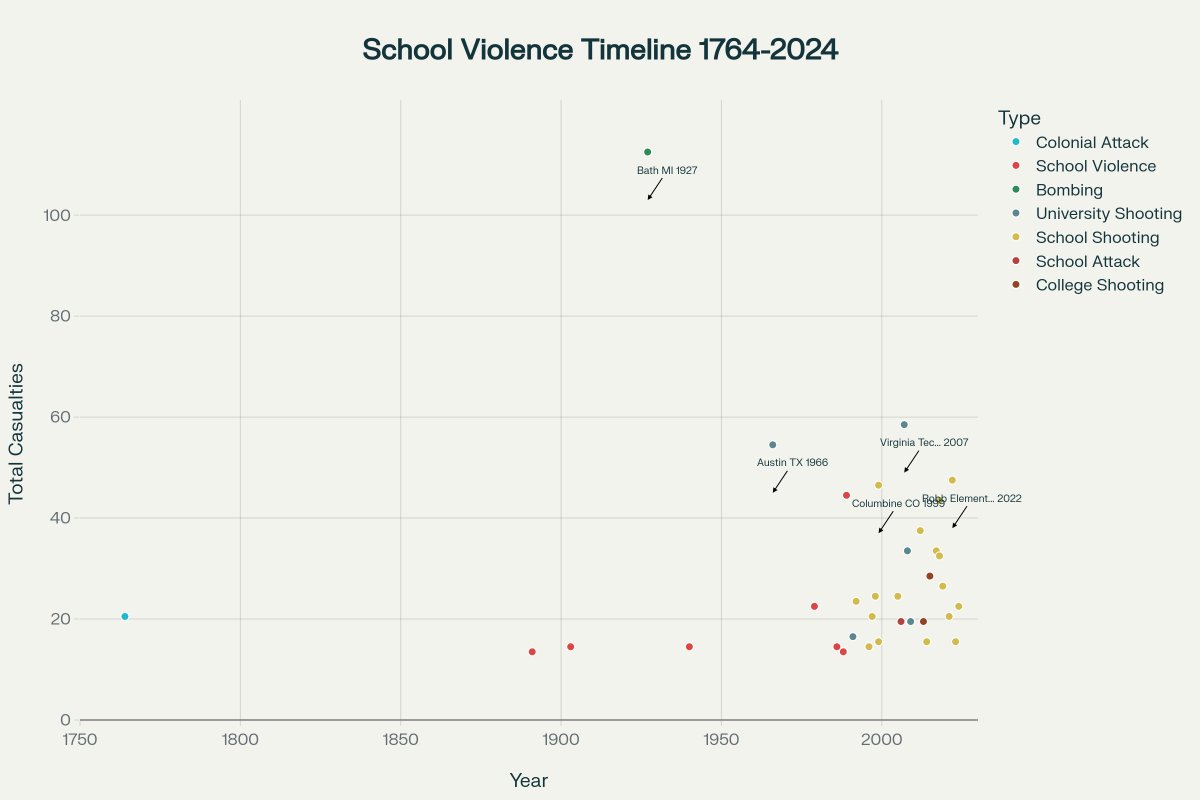
The analysis identifies 34 mass casualty school violence incidents from 1764 to 2024, resulting in 326 deaths and 336 wounded for a total of 662 casualties. The timeline shows that while school violence has deep historical roots, the nature and frequency have evolved significantly over time.
Timeline of Mass Casualty School Violence Incidents in the United States (1764-2024)
The earliest documented mass casualty event was the 1764 Enoch Brown massacre in colonial Pennsylvania, where 11 people died in a Native American raid during Pontiac's War. The deadliest single incident remains the 1927 Bath School disaster, where Andrew Kehoe used dynamite to kill 45 people and wound 58 others, making it responsible for more casualties (103) than any shooting incident before or since.
Trends by Time Period
When examining incidents by historical period, the data shows distinct patterns in both frequency and severity:
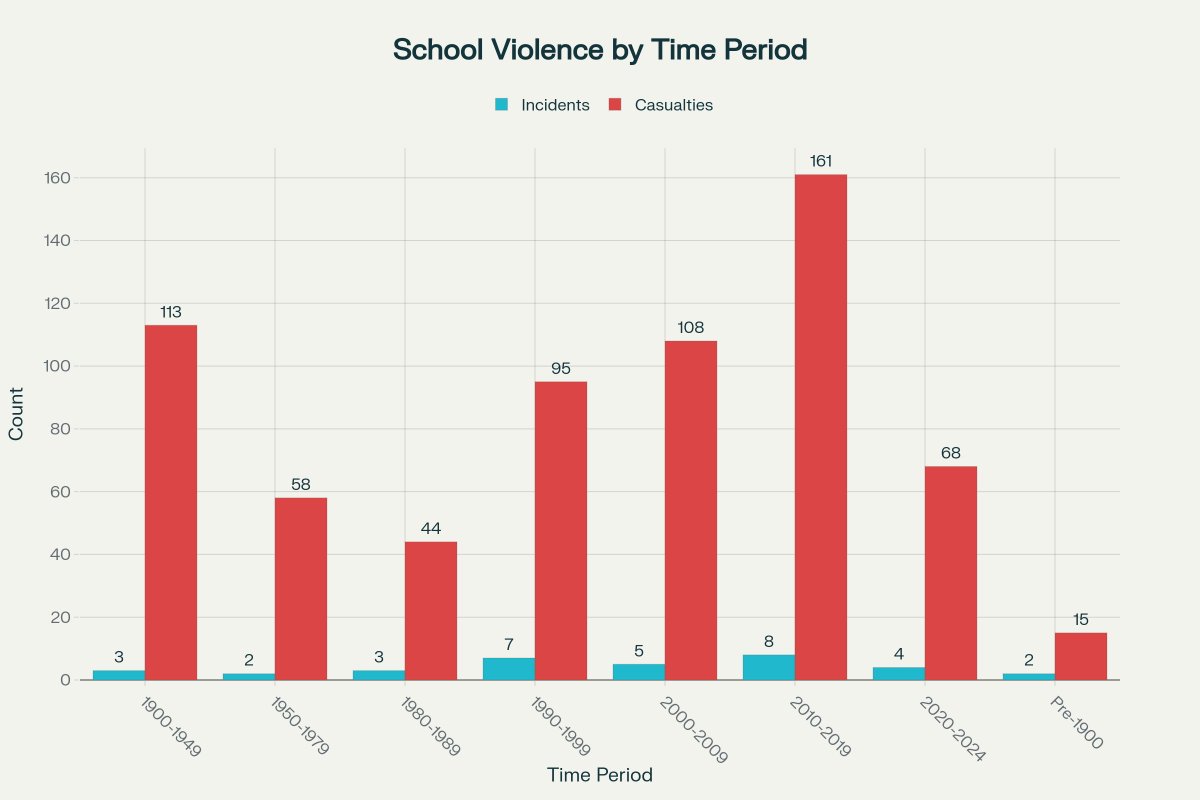
Mass Casualty School Violence: Incidents and Casualties by Time Period
The 1900-1949 period was particularly deadly due to the Bath School disaster, contributing to 54 deaths despite only 3 total incidents. The modern era (1990-2024) accounts for 24 of the 34 total incidents, representing a clear increase in frequency but not necessarily in per-incident severity.
Per Capita Analysis Reveals Complex Trends
When adjusting for student population growth, the trends become more nuanced:
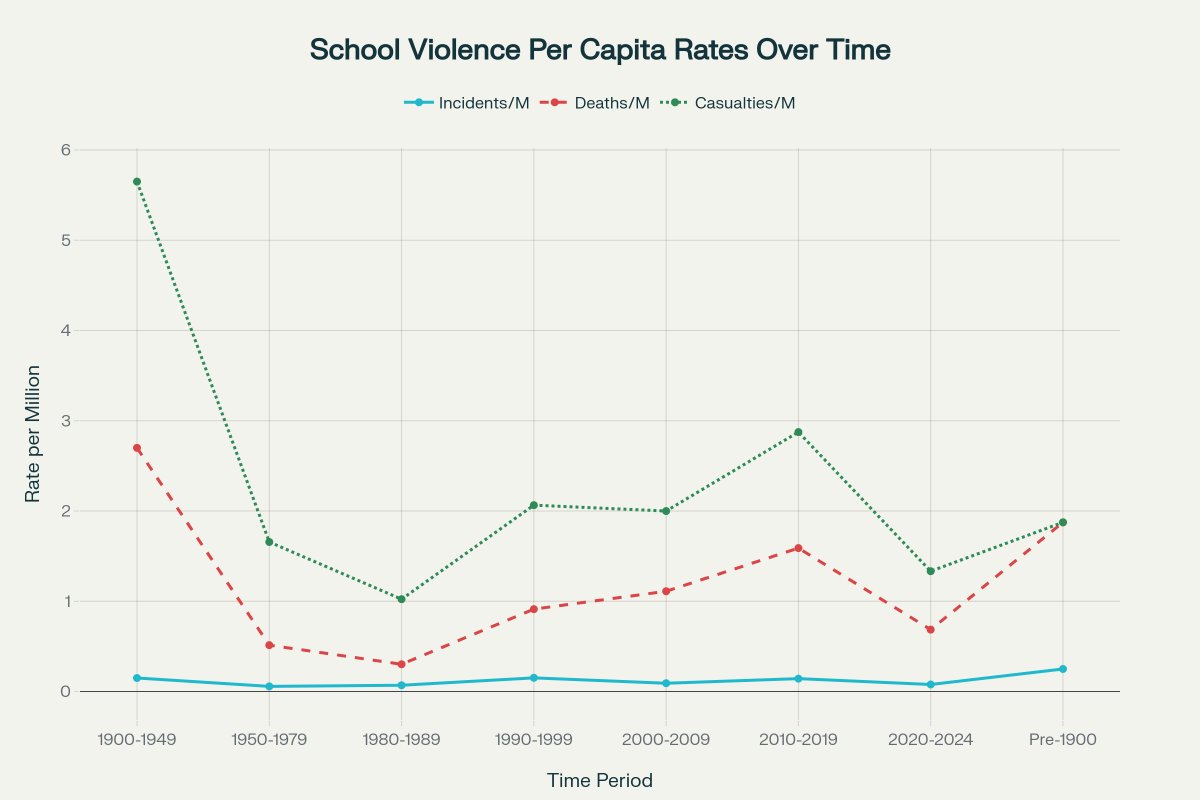
Mass Casualty School Violence Rates per Million Students Over Time
The per capita rates show that while absolute numbers have increased, the rates per million students fluctuate significantly across periods. The 1990s actually had higher incident rates (0.152 per million students) than the 2010s (0.143 per million), suggesting that perceived increases may be influenced by media coverage rather than actual statistical trends.
Modern Era Breakdown (1990-2024)
The contemporary period shows varying patterns across decades:
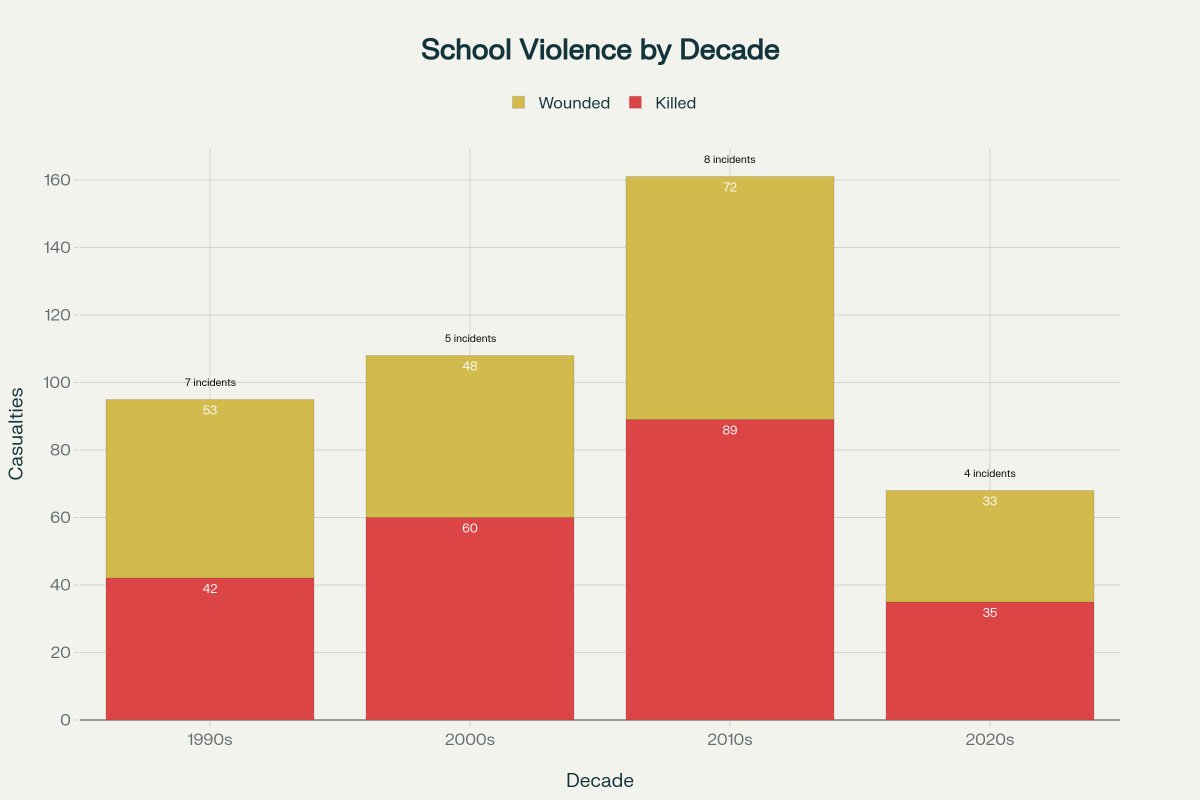
Modern Era School Mass Casualty Events by Decade (1990-2024)
1990s: 7 incidents, 42 killed, 53 wounded (95 total casualties)
2000s: 5 incidents, 60 killed, 48 wounded (108 total casualties)
2010s: 8 incidents, 89 killed, 72 wounded (161 total casualties)
2020s: 4 incidents, 35 killed, 33 wounded (68 total casualties)
The 2010s had the highest casualty count despite not having the most incidents, indicating increased lethality per event. The 2020s data is partial but shows a concerning trend of maintaining high casualty rates.
2
1
11
5,051
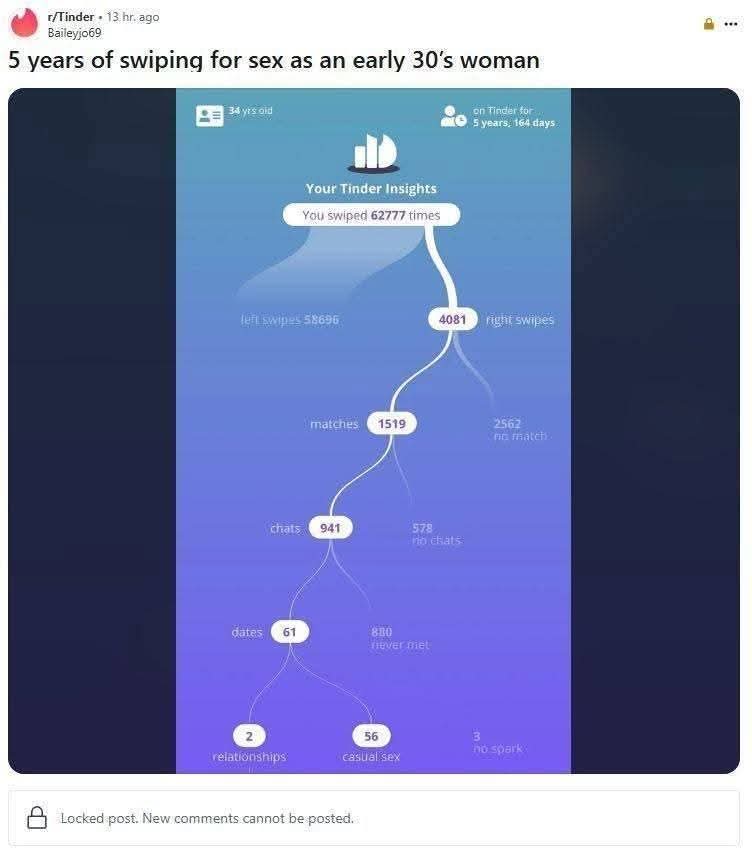
50% percent more women report being in relationships than men. Perhaps this helps it make sense.
23h

Ok, so…. I think I emotionally opted out of hookup culture… in a way…
I just expected people to immediately be my boyfriend like they used to do, so…..
…..even though the last two people I liked did not immediately- or ever- become my boyfriend…
My brain just assumed they were, in fact, my boyfriends- for 2.5 years on average…
It’s not right.
But it’s okay.
Embrace the absurd, like Albert Camus told us…
And have a ball.
1
2
103
Jun 13
Age Gap Summer's is here!
Jun 13

Travis Kelce and Taylor Swift are both 36
something so disgusting about a relationship with no age gap whatsoever
she’s old enough to be his sister

91
Jun 12
US appeals courts ruled magazines are not arms because they're not essential for a functional weapon.
Behold the new legal California legal AK.
@4BoxesDiner
@GunWashington
@hannahhill_sc
@MorosKostas
@Guns_Gadgets
Jun 12

None of this is surprising, but I always find more people who are surprised by the gas tube being removed it will still work.
29
Jun 10
1,000 swipes per date.
1 new body every month for 5 years.

1
2
64
Jun 10
Finally, a woman who admits the quit part out loud.
Look at "age, has a good job, has my same hobbies and sense of humor", first?
Oh no, got to see how hot he is before any of that matters. 🤣🤣🤣
Jun 10

Man discovers hot nerdy woman seeks hot nerdy man.
1
64
Jun 10
In both love and war, tactics are secondary to logistics.

Your logistics for dates should comprise of:
2
10
1,027
Jun 8
America's full of women this hot.
Unfortunately most are hidden under 70 pounds of fat.

1
108
Jun 3
Short dress and a hard hat in a typhoon.
Japanese girls are based.

1
1
124
Jun 2
During the civil war in Yugoslavia that standard price for sex was a small can of tuna.
America's liberals have no idea what they're asking to start.
Jun 2

If this country ever goes to hell in a hand basket all of these people who are dependent on drugs (especially the SSRIs, diabetes, and heart medications) are in for a rude awakening. We will see liberals sucking c*ck behind dumpsters for their anti-depressants after 30 days. Combat environments are no joke if you're dependent on ANY KIND of medicine.
1
70
Jun 2
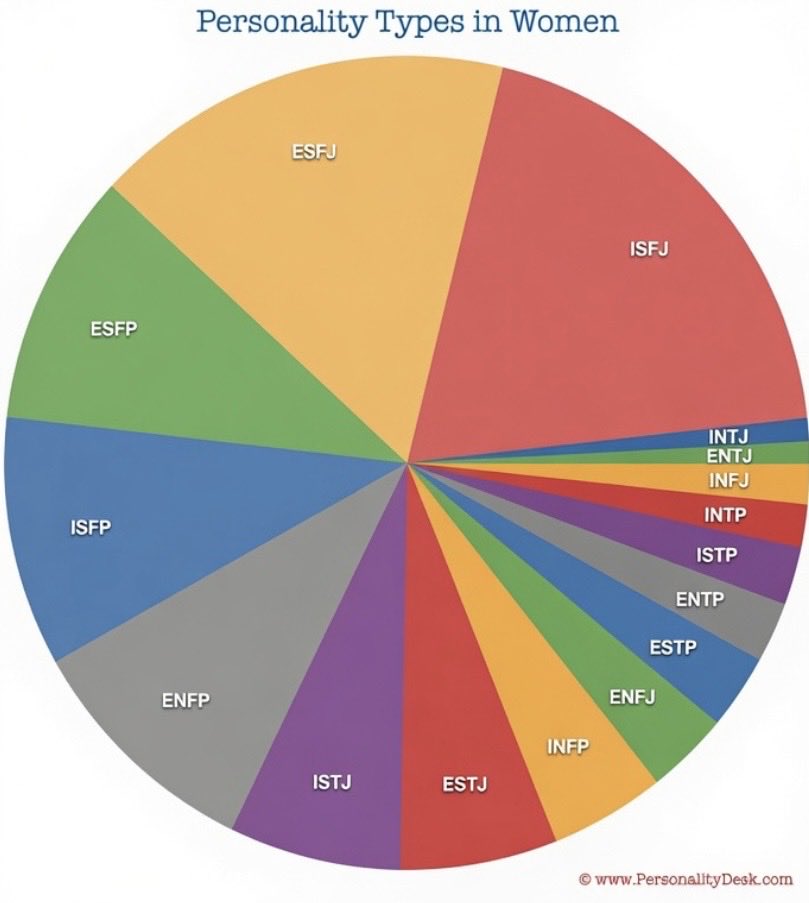
A lot of feeling and not much thinking in that chart.

1
1
116
Jun 1
Everybody makes fun of geeks, until they need one.

1
3
222
Jun 1
If your girlfriend doesn't complain you've never finished watching a movie together because every time you end up having sex, you're doing it wrong.


2
2
223
May 30
All her boyfriends have been "Chads" and she's 39, single, never married, no kids.
May 30

False, all my boyfriends have been Chads. There is no way for me to know whether I’m dating a Chad who is fucking around, lying, and wasting my time or a Chad who is taking me seriously when it is a masculine norm to deceive for casual sex without consent.
This is why norms need to change. If I’m looking for a serious relationship, I absolutely do not want to waste time on men who are not genuinely interested in the same with me.
62

May 26
Says the woman who's very specific type is 6'4" CEO company founders.
May 26
Men who believe this about women are sad and pathetic mids.
The fact is that a woman with 50 ng/dL who is simply getting orgasms every time will be hornier than virtually all men.
Men who are actually good in bed know how horny women can be.
1
2
66
Number Cruncher retweeted

May 26
Men who believe this about women are sad and pathetic mids.
The fact is that a woman with 50 ng/dL who is simply getting orgasms every time will be hornier than virtually all men.
Men who are actually good in bed know how horny women can be.
May 26

The reason women are so picky is that evolution and biology has made them as close to asexual as possible.
Women feel 0 attraction for most men not because most men are objectively ugly, but because the amount of estrogen they have makes their sex drive so low that it takes a lot for a guy to incite any feelings of attraction.
If they had even 1/10th of the testosterone men had, they would be horny animals and the average man would have no issues getting laid.
But the truth about women no one wants to admit is that they’re closer to asexual than they are to heterosexual. They basically have 0 sex drive unless it’s a very specific guy they REALLY find attractive.
Women who sleep around a lot do it as an act of leveraging their bodies to obtain some kind of outcome (resources, protection, etc) rather than because they enjoy the act of sex itself.
It is not in a woman’s nature to enjoy sex with many different men.
7
4
58
6,981
May 26
New Olympic Sport.
Drunk women playing soccer in heels.
1
50
May 24
Ladies,
Don't mess with our guns, guitars, computers or cars.
Gentlemen, what did I miss?
Comment below.
May 24


592
May 22
Christopher Nolan, here me out:

1
2
71
May 22
Ladies,
Don't fall for the psyop.
May 22

Alex Cooper spent her life building the #1 podcast for women, telling them to hookup, be whores, avoid commitment, be raunchy and mock men.
Her audience ate it up. Today she is married, pregnant and building a family.
Nobody lies to women more than other women.

61