
The Opportunity & Inclusive Growth Institute @MinneapolisFed supports research to expand economic opportunity and inclusive growth for all. RT≠endorsement
- Tweets 2,576
- Following 250
- Followers 2,066
- Likes 113


ALT Man looking at phone: “Did you receive a text message or email from the Federal Reserve claiming that there’s suspicious activity on your bank account?” Red background and Federal Reserve seal in upper right-hand corner

ALT The Federal Reserve does not contact consumers unsolicited. Scammers are working hard to steal your personal financial information.” Red background with Federal Reserve seal in upper right-hand corner.

ALT Copy in white circle: "For more information about how to protect you, your family, and friends, visit www.federalreserve.gov” Red background with Federal Reserve seal in upper right-hand corner

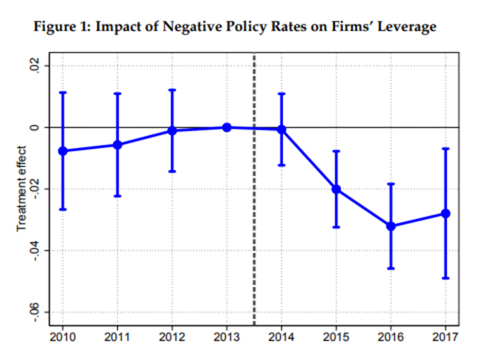
ALT A line graph titled "Impact of Negative Policy Rates on Firms' Leverage" displays data from 2010 to 2017. The x-axis represents years, and the y-axis represents the treatment effect, ranging from -0.06 to 0.02.
ALT This image shows a cover page for a working paper by the Opportunity & Inclusive Growth Institute of the Federal Reserve Bank of Minneapolis. The paper is titled "Credit Supply, Firms, and Earnings Inequality," authored by Christian Moser, Farzad Saidi, Benjamin Wirth, and Stefanie Wolter. The page features blue, white, and yellow colors.
ALT Cover of a working paper titled "The Long-Term Decline of the U.S. Job Ladder" by Niklas Engbom, Aniket Baksy, and Daniele Caratelli. It features the logo of the Opportunity & Inclusive Growth Institute at the Federal Reserve Bank of Minneapolis.
ALT Oksana Leukhina
ALT An illustration shows a person standing in front of a large, open blue door that is part of a bar graph. The bars are in green, red, blue, and pink, with the blue bar being the tallest and shaped like a door. The background is yellow, and there is an arrow at the bottom right indicating growth or progress.
ALT Kareem Haggag
ALT A stylized illustration of a diverse group of people in a workplace setting. Individuals are engaged in various activities such as working on laptops, writing, and discussing. One person is holding an infant. In the background, there are bookshelves, which suggest an office environment. The scene conveys a sense of collaboration and multitasking.
ALT Illustration of multiple people in an office setting. Scenes show individuals working at desks, discussing at a board, using laptops, and one person holding an infant. Shelves and a clock are visible in the background.
ALT An illustration depicting several people in an office setting. One person is seated at a desk with a laptop, another is presenting data on a chart, and two are engaged in conversation, one holding a baby. Bookshelves are in the background, and a clock indicates time.
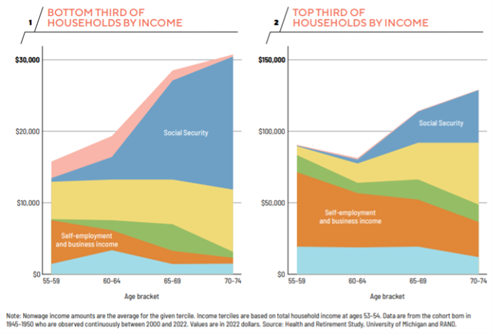
ALT A comparison graph split into two sections. The left graph shows income sources for the bottom third of households by income, with Social Security and self-employment as key contributors among other sources. The right graph displays the top third of households by income, highlighting Social Security and self-employment contributions. Both graphs cover age brackets from 55-59 to 70-74. Data from Health and Retirement Study, University of Michigan and RAND.
ALT Dan Hartley
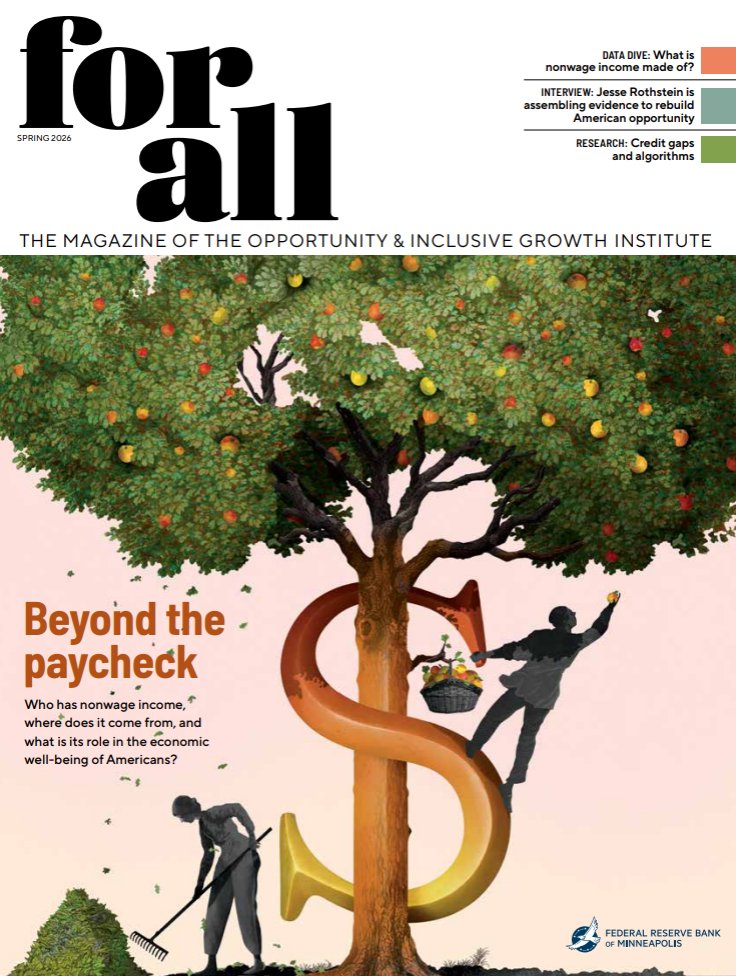
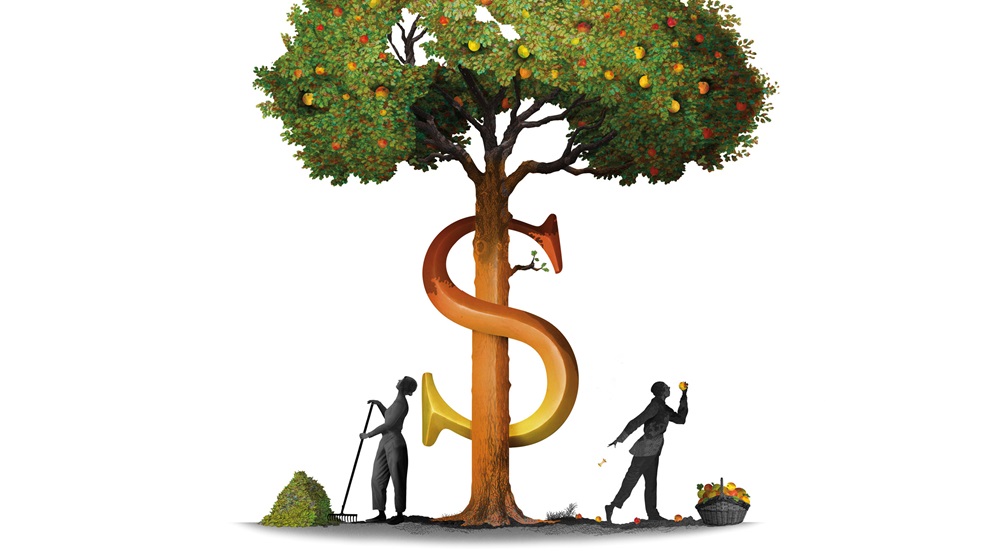
ALT Cover of "For All" magazine, Spring 2026 edition. It features a large tree growing out of a gold dollar sign. Two individuals are harvesting money from the tree using ladders. The headline reads "Beyond the Paycheck," with smaller text discussing income sources and economic well-being. The Federal Reserve Bank of Minneapolis logo appears at the bottom.

ALT Illustration of a person opening a large, blue door in a series of progressively taller colored doors, resembling a bar chart. The background is yellow.

ALT Cover of a working paper titled "The Long-Term Decline of the U.S. Job Ladder" by Niklas Engbom, Aniket Baksy, and Daniele Caratelli. It features the logo of the Opportunity & Inclusive Growth Institute at the Federal Reserve Bank of Minneapolis.