
Joined September 2010
- Tweets 1,851
- Following 551
- Followers 385
- Likes 1,771
148 Photos and videos


Pinned Tweet

19 Nov 2020
Just realized that an article I wrote is the number one search result for the phrase "how to receive an award." That's cool, but what's even better is that in this article, I discuss shitting my pants. #personalbrand
9
9 Dec 2022
Excited to see @growandconvert make this shift in our messaging. It's a better reflection of the value we've been bringing to clients for years (which always went way beyond content marketing).
9 Dec 2022

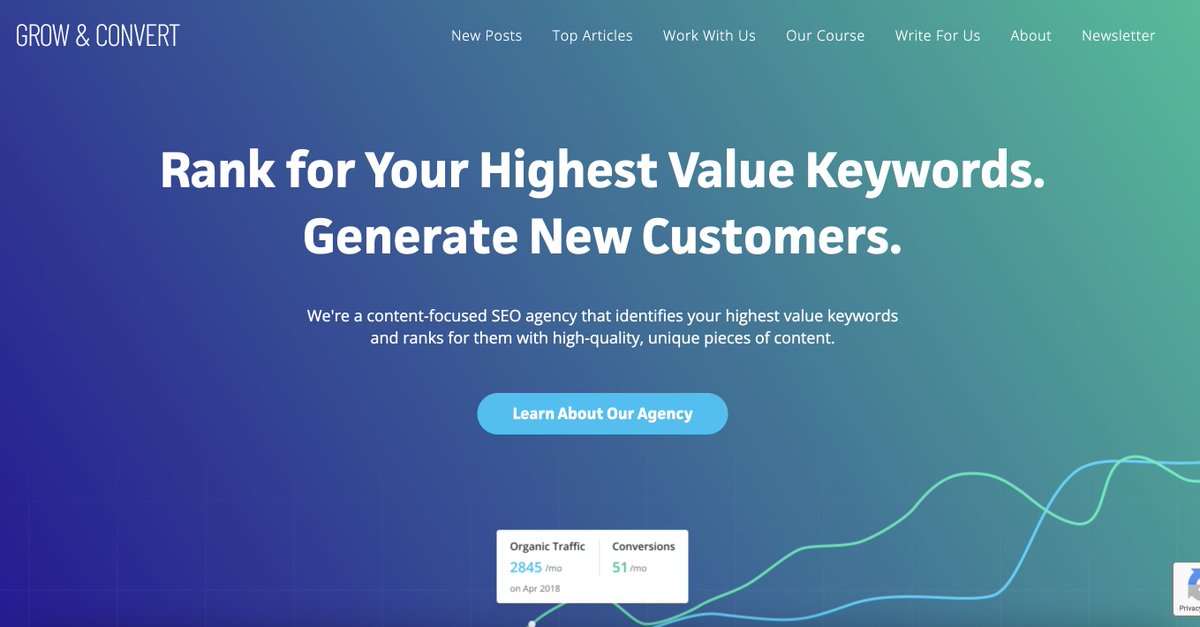
We have a new website headline/subhead for @growandconvert.
We feel like this headline better communicates the value that we deliver to our clients. Less about "blogging" and "content marketing" and more about delivering results through rankings and conversions.
2
29 Nov 2022
Urban Triage is an incredible organization doing amazing things in Madison & Dane County. Please consider joining me in donating to support the launch of a youth homeless shelter! donate-usa.keela.co/giving-t… via @keeladotco
1
1
14 Oct 2022
Update on life after adopting 2 kittens: Half as productive, half as stressed. 🤷♀️
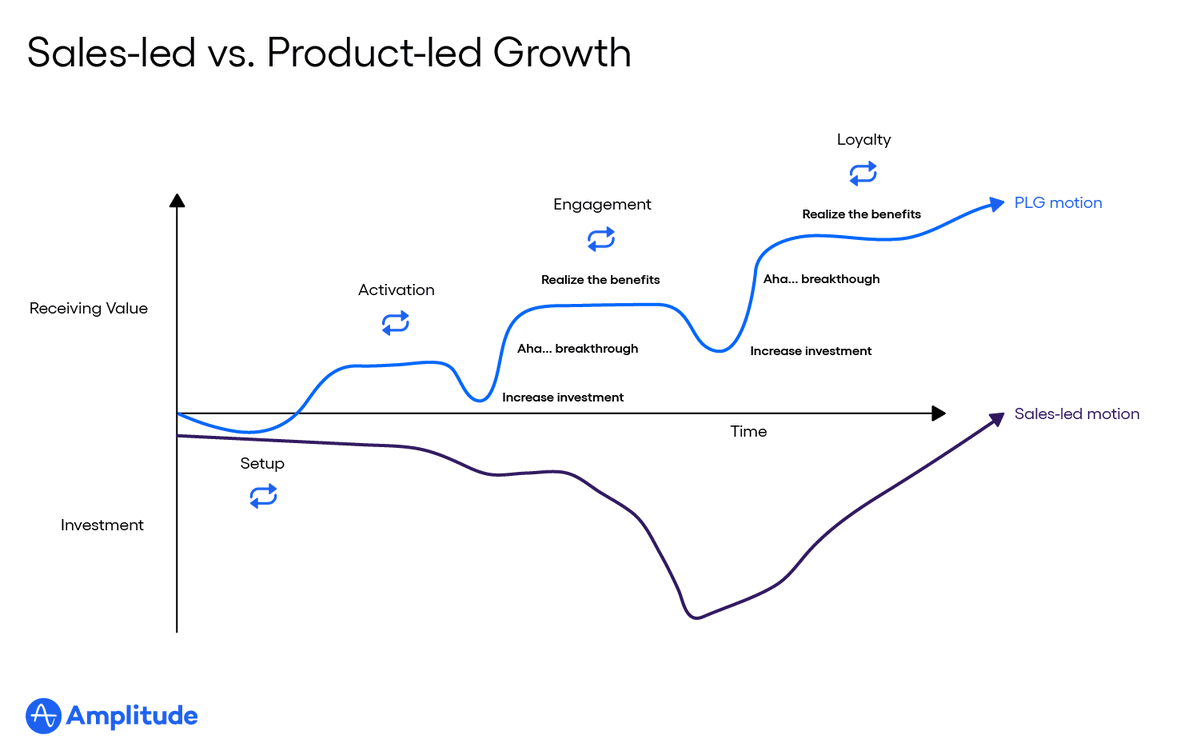
12 Oct 2022
I don't have a strong stats background but I did excel at algebra. Am I missing something or does this graph make no sense? Is this supposed to be half of a 4-quadrant matrix? or is the Y-axis "investment" below the intersection with the X-axis, but "receiving value" above?
27 Sep 2022
I think it would be incredibly satisfying to drive through an inactive interstate highway work zone (like on a Sunday) at 70 mph and just hit every single orange barrel for like a half mile.
8 Sep 2022
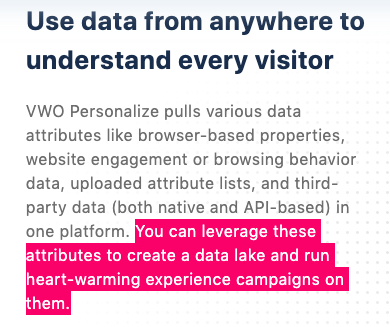
Can anyone tell me what the hell a "data lake" is and why it needs a "heart-warming experience" campaign? 😂
1
2 Sep 2022
Can anyone tell me why websites (amazon, random e-commerce sites, etc.) sometimes load in Spanish for me? No hablo ...
1
29 Aug 2022
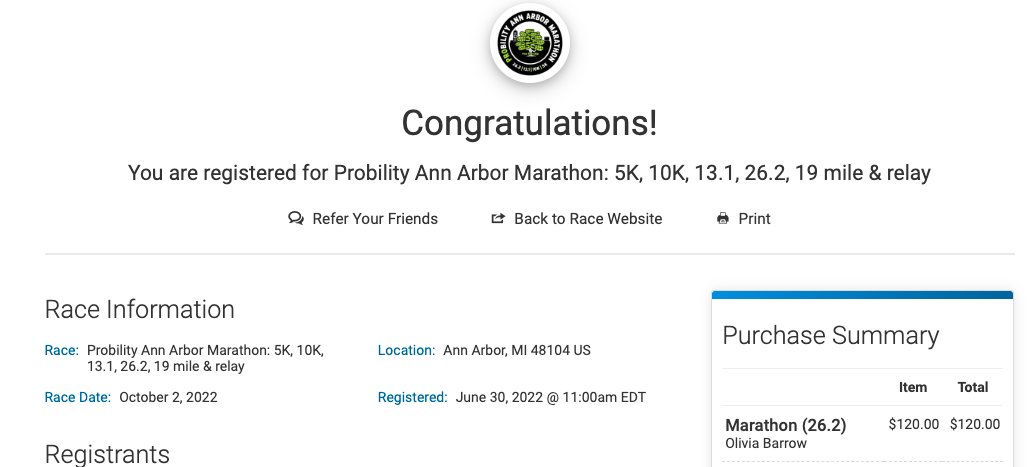
Had a breakthrough with marathon training this weekend. Found a fueling solution that seems to work with my gut.
The bad news: it involves drinking 400 calories of flavorless carbs before my long runs.
1
16 Aug 2022
In 12 months, I got a software testing tool’s blog to rank in the top 3 spots for 26 keywords with extremely high buying intent — and I’ve never written a line of code in my life. Here’s how I approach writing about topics I don't have expertise in.
growandconvert.com/content-m…
1
1
4 Aug 2022
Another great case study on content strategy from my teammates @growandconvert: growandconvert.com/content-m…
1
1
12 Jul 2022
Incessant jackhammering outside my downtown Madison office? Meet Noise Cancelling Headphones. 🙏
1
12 Jul 2022
But the dishes clanging against each other as someone empties the dishwasher? I hear every clang. 😒
30 Jun 2022
This was the best thing I've read in a month.
"If you can’t see the humanity in others it is very likely you are struggling to see it in yourself."
andreagibson.bulletin.com/th…
30 Jun 2022
"This is...what it means to be a Black woman who tries to do anything positive...I’m not marching. I’m not vandalizing anything. I’m not attacking anyone. I’m just trying to live my best life. And this is what we have to constantly face." madison365.com/is-black-art-…
29 Jun 2022
NPS is bullshit. I give Quickbooks Self Employed a 2 out of 10 every time they ask but I've been a customer for 6 years. I hate it but it sucks less than everything else.
1
Olivia Barrow retweeted

27 Jun 2022
I’m seeing a lot of posts saying people will die because Roe has been overturned. That is definitely true. But perhaps not for the reasons you think.
337
14,573
44,117
20 Jun 2022
My 5-year-old niece is in a big storytelling/acting phase, and every story/play starts with "One day a girl woke up..."
And as I'm working on my first novel I'm actively fighting the urge to begin every chapter with my characters waking up. 🤦♀️🤦♀️🤦♀️ #amwritingfiction
3
16 Jun 2022
The city had to remove the tree in front of our house after it got damaged in Monday's storm. I'm ... way more bummed about this than seems reasonable.
1
1