
Origin Reports helps journal office professionals create accurate, customizable charts, tables, and reports in minutes.📊
Joined March 2021
- Tweets 380
- Following 518
- Followers 87
- Likes 22
359 Photos and videos


31 May 2023
OriginReports.org makes building reports for editorial board meetings fast and easy, so you can get back to the things you love.
16
29 May 2023
Quickly create accurate editorial charts and tables using OriginReports.org so that you can spend more of your time analyzing the data and discovering journal trends.
1
17
26 May 2023
With OriginReports.org you can create visually pleasing and easy to interpret graphics that are specifically tailored to editorial office reporting.
9
24 May 2023
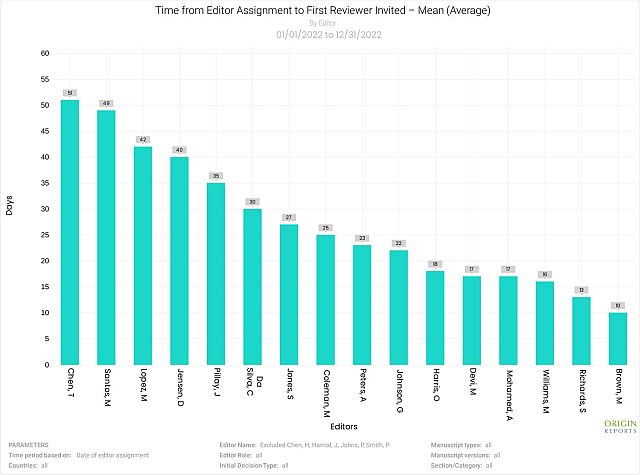
Need to compare how your editors are performing? OriginReports.org has the tools you need to make data driven decisions about your editorial staff.
9
22 May 2023
Use OriginReports.org to take a closer look at your data. Our easy to use menu allows you to create exactly the charts you need to answer the hard questions.
12
19 May 2023
Create editorial office specific graphics using OriginReports.org to help your team identify potential policy changes.
6
17 May 2023
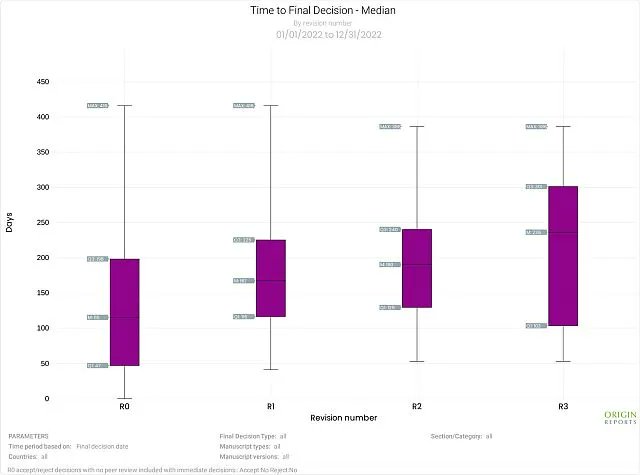
OriginReports.org is so easy to use, you'll be excited next time your Editor-In-Chief asks for data on peer review timing!
1
22
15 May 2023
Let us make you look like a superhero! Answer editorial questions in minutes using OriginReports.org expertly designed editorial charts and tables.
11
12 May 2023
With OriginReports.org you can dig deeper into your editor data to discover why some editors have slower times to initial decisions.
5
10 May 2023
Want to know how diverse your journal's authors are? Use OriginReports.org to break down your submissions by country or continent.
15
8 May 2023
Let Origin Reports help your team build your editorial board report in record time. Easy to use interface! Save all your custom charts for future use! OriginReports.org
1
27
5 May 2023
With OriginReports.org you can add labels to your charts to make them even easier to read and interpret.
4
3 May 2023
Make data driven decisions about your journal and editorial office using charts and tables from OriginReports.org
1
25
1 May 2023
Are you always on the go? With Origin Reports, you can create accurate editorial reports from where ever you are! OriginReports.org
13
28 Apr 2023
OriginReports.org makes it easy to save charts and update them as needed with our MyCharts page.
1
1
35
26 Apr 2023
Let Origin Reports help you dive into your journals data. Use our filters to create the custom charts to answer the exact questions you are asked. OriginReports.org

6
24 Apr 2023
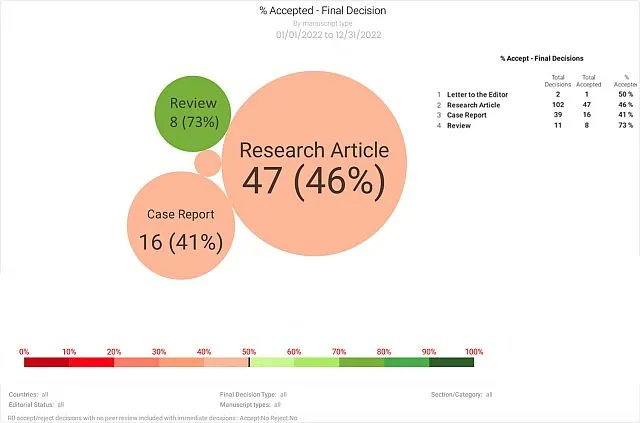
How did your journal's initial decisions break down last year? Use OriginReports.org to decide if your staff need to be more or less selective in the coming year.
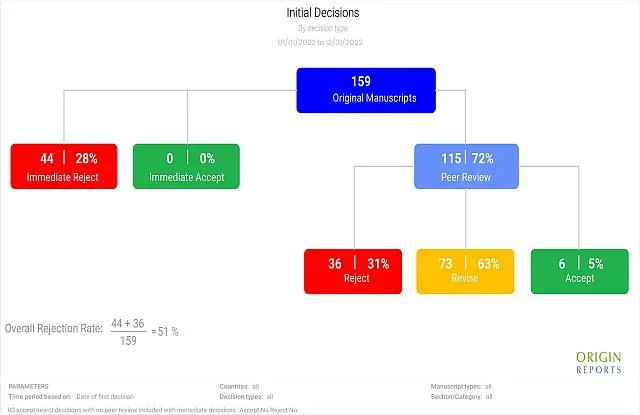
1
8
21 Apr 2023
Origin Reports helps you easily design your custom editorial board report. Save your Custom Report for even quicker reporting in the future! OriginReports.org

1
10
19 Apr 2023
Use OriginReports.org's Editor Performance Bubble Chart to gain a deeper understanding of how your editors are managing their workload.
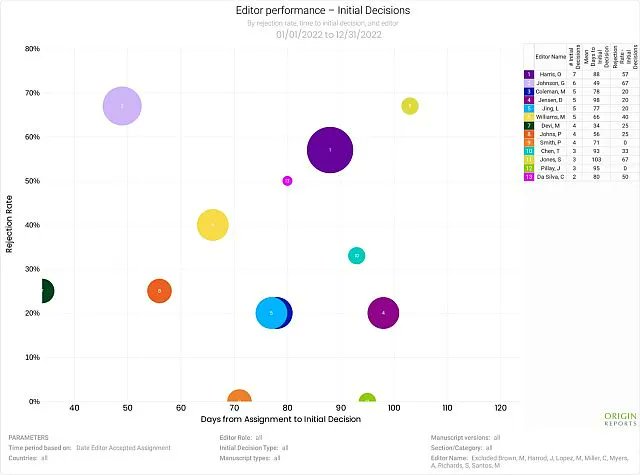
17