
Joined August 2021
- Tweets 59,185
- Following 5,161
- Followers 43,393
- Likes 91,686
8,941 Photos and videos

Pinned Tweet

19 Jan 2025
Its ok to be hated.
18 Jan 2025

"If evil people hate you, well, you might be doing something right"
Elon Musk
169
32
535
133,066
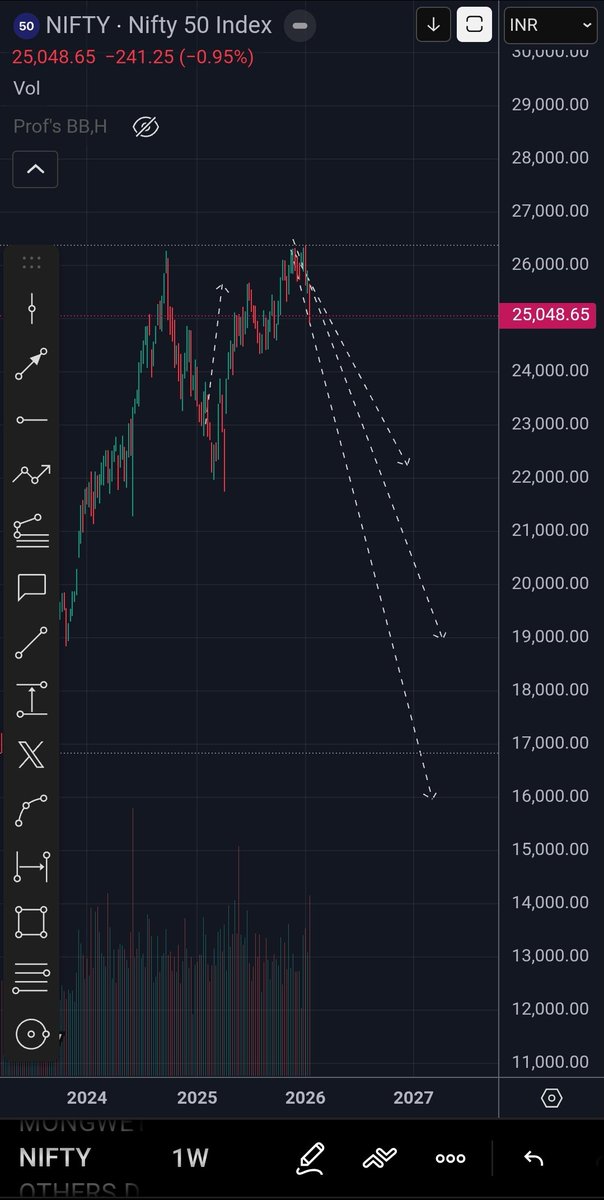
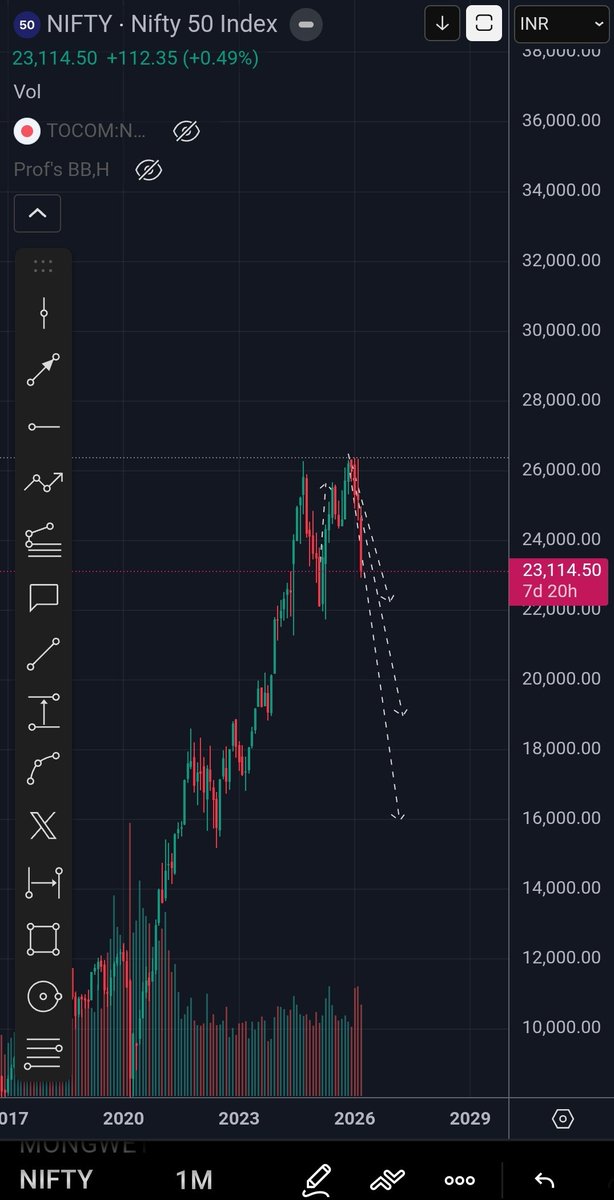
Mar 22
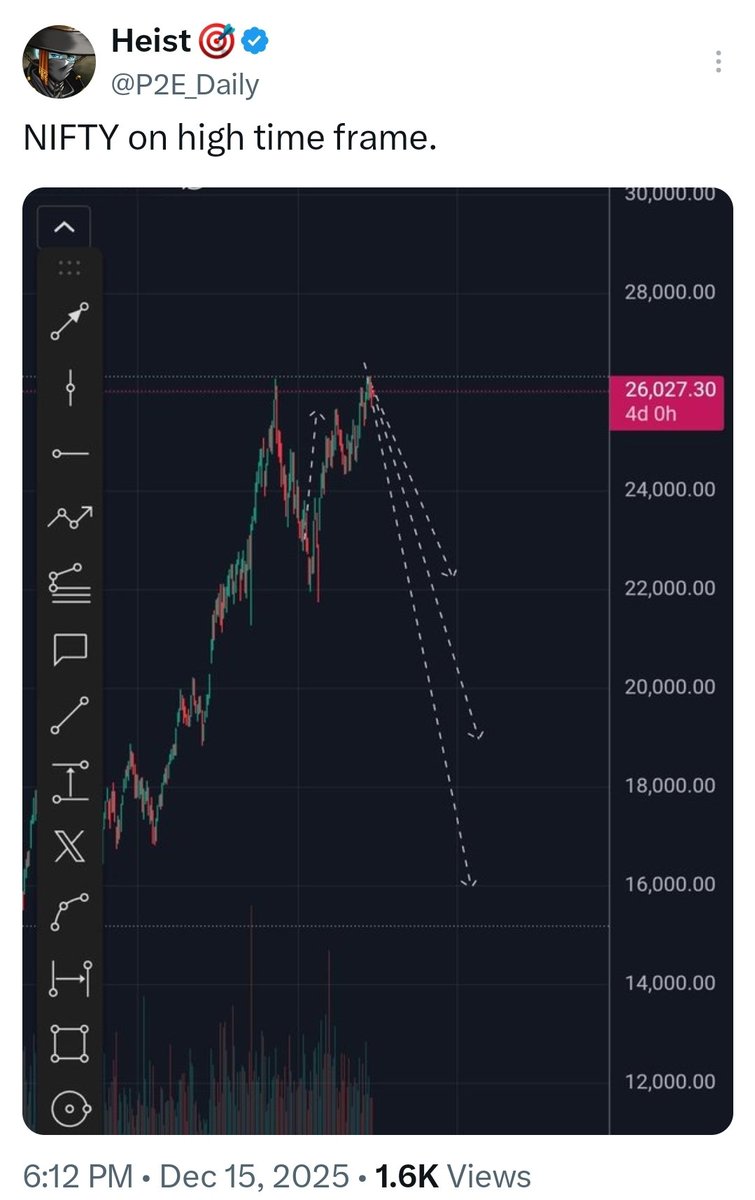
India stock index (NIFTY) crashes as predicted.

3
699
Feb 6
$XRP dips further
19 Dec 2025
XRP had the elements of a good transfer of value, not store value like bitcoin and litecoin.
Once touted to solve some elements that bitcoin cannot handle like micro transactions early on.
But it was the first crypto that had discretion to increase circulating supply and early supporters of crypto did not like this, kaya binansagan na scam nung 2017.
But due to this FUD, it created massive upside. 400X plus I think.
It also made huge run by 2021 which I predicted in Dec 2020, after this rally saka sila kinasuhan ng SEC when there were hovering as top 3 by market cap.
Being able to solve a high profile SEC case which set precedent to all other crypto cases shows it has a strong team that can hurdle anything.
Fundamentally it sounds good.
I'm a believer of LaW of Diminishing Returns.
When selecting for a good investment vehicle, I always look at the upside.
Lagi ko binabanggit ang room for growth as a preference over the established ones.
"The future value of every investment is a function of its present price. The higher the price you pay, the lower the return will be."
A good investment for me is like $XRP in Dec 2016, or $XRP Dec 2020 not in its current price.
Long term chart, down side momentum is showing good signs some bulls aren't giving up but not enough criteria for me to be excited to look or wait for a potential entry point.
Last time I mentioned XRP, I was telling people it rallied strong already and it was on a price level were risk is too high. Did not recommend and entry
Down side targets for XRP has not been reached. T1 and T2 of current move has not been reached although bull are stepping up to absorb the dip.
For me to consider it as a good long term investment it has to reach T2 before scaling in.
I think you have the tools to find this potential entry.
If you keep learning, you'll be awesome in the next 10 years.
1
2
868
Feb 6
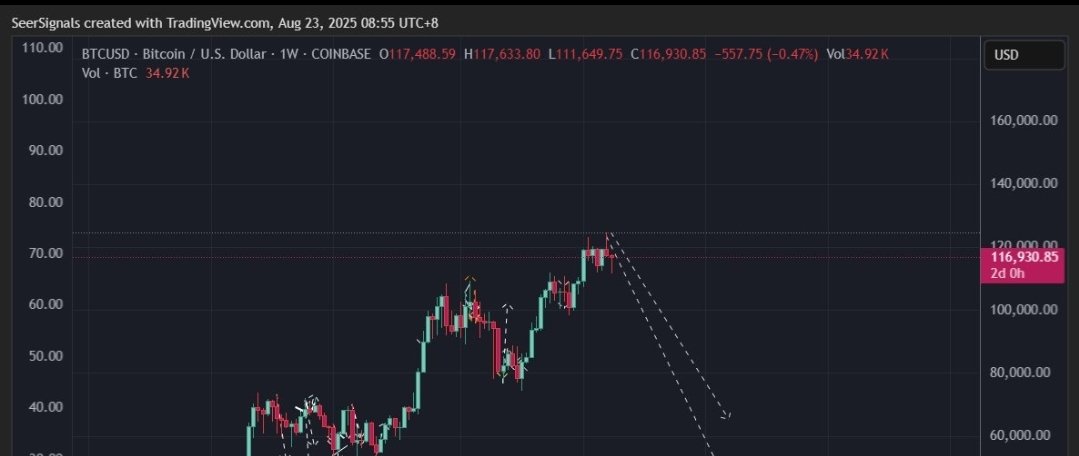
Bitcoin dipped to our bearish T2 target in our AUG 2025 analysis.
We did not know about the ongoing FUD at the time of our analysis, in fact,
sentiment was very bullish at the time of the analysis.
We just felt it was about to turn.
TA stuff!


2
5
1,172
Jan 30
Everyone starting to tweet Bitcoin heading 40K levels.
Interesting.
Jan 29

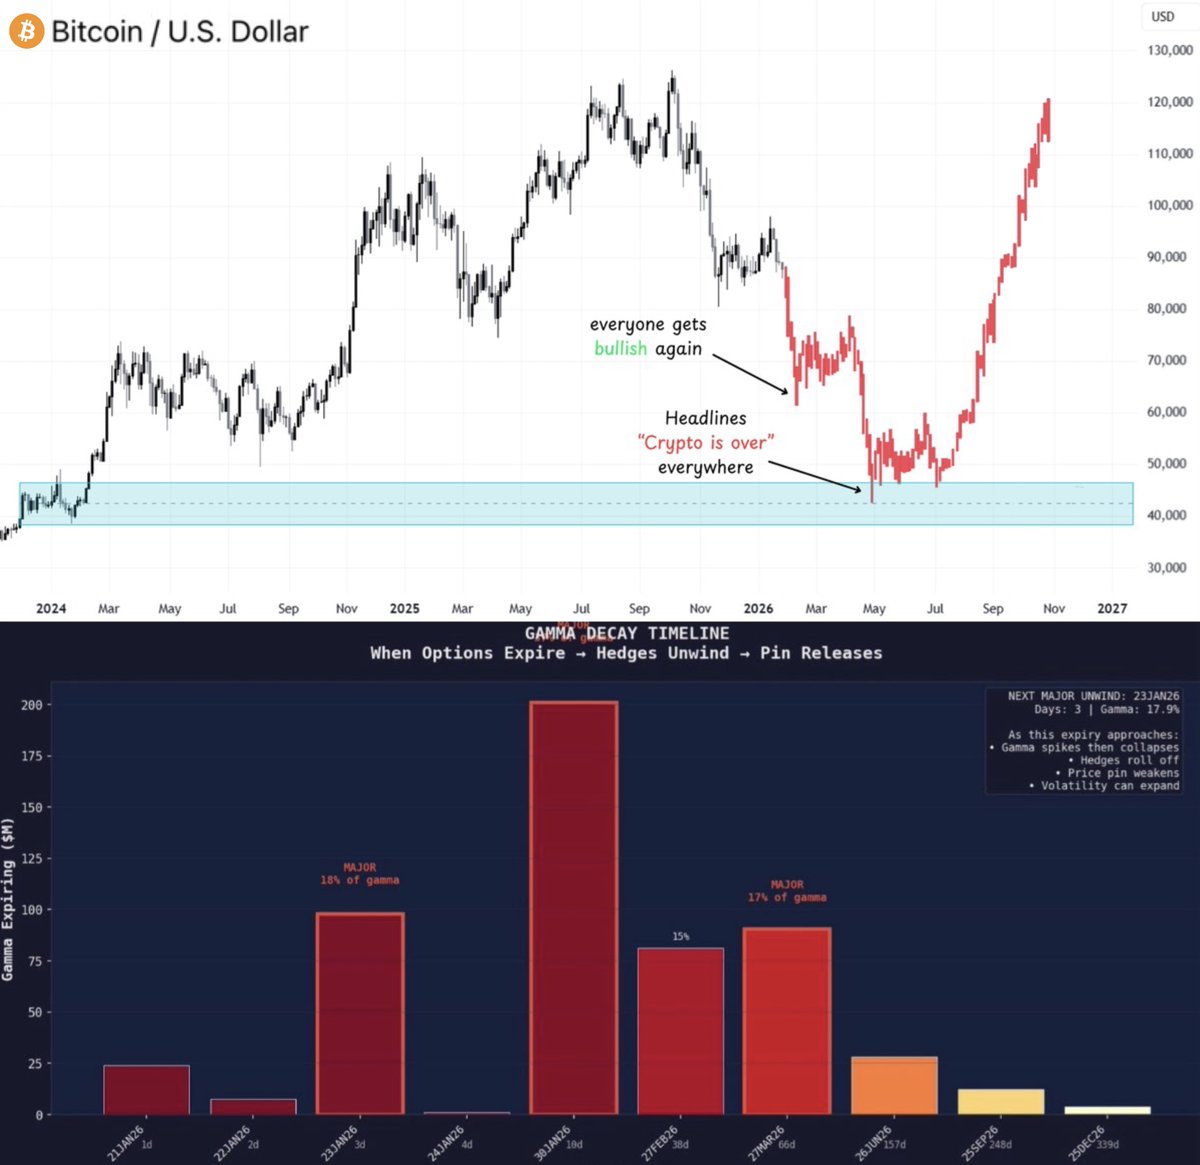
🚨 ALERT: THIS IS NOT A CLICKBAIT.
But this is how $BTC will play out in 2026.
I have the data right here.
And the magnetic pull holding us back expires in only 4 days.
Here’s what’s about to happen:
Bitcoin is currently caught in a massive options web.
Look at the chart below, the concentration for JANUARY 30 is nearly double anything else…
Market makers are currently in a "Long Gamma" position in this range.
– As price rips: They’re forced to sell to stay hedged.
– As price dips: They’re forced to buy to stay hedged.
It’s the reason why every pump gets immediately rejected and every dump gets bought up instantly.
It’s not weak buyers, it’s forced dealer activity.
The chart shows a massive MAJOR UNWIND on January 30.
As we approach this date, the "Price Pin" starts to vanish.
Once these options expire, the hedges are gone, and the mechanical selling that’s been suppressing our rallies DISAPPEARS.
We go from a pinned market to a released market.
When that much gamma leaves the system at once, the move is usually fast and violent…
I’ll share an update here in 4 days.
I’ve studied macro for 10 years and I called almost every major market top, including the October BTC ATH.
Follow and turn notifications on. I’ll post the warning BEFORE it hits the headlines.
1
3
1,085
Jan 25
Note to The Herd:
Significance of RSI level 50 in gauging a trend.
Above 50= Bull
Below 50= Bear
Bitcoin weekly TF RSI is currently below 50.
It went above this level
September 2023, the initial breakout from reaccumulation and since then held the level for a 2 year bull run until 2025.
Interestingly it now hovers below 50 which broke during the redistribution which we have observed.
How long will Bitcoin Weekly RSI remain below 50?
1
844
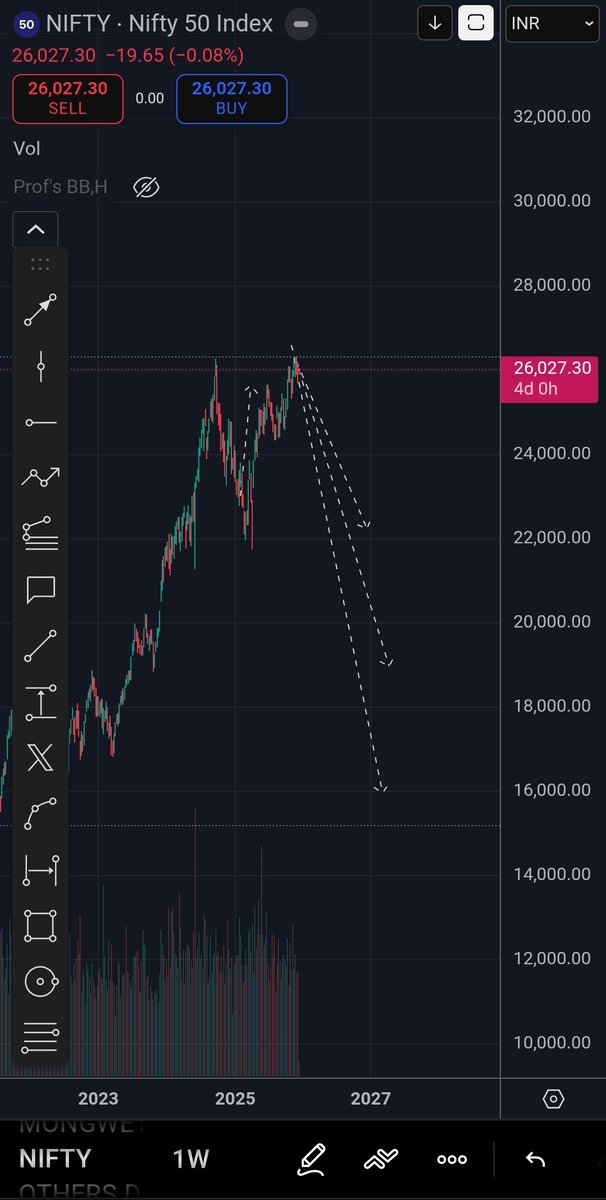
Jan 24
NIFTY starts to dip as predicted.
1
832
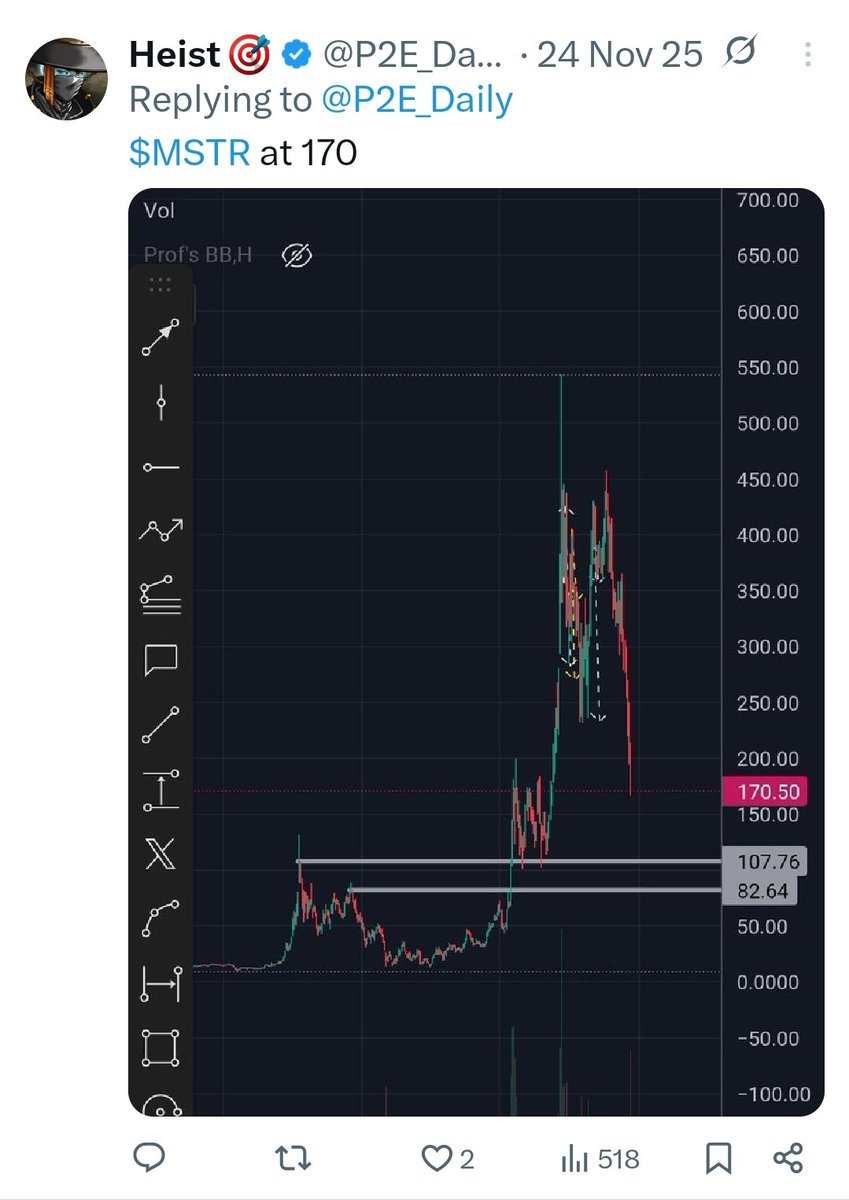
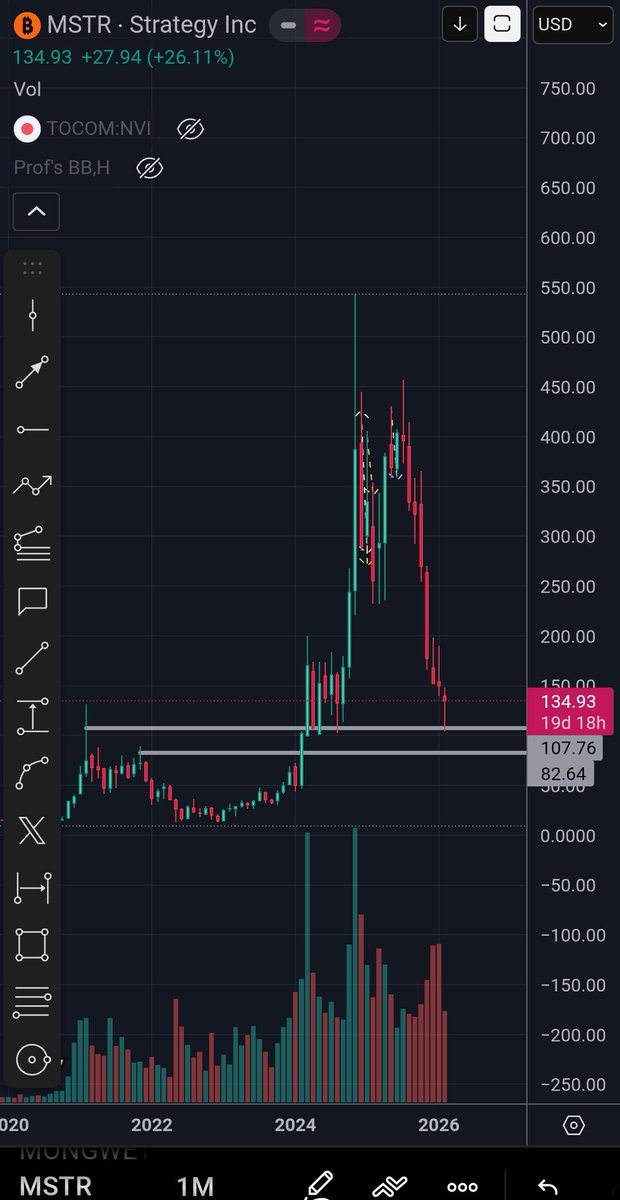
19 Dec 2025
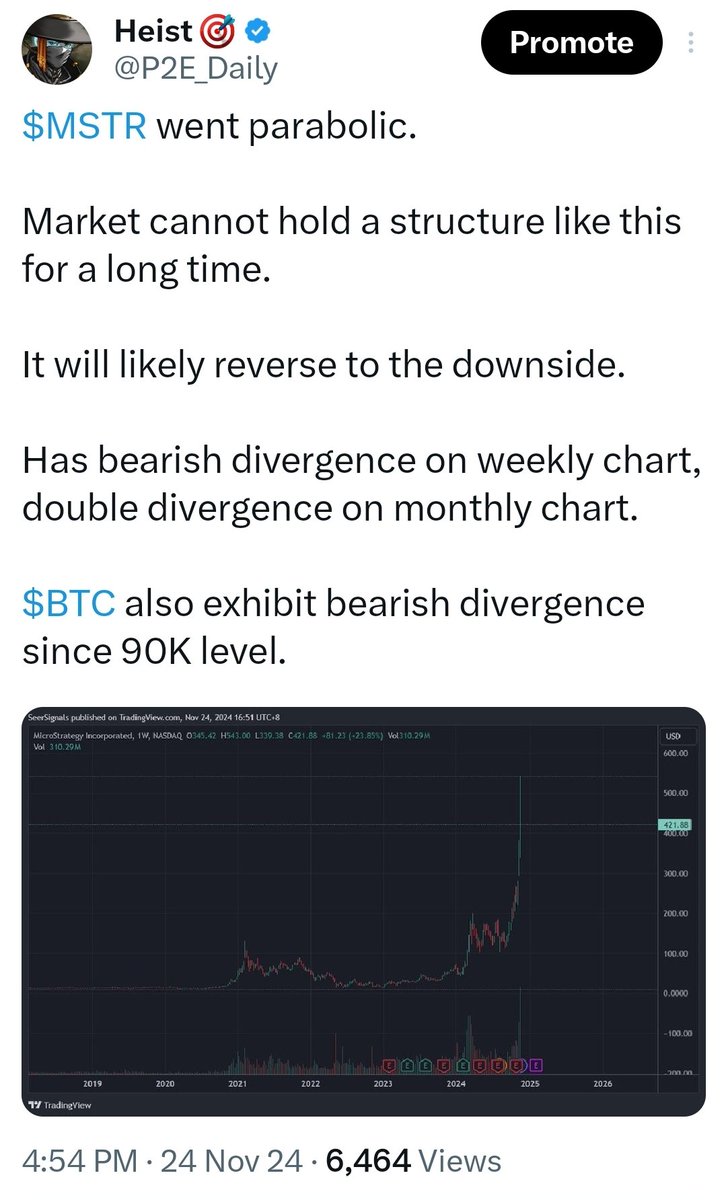
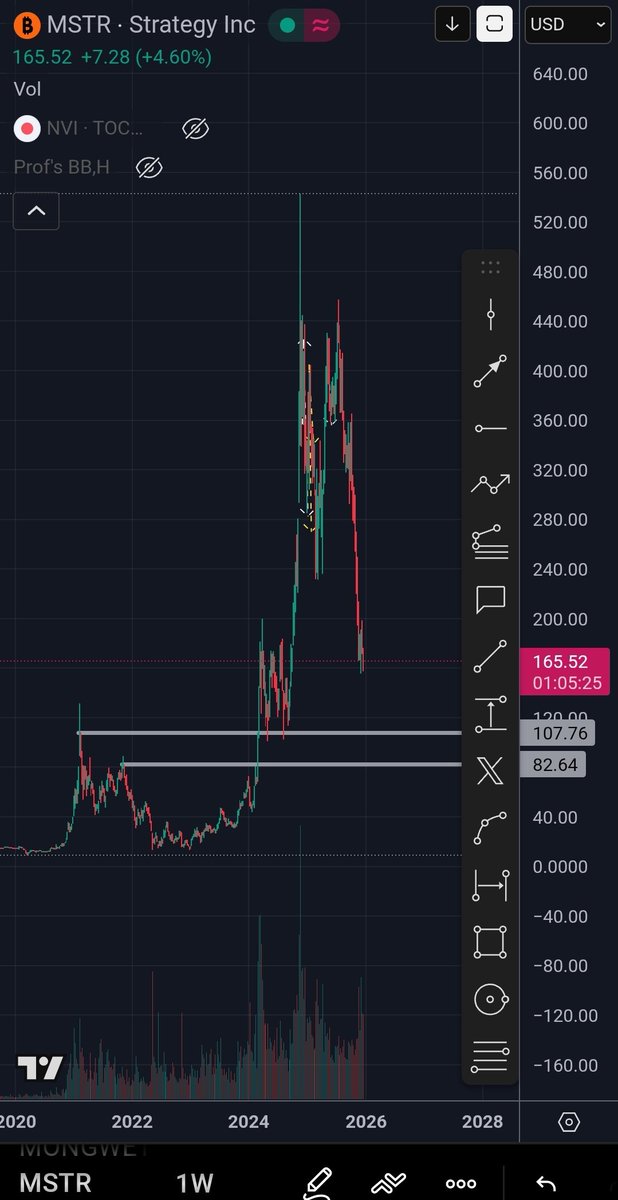
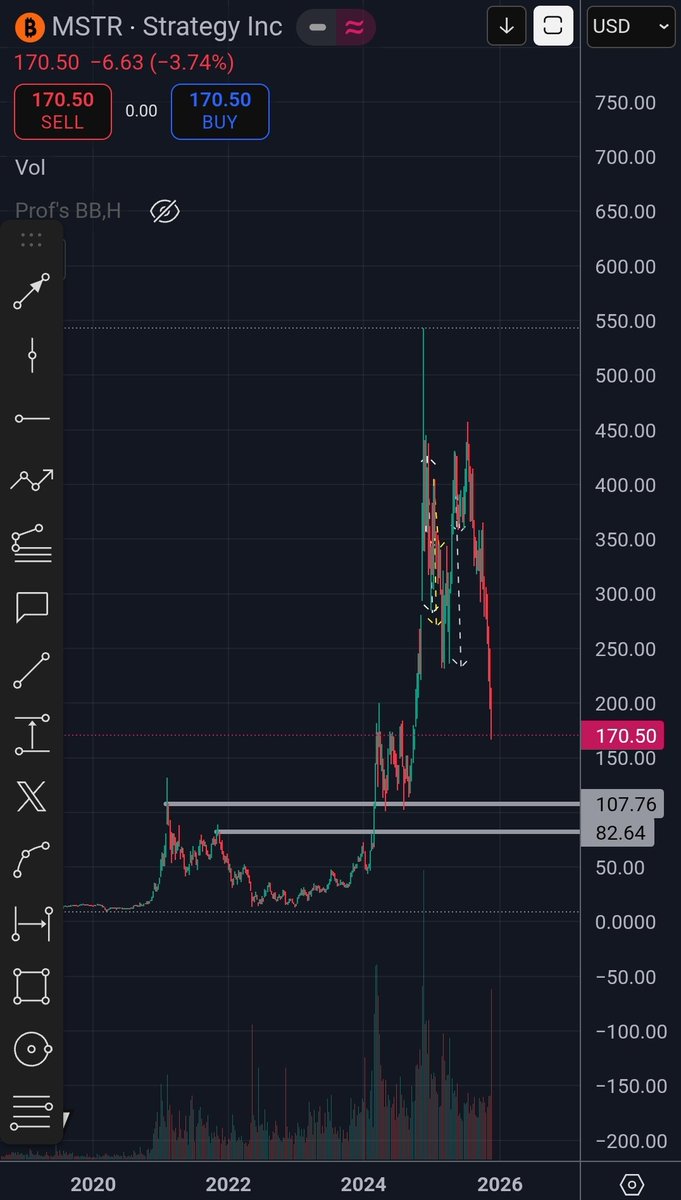
$MSTR which fueled most recent Bitcoin rallies is down 68% from its peak.
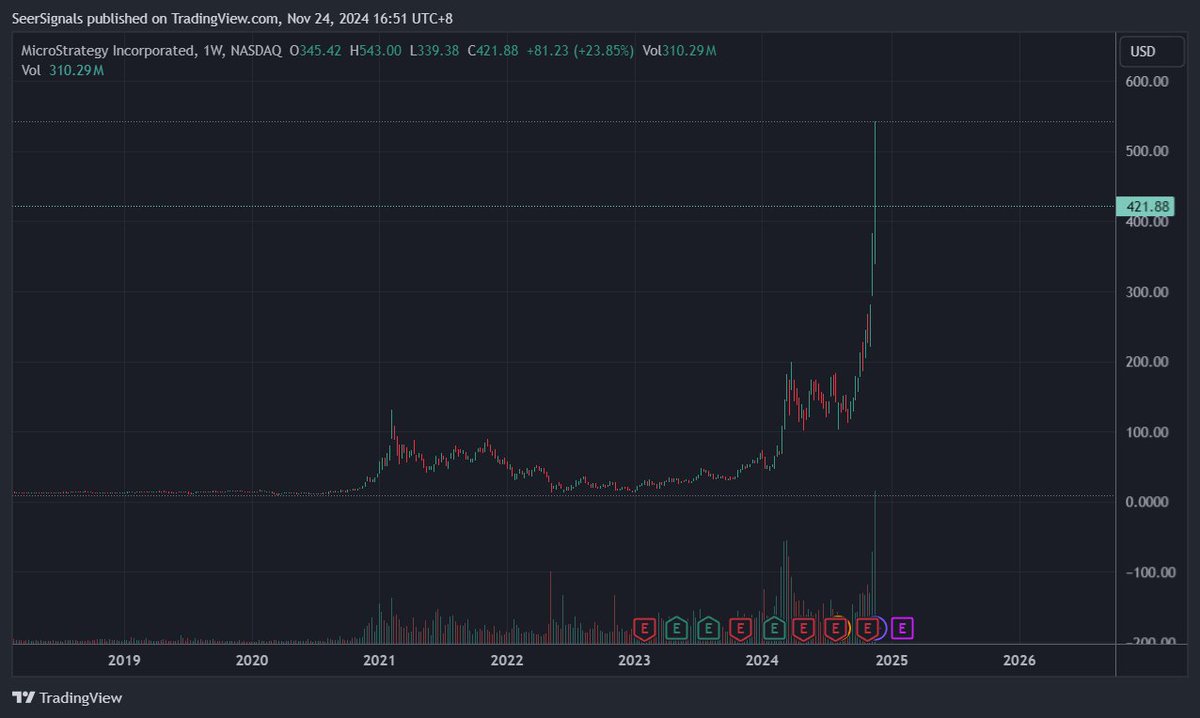
24 Nov 2024
$MSTR went parabolic.
Market cannot hold a structure like this for a long time.
It will likely reverse to the downside.
Has bearish divergence on weekly chart, double divergence on monthly chart.
$BTC also exhibit bearish divergence since 90K level.
4
1,763
18 Dec 2025
In 2008 US financial crisis, real estate imploded first before risk assets.
The crisis originated from the bursting of the housing bubble in 2006–2007, which later spilled over into stocks and the global economy.
S&P 500 and Dow Jones peaked much later on October 9, 2007, and began a gradual decline from there leading to the economic collapse of 2008.
In the next downturn of US economy, which will collapse first?
2
3
994
16 Dec 2025
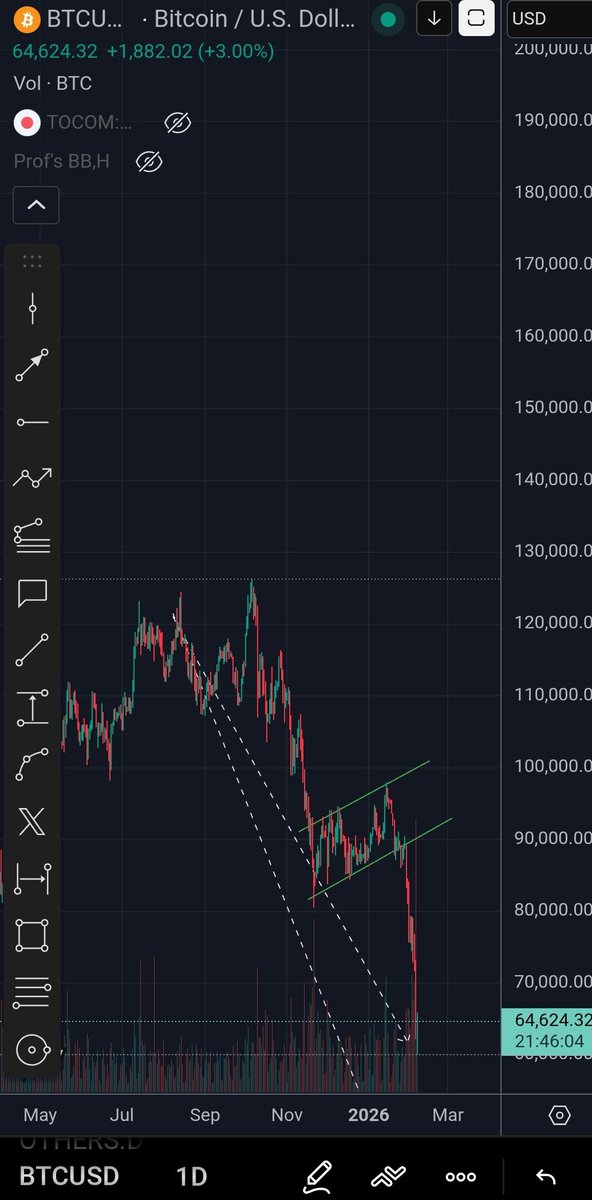
Bitcoin breaks redistribution channel as predicted.
Let's see if it reaches downside projections.
15 Dec 2025
Bitcoin re-distribution channel is completed.
Currently at channel support.
Break to the downside is likely based on the structure.
3
3
1,197
15 Dec 2025
Bitcoin re-distribution channel is completed.
Currently at channel support.
Break to the downside is likely based on the structure.
11 Dec 2025
Bitcoin dipped as we have predicted in August.
It's currently forming a redistribution channel.
Gold is exhibiting similar structure as $MSTR did in November 2024.
It's a very familiar pattern for those who understand cycles.
2
6
2,288
11 Dec 2025
Bitcoin dipped as we have predicted in August.
It's currently forming a redistribution channel.
Gold is exhibiting similar structure as $MSTR did in November 2024.
It's a very familiar pattern for those who understand cycles.
3
4
2,090
3 Aug 2025
Dips as predicted.
20 Jun 2025
One of the major banks in the 🇵🇭
is short term bullish and long term bearish.
Will not disclose which one as the analysis may trigger an unintended consequence.
Its nothing serious, just a normal up and down cycle of any publicly traded entity.
Interestingly, its exact top coincided with the date when we accurately predicted the exact May 2025 local peak for altcoins.
This is one of the reasons why we started paying more attention to macro and some useful stocks and indexes that can be used to analyze the broader market.
We knew at some point crypto will eventually become more in-tuned with Trad-Fi cycles.
Said bank is slated to bounce in the next few days or weeks but will eventually dip after a failure swing high.
Will show the charts if it pans out.
2
11
2,544
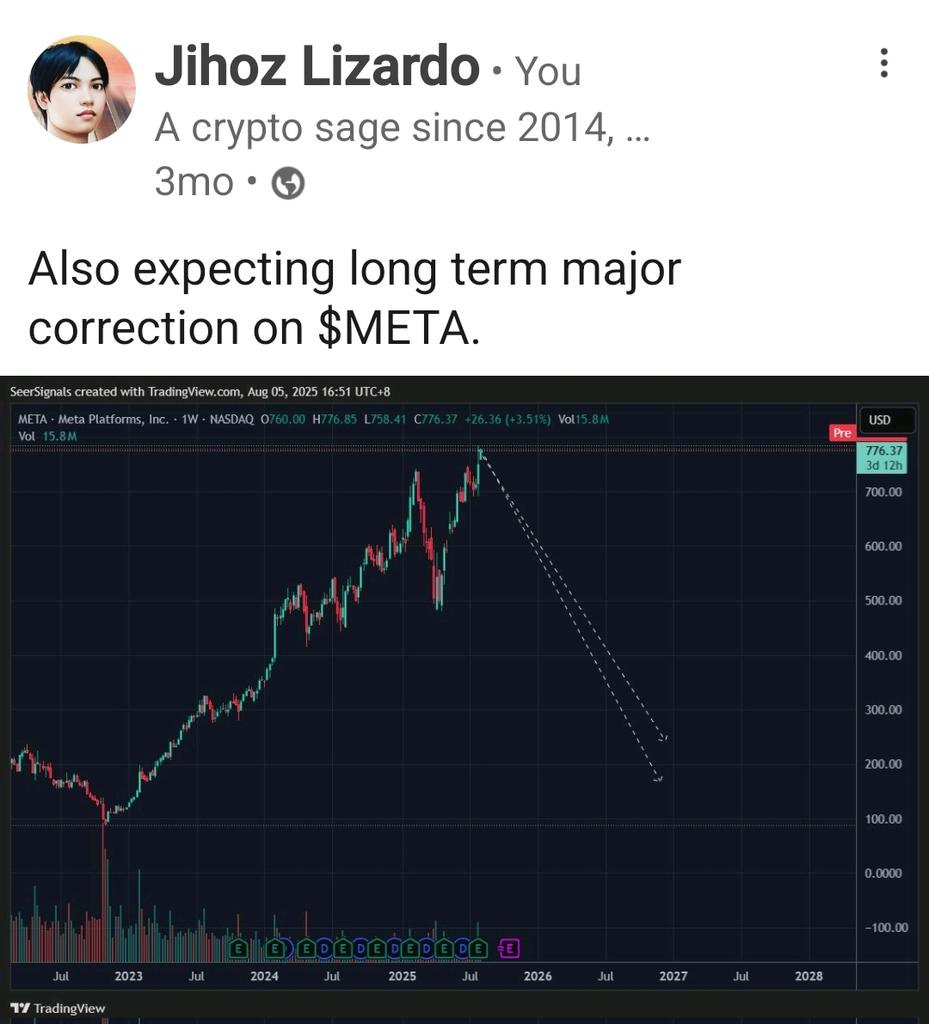
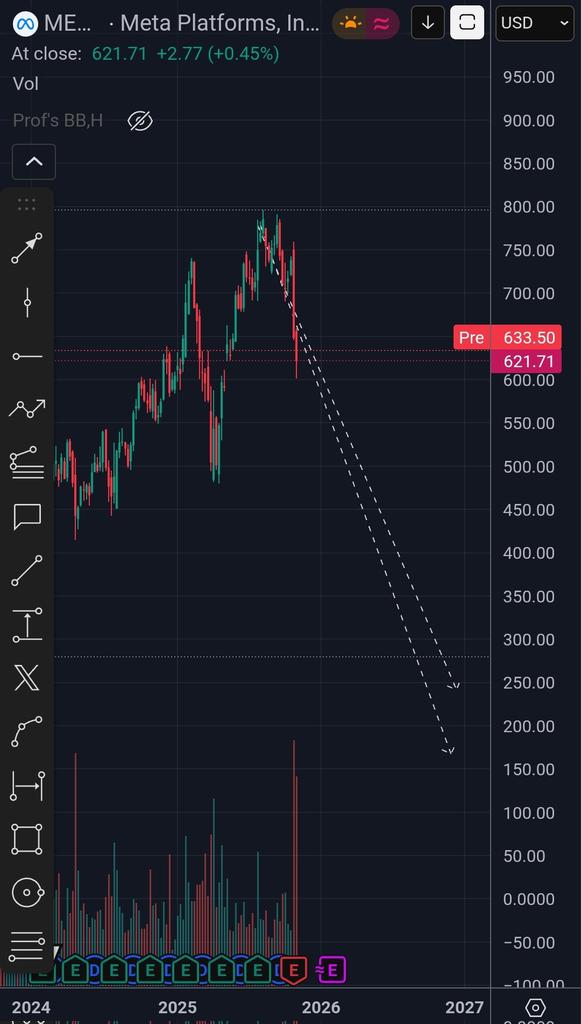
10 Nov 2025
3months ago we predicted Bitcoin price will continue to crash along with $META.
At the time, Meta was hovering at 776 USD.
Just recently, META crashed to 600 USD, closing price is at 621 USD.
The legend lives on!
1
1
1,288
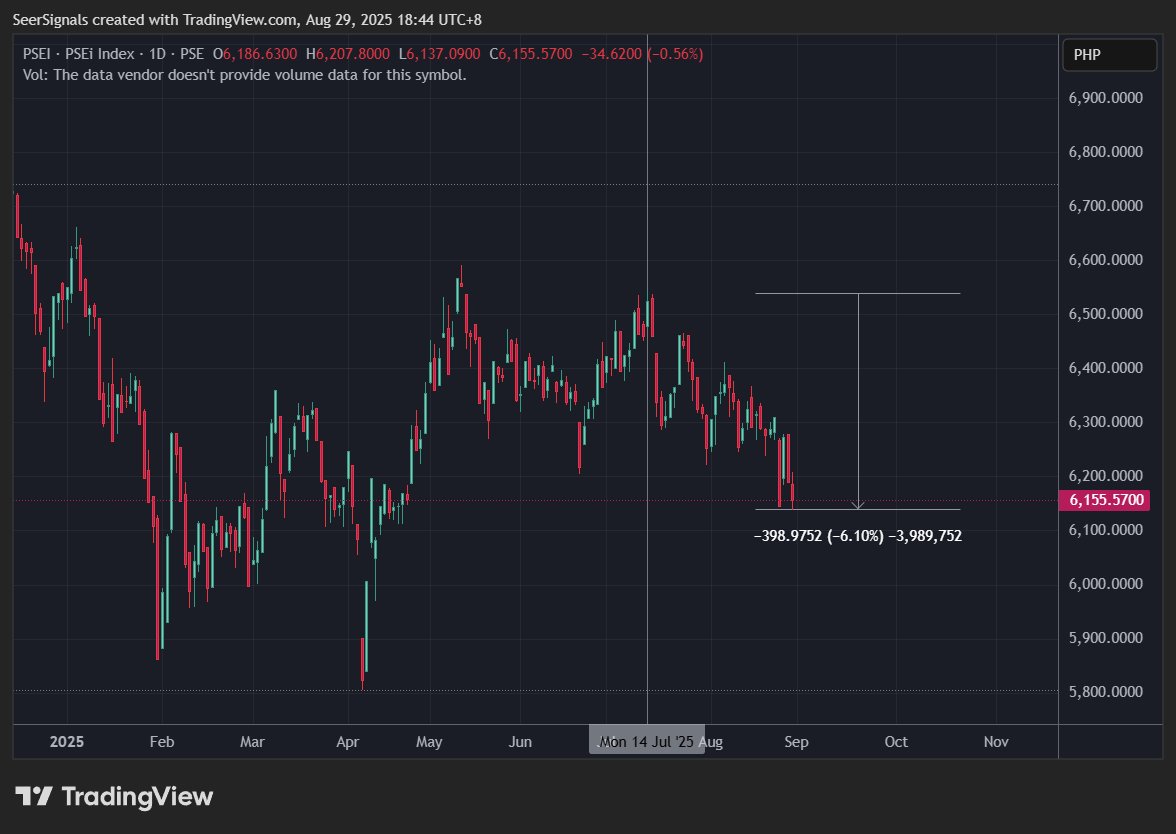
29 Aug 2025
🇵🇭$PSEI down 6% since our July 14 analysis.
14 Jul 2025
🇵🇭$PSEI will likely fall by 4-7% next few weeks to months.
6
4,072