
Project Management SOCIETY for Project Managers | Please ReTweet this at: twitter.com/PRINCE2PROJECT/s…
Joined September 2011
- Tweets 402,810
- Following 288,982
- Followers 292,110
- Likes 7,385
39,918 Photos and videos


Project Management retweeted
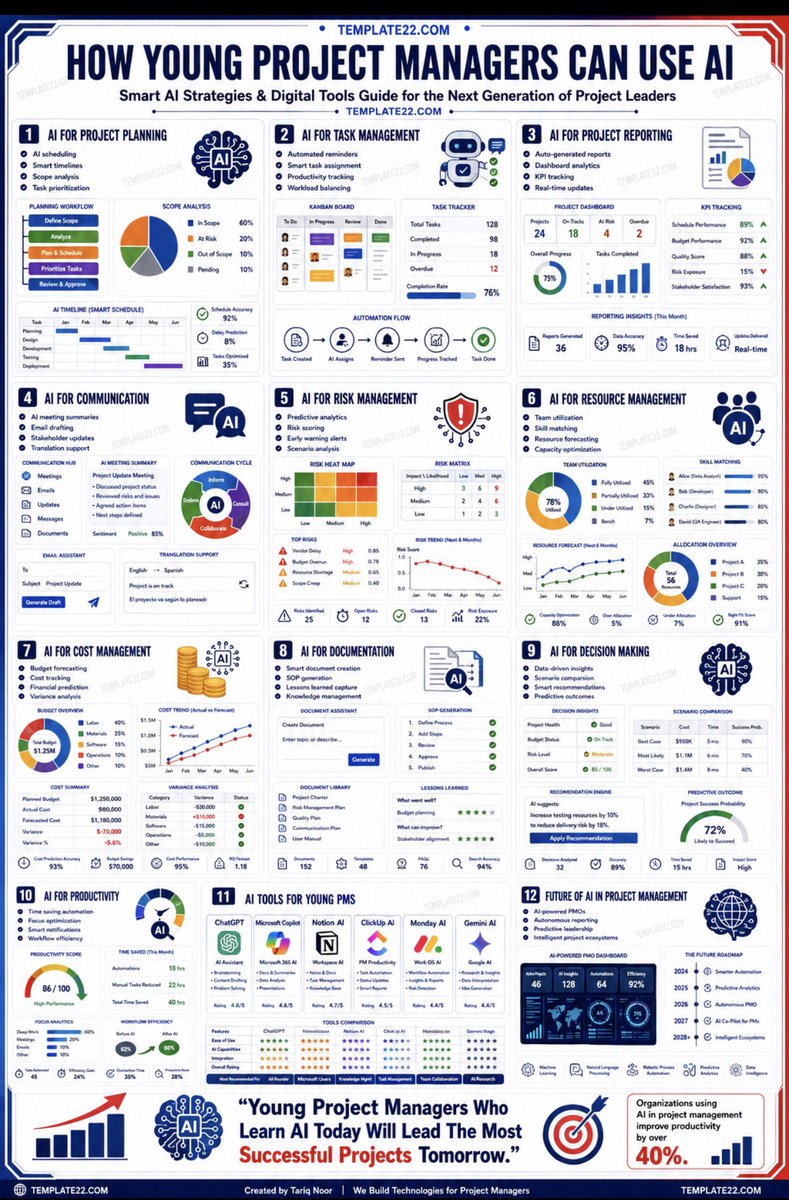
A MUST-READ book: AI-Powered Project Management at: lnkd.in/d5Ci_ppu
1
2
356
Project Management retweeted
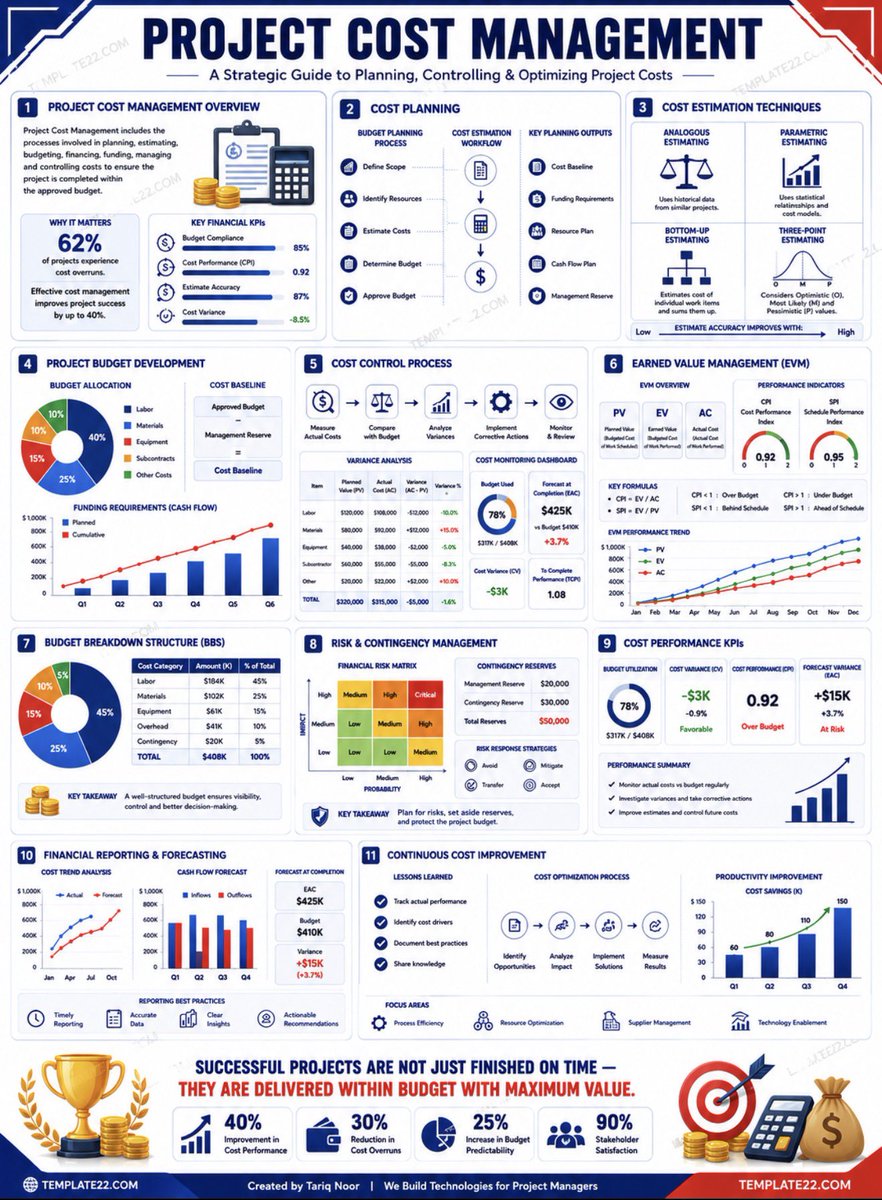
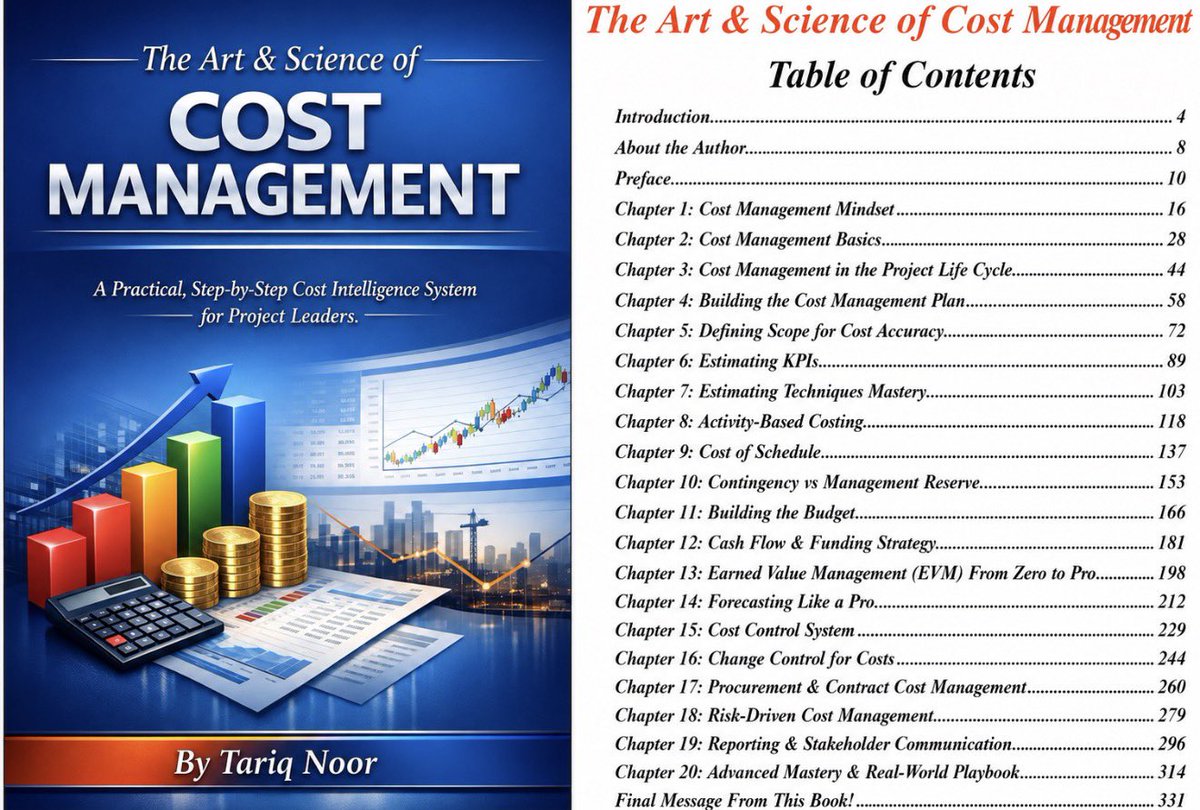
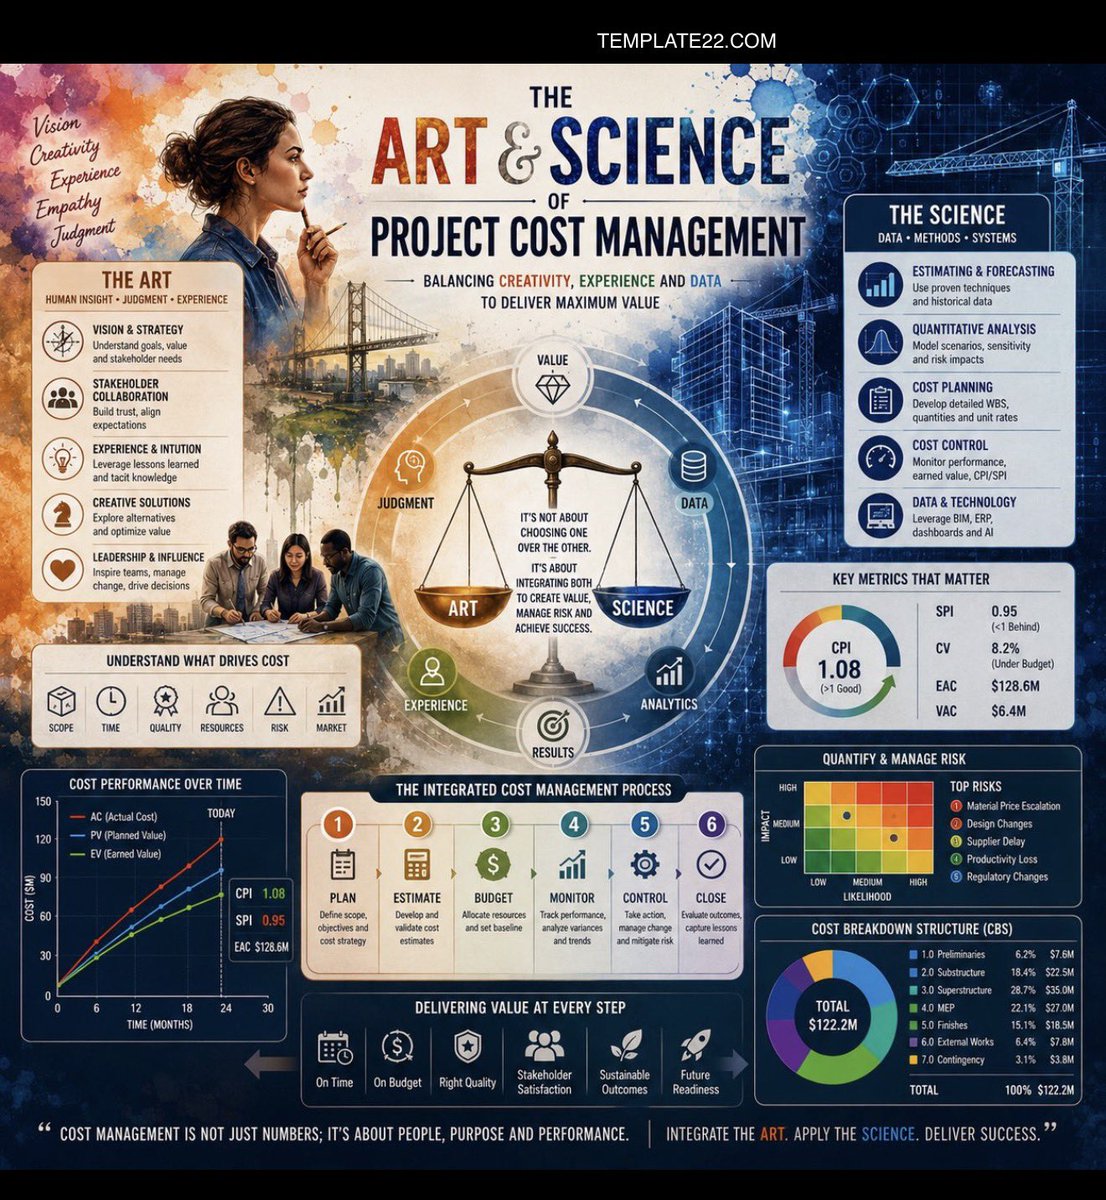
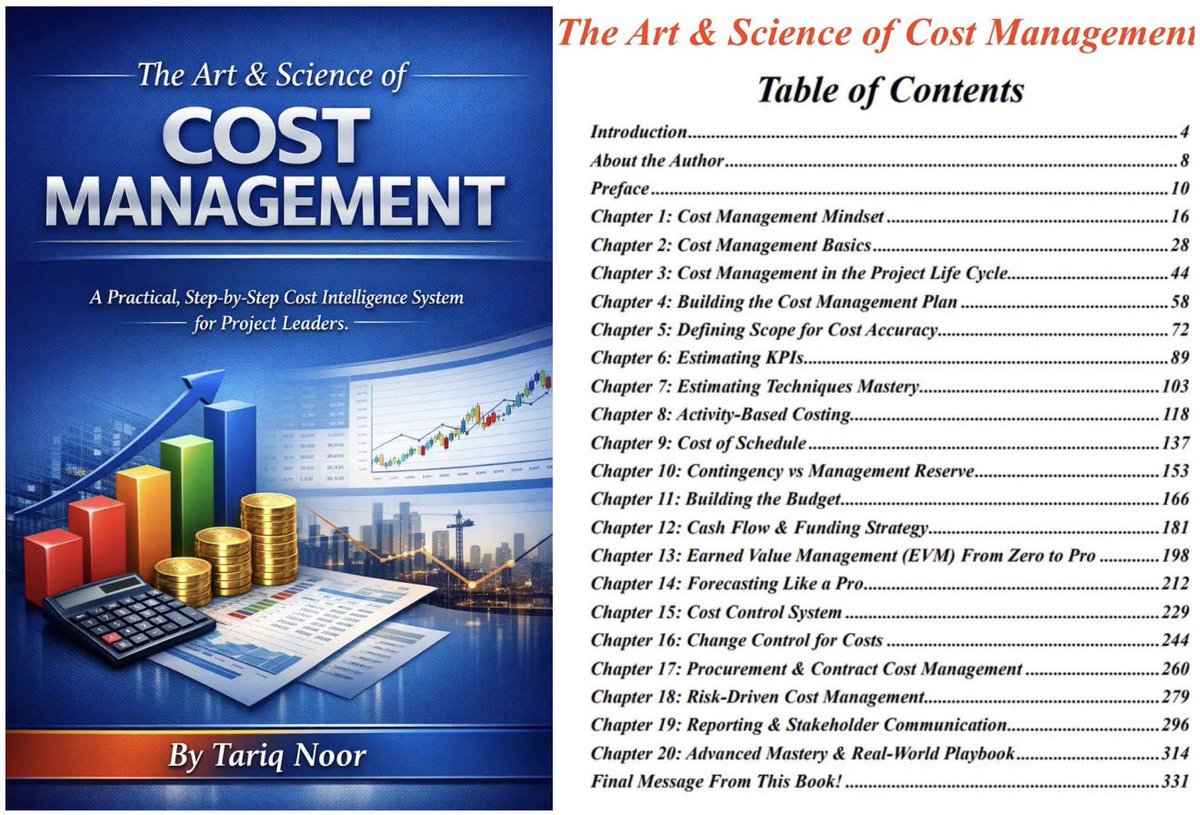
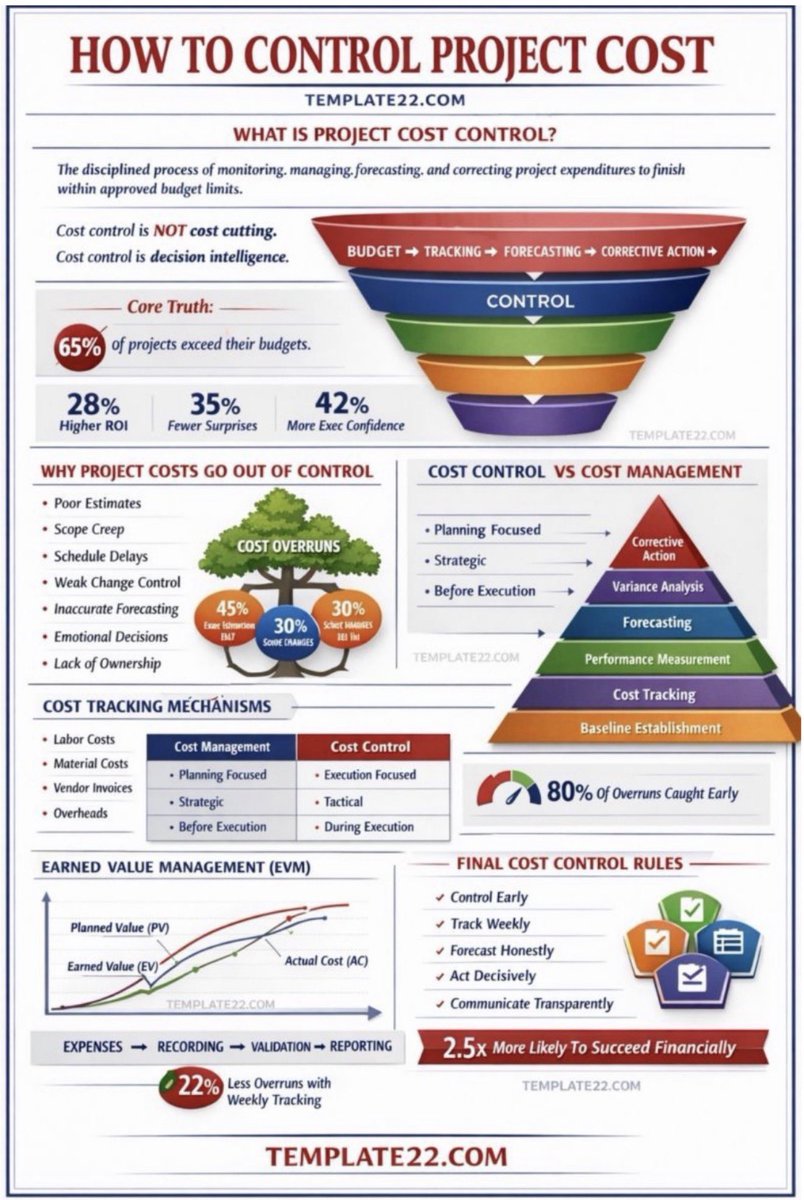
A MUST-READ book on Project Cost Management: The Art & Science of Cost Management : lnkd.in/dWDjt-PR
1
6
1,082
Project Management retweeted
A MUST-READ book on Project Cost Management: The Art & Science of Cost Management : lnkd.in/dWDjt-PR
1
2
583
Project Management retweeted
A MUST-READ book on Project Cost Management: The Art & Science of Cost Management : lnkd.in/dWDjt-PR
1
1
404
Project Management retweeted
A MUST-READ book on Project Cost Management: The Art & Science of Cost Management : lnkd.in/dWDjt-PR
1
2
414
Project Management retweeted
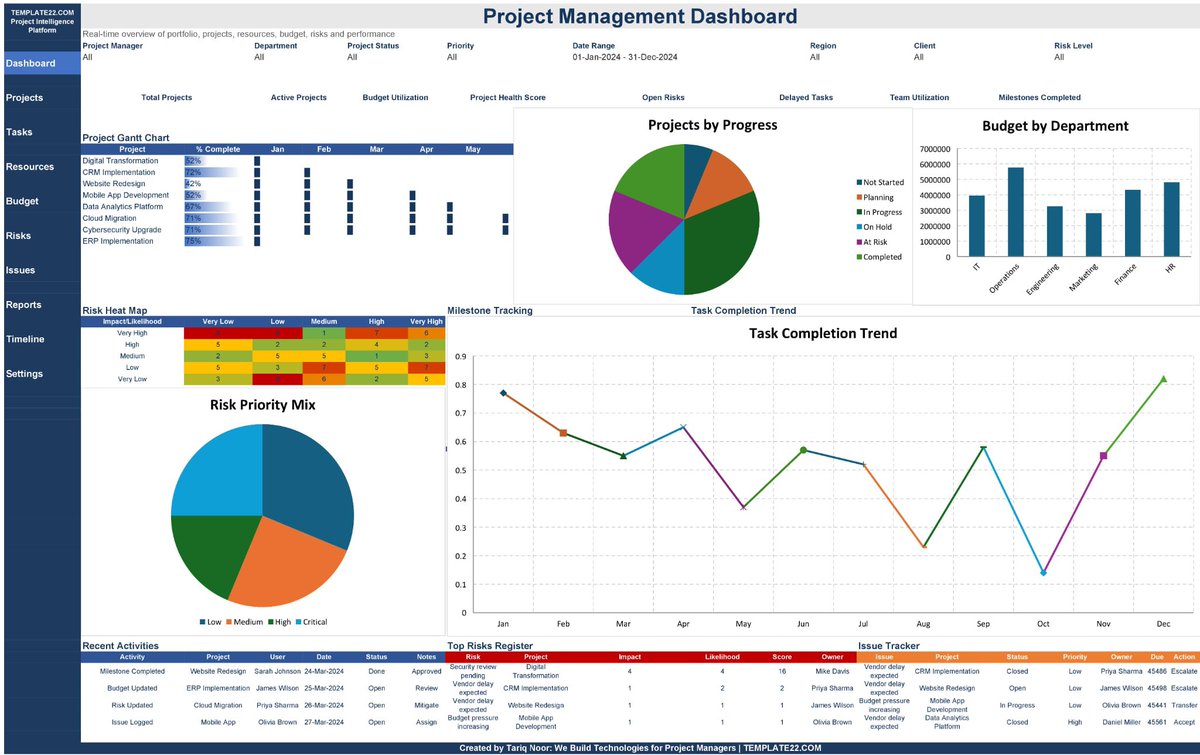
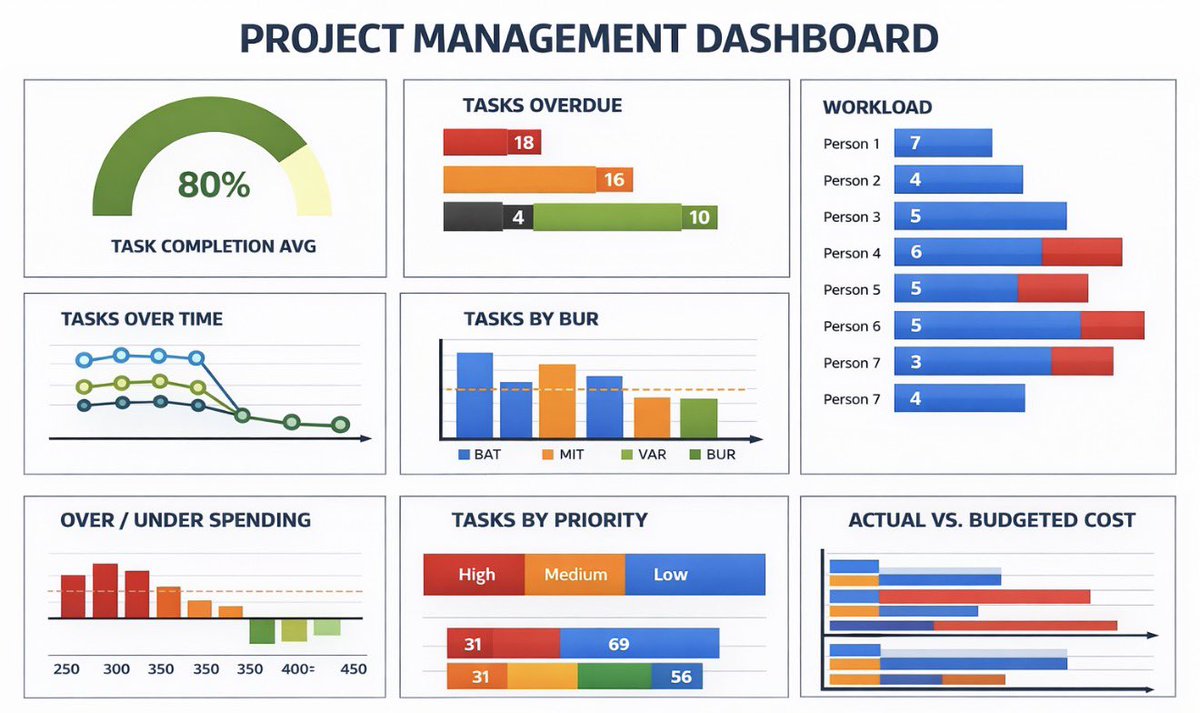
Advanced Project Portfolio Management Dashboard in Excel: lnkd.in/dndF5RbR
Did you know that more than 60% of projects miss either time, cost, or scope… and in many companies, leaders see numbers that are already 30–45 days old?
That happens when project data lives in scattered sheets, emails, and people’s heads. Decisions become guesses. Teams work hard, but leaders are blind.
An advanced project management dashboard in Excel changes that story.
It starts with one clean Data sheet.
All projects, milestones, budgets, risks, resources, issues – entered in structured tables. No fancy visuals yet, just disciplined data. This is the “engine room” that powers everything.
Then you build your KPIs:
•Schedule Performance (on-time %)
•Budget vs Actual
•Scope Delivery
•Risk Exposure
•Issues & Change Requests
•Resource Utilization
•Overall Project Health
Each KPI gets a simple formula, a clear owner, and a refresh rhythm. When the data updates, the whole dashboard updates.
Next, you turn numbers into visual decisions:
traffic-light status, trend lines, bar charts, and portfolio views. In one screen, your sponsor can see:
✔ Which projects are in trouble
✔ Where money is leaking
✔ Which teams are overloaded
✔ What needs a decision this week
The magic is not the charts. The magic is consistency. Same structure for every project. Same KPIs across the portfolio. Same “single source of truth” in Excel.
When you do this well, meetings change.
Instead of arguing about whose numbers are right, you spend 90% of the time on actions: re-prioritizing scope, reallocating resources, protecting high-value projects.
If you lead projects, do not wait for an enterprise tool to rescue you. Start with Excel. Design one advanced dashboard. Make it your control tower.
Because the project manager who controls the information… controls the outcome.
1
8
624
Project Management retweeted
A MUST-READ book on Project Cost Management: The Art & Science of Cost Management : lnkd.in/dWDjt-PR
1
6
544
Project Management retweeted
A MUST-READ book on Project Cost Management: The Art & Science of Cost Management : lnkd.in/dWDjt-PR
1
5
659