
I code, I trade, I lift & I grow. Follow me to level up your skills.
Joined December 2017
- Tweets 435
- Following 95
- Followers 74
- Likes 794
92 Photos and videos


Pinned Tweet

22 Jul 2025
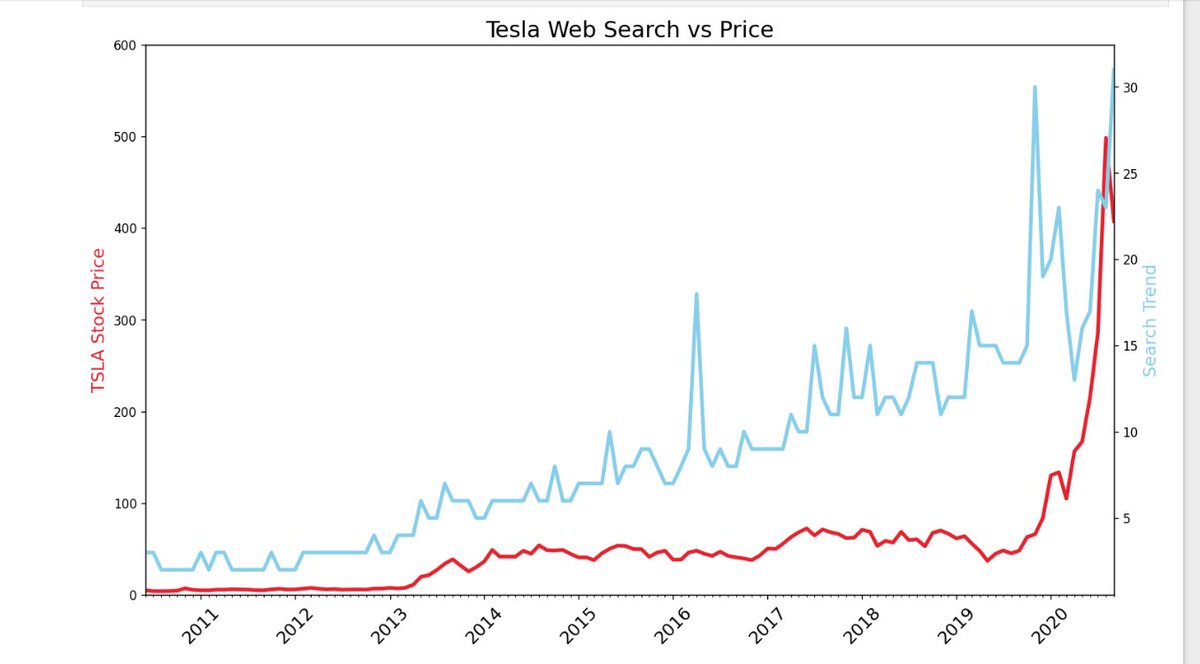
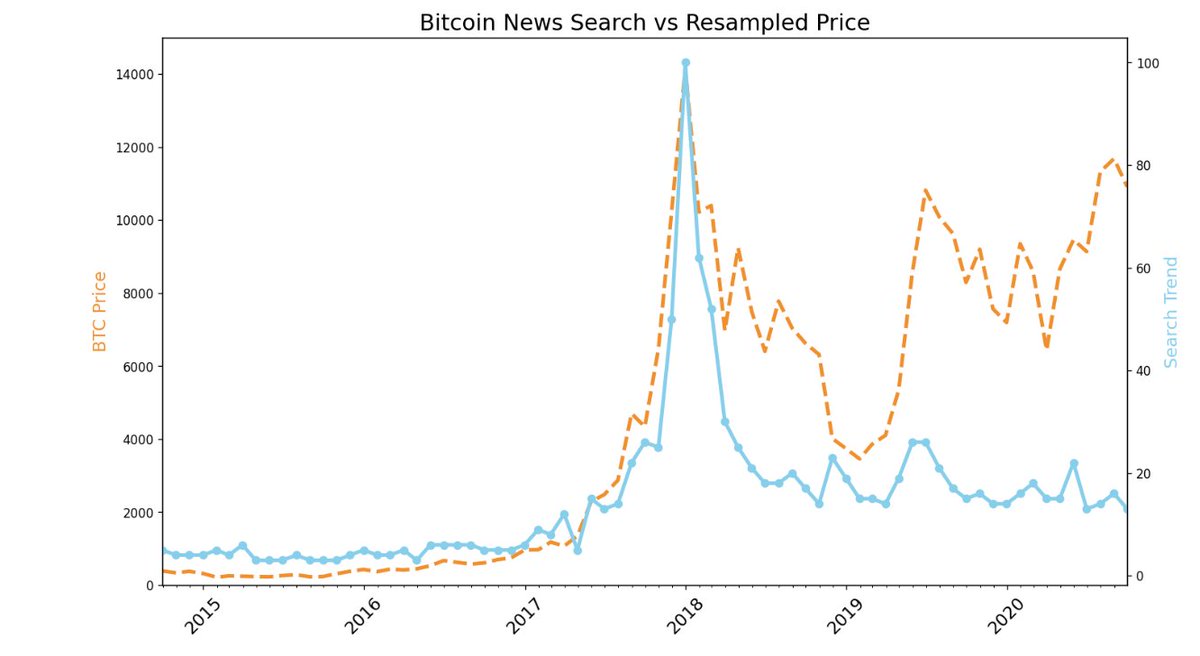
Day 60 of Diving into Python
Explored real-world data visualization using Pandas & Matplotlib 📈
✅ Cleaned messy datasets using .isna(), .dropna()
✅ Used .groupby() & .count() for aggregate insights
✅ Resampled time series data (daily to monthly)
✅ Merged datasets using relational columns to uncover connections
✅ Plotted Tesla and Bitcoin price vs Google Search Trends
📊 Insight: A sharp spike in public interest (search trend) often precedes or coincides with price rise.
#100DaysOfCode #DataScience #Python #Matplotlib #Pandas #Bitcoin #Tesla
1
4
301
10 Sep 2025
🧠 Day 71 of Diving into AI/ML
Dived deeper into calculus today:
Understood dependent & independent variables
Explored multivariable calculus and solved examples
Learned what the Jacobian is and how to visualize it with contours
Next step: exploring real-world applications of the Jacobian.
#AI #MachineLearning #100DaysOfML
2
44
🧠 Day 70 of Diving into AI/ML (Learnt over a span of week)
Today was a big step deeper into linear algebra:
🔹 Saw how matrices perform linear transformations.
🔹 Learnt Gaussian elimination to find matrix inverses.
🔹 Explored change of basis & the Gram-Schmidt process to build an orthonormal basis (where AT=A−1A^T = A^{-1}AT=A−1). Helps simplify the calculations
🔹 Discovered eigenvectors (vectors that stay the same after transformation) & eigenvalues (the scaling factor).
🔹 Connected it all to Google’s PageRank, where eigenvectors/values explain how backlinks decide the “importance” of a page.
Will be diving into calculus ahead.
#100DaysOfML #AI #LinearAlgebra
3
57
24 Aug 2025
Watched Salaam Bombay today, it truly moved me.
It captures the harsh realities of life on the streets of Mumbai. The poverty, the struggles, and the way children grow up amidst it all. Though released around 1988, the story feels timeless.
It’s the story of a young boy, forced by his mother to earn 500 rupees before he can return to his village. His journey shows how, even with hard work and determination, life’s adversities can still break you down.
Touched
#SalaamBombay #SpiritofMumbai
#Mumbai #movie
28
23 Aug 2025
Day 69 of Diving into AI/ML
After a short break (was down with some illness personal stuff), I’m back at it. Today I brushed up on projections and change of basis in linear algebra.
I started with scalar and vector projections.Then I revisited the idea of a basis.
A basis is just a set of linearly independent vectors that can describe an entire space.
Change of basis is where it gets interesting.
It’s about describing the same data in a different coordinate system.
With orthogonal vectors, life is easy.
With non-orthogonal ones, you’ve got to pull out matrices.
What clicked for me is why change of basis matters in ML. Changing the basis uncovers patterns, reduce noise, or make data line up better for things like PCA or regression lines.
Feels good to be back learning. The math is heavy at times, but it’s also kind of beautiful when you see the connections.
#100DaysOfML #AI #MathForML
1
38
🧠 Day 68 of Diving into AI/ML
Today I deepened my understanding of linear algebra concepts that power ML models.
1️⃣ Dot Product – Measures alignment between vectors.
Positive = same direction, zero = perpendicular, negative = opposite.
Think of it as a projection.
2️⃣ Cross Product (3D) – Returns a vector ⬆️ perpendicular to both inputs.
Magnitude = area of the parallelogram they span.
3️⃣ Matrix Inverse - If A transforms a vector, A⁻¹ brings it back. Only works if A is square & full-rank. 🔁
4️⃣ Linear Transformation – Stretch, rotate, flip, or squash vectors via matrices. Always sends origin to origin, preserves lines. 🔄
5️⃣ Duality – Vectors not just as directions, but as functions measuring other vectors.
#100DaysOfML #LinearAlgebra #AI #DeepLearning #MathForML #NeuralNetworks #Python
1
3
68
🧠 Day 67 of Diving into AI/ML
TIL about Vectors & Matrices
🔹 Mastered vector arithmetic: addition, subtraction, scalar multiplication
🔹 Understood linear dependence vs. independence
🔹 Learned to calculate the determinant and its role in scaling/invertibility
🔹 Realized why matrices are often called transformations, i.e how they rotate, scale, or shear space.
Next up: dive deeper into eigenvalues, projections, and matrix decompositions!
P.S. Relearning concepts from undergrad, 3Blue1Brown makes it all click again 🔁🎥
youtube.com/playlist?list=PL…
#100DaysOfML #MachineLearning #AI #LinearAlgebra #Vectors #Python #DeepLearning
1
3
47
Day 66 of Diving into AI/ML
🧠 TIL about Neural Networks (NNs) -- diving into the AI/ML world after getting comfortable with Python!
• NNs are made of nodes (neurons) organized in layers—input, hidden, and output—connected via weighted links.
• Each node applies an activation function like ReLU, Sigmoid, or Softplus to transform data.
• Learning happens through backpropagation—errors are sent backward to adjust weights using chain rule.
• Weights and biases are the key parameters a NN learns.
• Example explored: medicine dosage vs efficiency—how hidden layers capture non-obvious patterns.
• NNs can approximate complex functions—think of it as fitting the right squiggle to the data.
🔍 Next up: diving deeper into the math behind activations, gradients, and optimization.
#NeuralNetworks #DeepLearning #AI #MachineLearning #TIL
2
79
Parin | Learn something everyday with me retweeted
29 Jul 2025
📍Day 64 of Diving in Python
Explored the Nobel Prize dataset with data visualizations:
• Created choropleth maps to visualize prize distribution by country
• Used bar & sunburst charts to show segments across categories
• Plotted best-fit lines by category using Seaborn.lmplot() with hue, row, lowess
• Compared box plots with time series for richer insights
• Visualized distribution & descriptive stats using histograms
📊 Key Insights:
• Nobel laureates range from 17 to 97 years old
• 📈 Avg age = 59, with both young & old winners in recent years
• 🌍 Pre-WW2: US, UK, Germany were top. Post-WW2: US dominates by far
• 📅 Timeline shows rising diversity in winners across decades
Next: Dive deeper into trendlines & advanced statistical visualizations.
#Python #DataScience #Seaborn #Plotly #NobelPrize #100DaysOfCode #DataVisualization

1
1
75
Parin | Learn something everyday with me retweeted
15 Jul 2025
🧠 Chess.com wasn’t built to scale.
It was launched in 2007 on custom PHP, it grew massive before a major rewrite.
In 2017, they migrated to Symfony to help with scaling issues.
Today, ~80% of their revenue comes from premium subs.
#SoftwareEngineering #Chess #PHP
1
1
3
208
Parin | Learn something everyday with me retweeted
28 Jul 2025
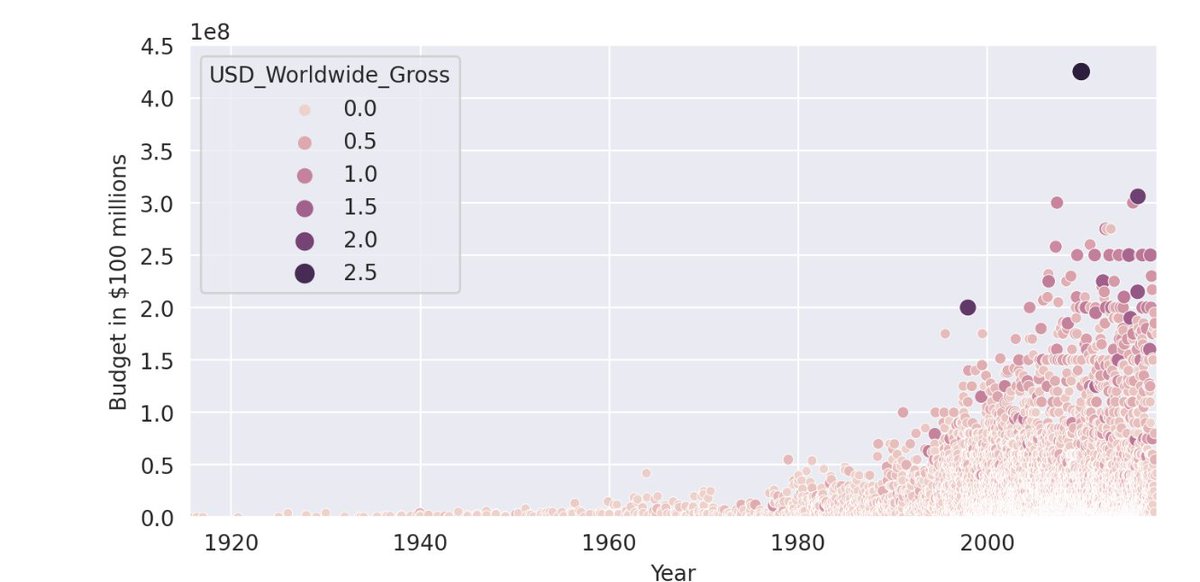
Day 63 of Diving in Python 🐍
Dived into data cleaning, visualization & regression with a movies dataset 🎬📊
• Cleaned messy columns using nested loops
• Filtered data using .loc[] & .query()
• Created bubble charts with Seaborn & styled them
• Converted years into decades using floor division
• Applied linear regression with Seaborn & scikit-learn
• Predicted revenue based on movie budget
📈 Insight: Every $1 increase in budget leads to ~$3.5 increase in revenue.
Budgets and movie releases have skyrocketed since 1975.
Next up: Diving deeper into the algebra behind regressions to better understand the math 🔍
#Python #DataScience #100DaysOfCode #Pandas #Seaborn #MachineLearning #DataVisualization #Regression #Movies #PythonLearning
1
2
69
30 Jul 2025
📊 Day 65 of Diving into Python & Data Science
Explored how handwashing transformed mortality rates using real historical data (1841–1849).
🧼 In 1846, Semmelweis made handwashing mandatory. The result? A sharp, visible drop in death rates.
What I did:
Superimposed histograms with different lengths
Visualized distributions using Kernel Density Estimation (KDE)
Improved KDEs with bandwidth & boundary tweaks
Used scipy to test statistical significance via p-values
Understood how small habits like hygiene can reflect in big statistical signals!
📈 Looking at the chart, it's clear: Handwashing saves lives.
Next up: 🧠Dive deeper into algebra of regressions & correlation analysis.
#DataScience #Python #Numpy #Matplotlib #SciPy #Handwashing #PublicHealth #StatisticalSignificance #R2 #RegressionAnalysis

2
44
26 Jul 2025
Day 62 of Diving into Python 🐍
Explored the power of NumPy — the foundation of numerical computing in Python 🔢
🧪 Generated arrays using:
np.arange()
np.linspace()
np.random
🔍 Analyzed data with ndarray:
Slicing & subsetting
Performed scalar & vector arithmetic (add/multiply)
🖼️ Explored image processing using NumPy:
Converted color images to grayscale
Applied inversion for cool visual effects
✨ Insight: Images are just NumPy arrays! Once you get that, manipulating pixels becomes math.
#100DaysOfCode #Python #NumPy #DataScience #ImageProcessing #buildinpublic
1
3
79
Parin | Learn something everyday with me retweeted
22 Jul 2025
Day 60 of Diving into Python
Explored real-world data visualization using Pandas & Matplotlib 📈
✅ Cleaned messy datasets using .isna(), .dropna()
✅ Used .groupby() & .count() for aggregate insights
✅ Resampled time series data (daily to monthly)
✅ Merged datasets using relational columns to uncover connections
✅ Plotted Tesla and Bitcoin price vs Google Search Trends
📊 Insight: A sharp spike in public interest (search trend) often precedes or coincides with price rise.
#100DaysOfCode #DataScience #Python #Matplotlib #Pandas #Bitcoin #Tesla
1
4
301
23 Jul 2025
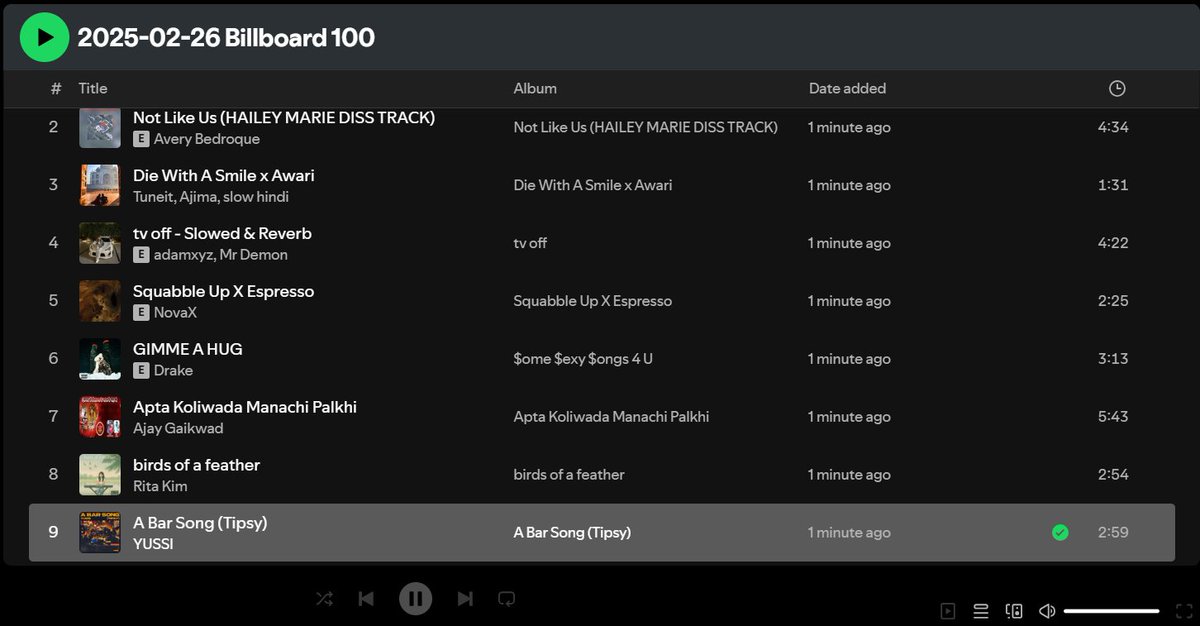
Day 61 of Diving into Python 🐍
Shifted gears to interactive Data Visualization using Pandas & Plotly 📊
🧹 Cleaned messy datasets:
Handled NaNs
Fixed mixed data types (separated by ; or $)
Used .groupby(), .merge(), and .count() for aggregated views
📈 Visualized data through:
Pie Charts for category share
Bar Graphs for comparisons
Box Plots to check distribution & outliers
Scatter Plots to observe relationships
#100DaysOfCode #Python #Plotly #DataScience #DataViz #connect #buildinpublic
3
4
55
Parin | Learn something everyday with me retweeted
20 Jul 2025
🚀 Day 58 of Diving in Python
Explored Data Visualization using Matplotlib & Pandas
✅ Analyzed StackOverflow tag data for popular languages. data.stackexchange.com/stack…
✅ Used .pivot(), .rolling().mean() for smoothing trends
✅ Cleaned & reshaped real data
#100DaysOfCode #Python
1
3
75
Parin | Learn something everyday with me retweeted
15 Jul 2025
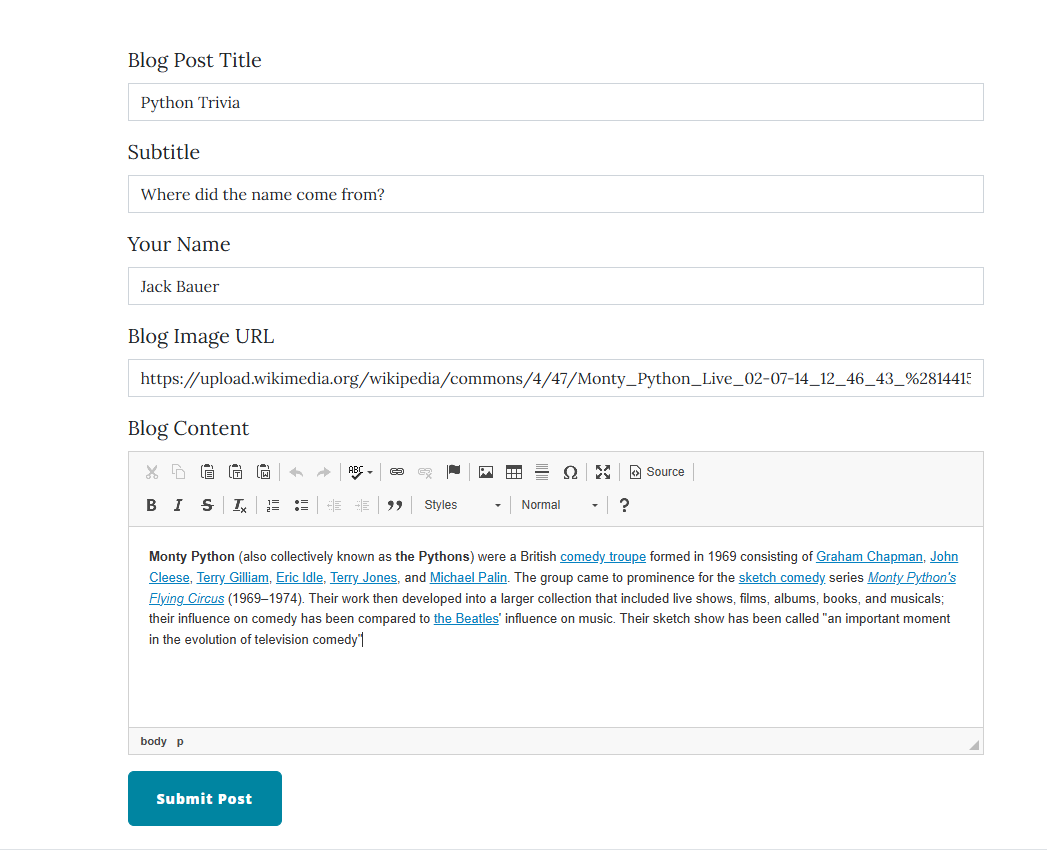
🚀 Day 56 of Diving in Python
🔸 Used Flask relationships to enable commenting by authenticated users
🔸 Added Gravatar to show user profile pictures in blog comments
🔸 Secured the post creation route. Only admin can add blogs.
🔸 Deployed live on Render. Please check out👇
🌐 blogs-va8y.onrender.com
#Python #Flask #100DaysOfCode #WebDev
1
1
85