
@APSPhysics' journal for statistical, nonlinear, biological, and soft matter physics.
- Tweets 3,971
- Following 16
- Followers 12,878
- Likes 125
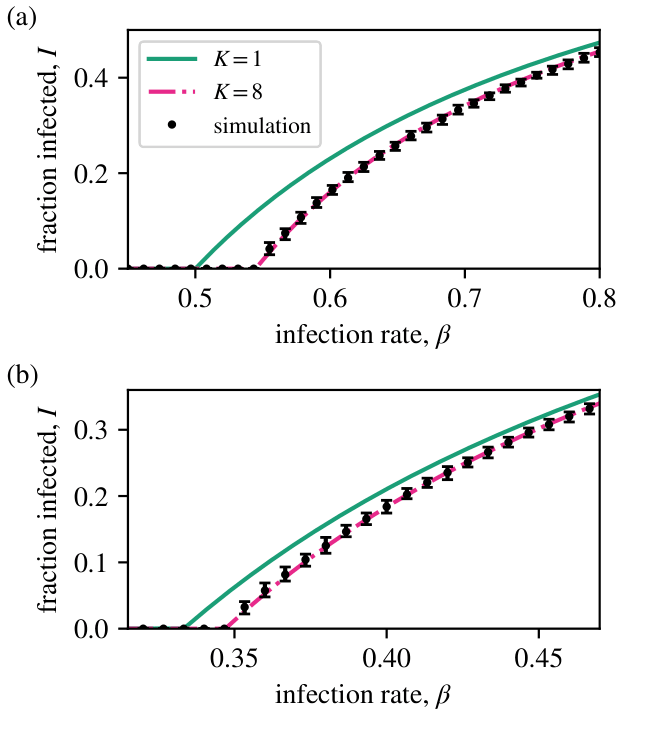


ALT Figure with two graphs showing the fraction infected on the Y axis and the infection rate on the X axis. The top graph is for 3-regular random graphs and shows a green curve for K=1, a pink curve for K=8, and black dots indicating the simulation. The bottom graph is for 4-regular random graphs and appears very similar. The black dots closely follow the pink line in both cases, showing a compelling improvement in predictions.


ALT A black-and-white photo shows Pelé dribbling a soccer ball past several opposing team members, while stands full of onlookers watch.

ALT Messi, in blue jersey and shorts, prepares to kick the ball on a grass field, crowd blurred in background.

ALT Players circle up in the field at a soccer stadium, while a smattering of fans watches on from the stadium seats. The soccer club’s motto is painted in yellow on a blue row of seats, reading “Més que un club.”
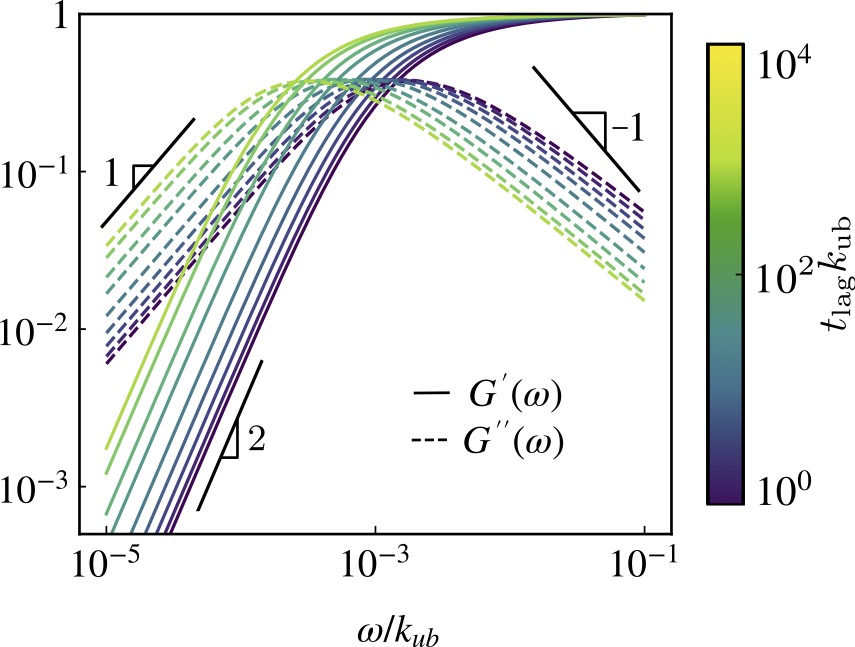
ALT A graph showing the estimated storage modulus, labeled G′ and shown as a solid black line, and loss, labeled G′′ and shown as a dashed black line, using the intermediate scattering function measured after different lag times. Slopes characteristics of Maxwell viscoelastic gel are displayed as reference.

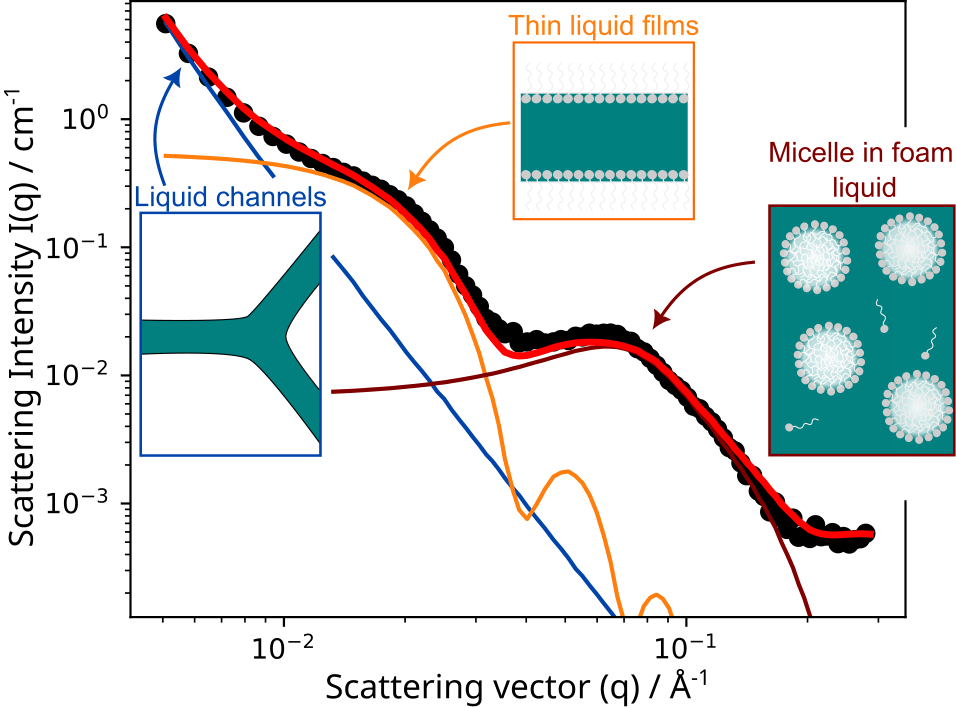
ALT Graph showing small-angle neutron scattering data for a foam aged eight hours at nine centimeters above the liquid surface. Insets point to different lines on the graph and show schematics of liquid channels, thin liquid films, and a micelle in foam liquid. A blue line with a negative slope shows liquid channels. An orange line that curves down sharply in multiple dips shows thin liquid films. and a micelle in foam liquid. A red lines that also has several dips down shows a micelle in foam liquid.
ALT A graph showing time [steps] on the x axis and tumor volume on the y axis. The graph shows different values for background fitness, g: 2.0 in blue, 2.1 in orange, 2.2 in green, and 2.3 in red. The plots show that tumor volume decreases most sharply for higher background fitness values.

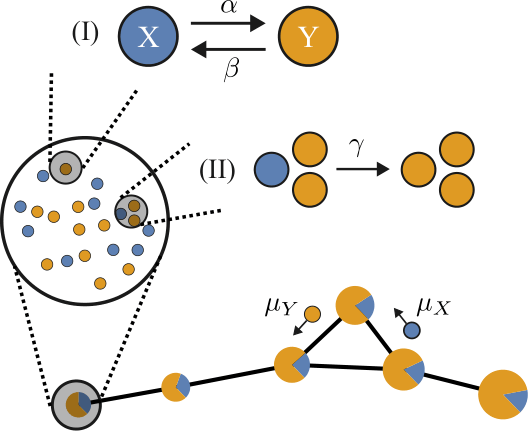
ALT Graphic showing an overview of the model. Agents are shown as blue or yellow dots. Each color represents one of two competing opinions. Two pathways show how opinions form on each node. One shows spontaneous opinion flipping. The other shows how opinions adjust due to influence of others, shown by one blue and two yellow dots that then become three yellow dots. At the bottom are more dots that show the change in proportion of yellow and blue to show the distribution of opinions at the end.
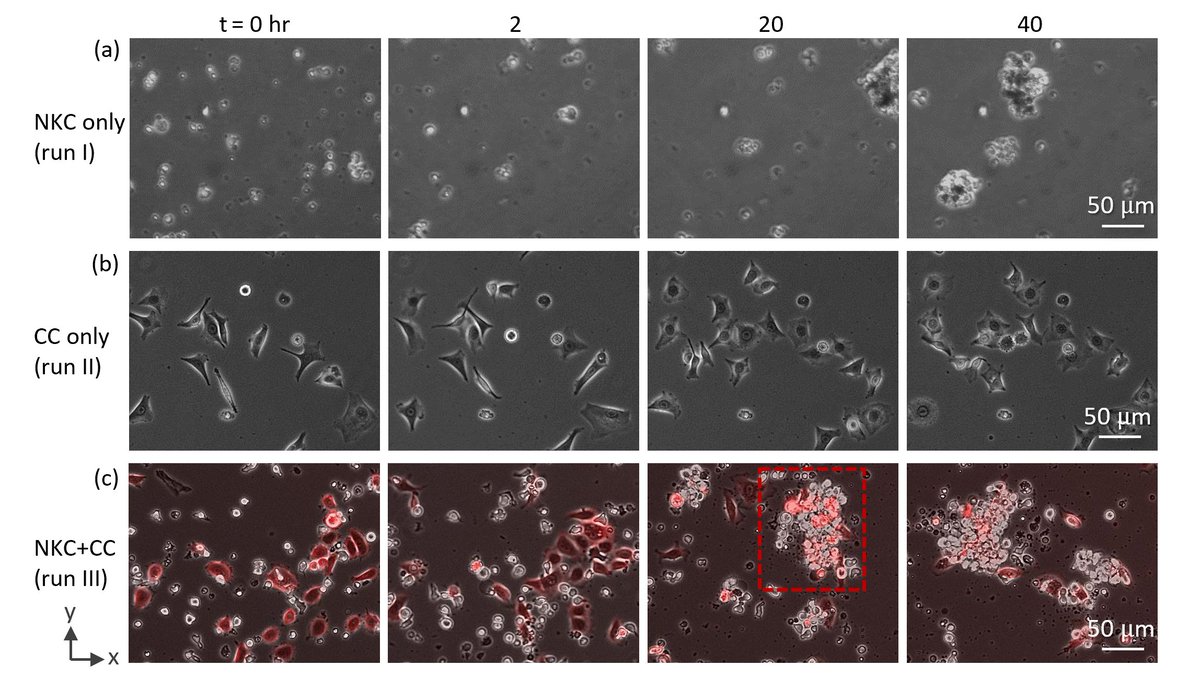
ALT A series of sequential microscopic images of natural killer cells and cancer cells in culture. The top row of four images displays natural killer cells alone in culture at four time points: 0 hours, 2 hours, 20 hours, and 40 hours. The middle row displays cancer cells alone in culture at the same time points. The bottom row displays natural killer cells cultured with cancer cells at the same time points. As time progresses, both cell groups gradually aggregate in all three culture conditions, but with different clustering behaviors.
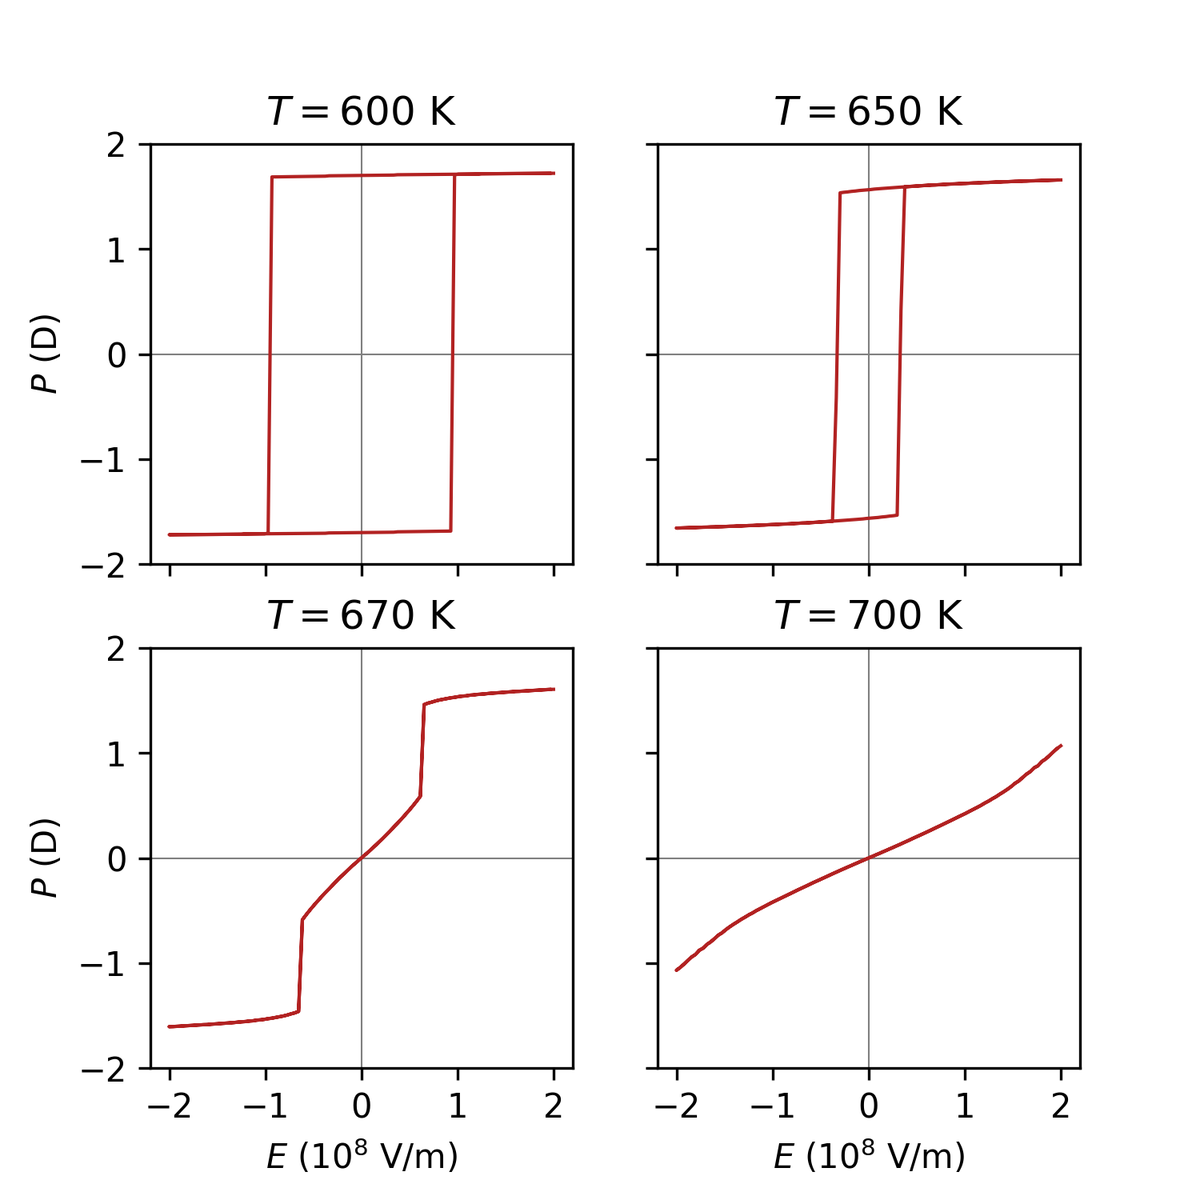
ALT Four square plots showing red hysteresis loops for a single crystal for four values of temperature. E(10^8 V/m) is on the X axis from -2 to 2, and P (D) is on the y axis from -2 to 2. 600 K shows a wide vertical rectangle with an extending line at each end, 650 K shows a narrow vertical rectangle with an extending line at each end, 670 K shows a diagonal line with four bends, and 700 K shows a very slightly curved diagonal line.

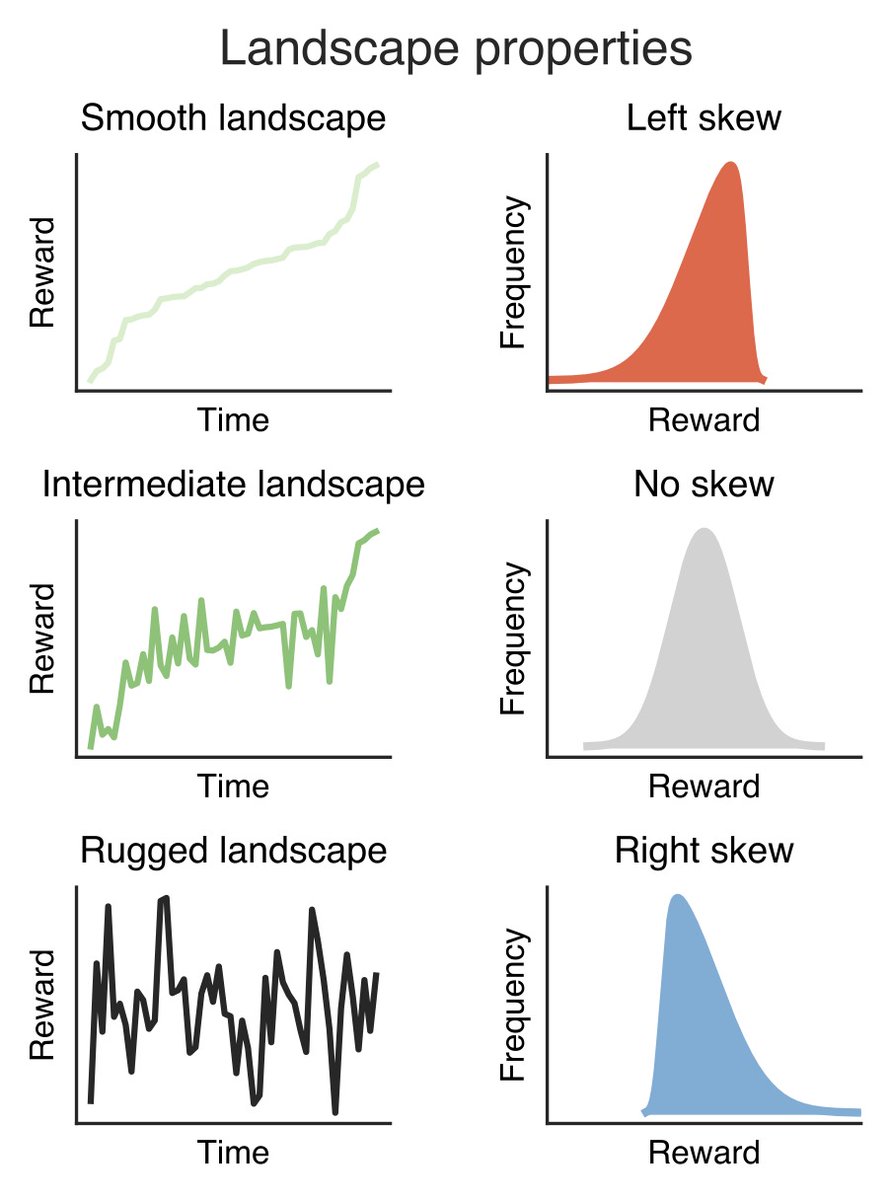
ALT A grid of six graphs titled "Landscape properties" comparing fitness landscape dynamics (Reward over Time) on the left with their corresponding distributions (Frequency over Reward) on the right. From top to bottom: a "Smooth landscape" shows a steadily increasing reward line paired with a "Left skew" distribution (peaking at high rewards); an "Intermediate landscape" features a fluctuating but upward-trending reward line paired with a symmetrical "No skew" distribution; and a "Rugged landscape" displays highly volatile, erratic reward spikes paired with a "Right skew" distribution (peaking at low rewards).
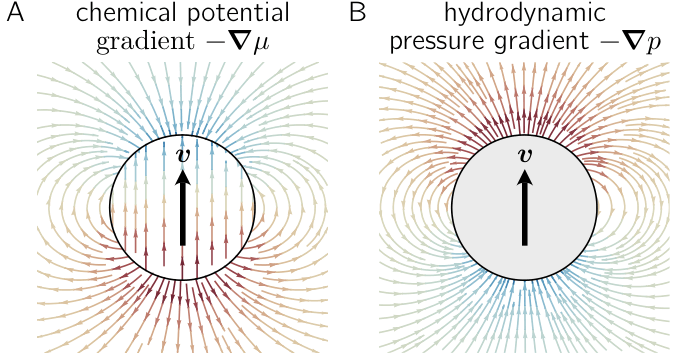
ALT Graphic comparing the motion of a condensate and a colloidal particle moving with a velocity of v. On the left is the condensate, which is moving with a chemical potential gradient. On the right is the colloidal particle, which is moving with a hydrodynamic pressure gradient. The gradient of each is shown by arrows with higher values in red and lower values in blue.