
In crypto since 2017 | Alpha Research | Airdrops 🪂 | Trading
Joined April 2023
- Tweets 5,399
- Following 64
- Followers 531
- Likes 3,366
1,726 Photos and videos


$ASTER looks like it’s sitting at a make-or-break level
Unlike many altcoins that are already extended from their lows
$ASTER has spent months building a base above a rising support trendline
📍 Critical Zone
The ascending support underneath price has been respected multiple times
As long as this structure holds, buyers remain in control
📍 Key Level 1: $1.40
This is the first major resistance and the level that rejected the strongest rally after launch
A breakout here would likely attract significant momentum
📍 Key Level 2: $2.42
The next major liquidity zone and one of the most important historical resistance levels on the chart
From current prices around $0.65:
Target 1 ($1.40) → ~115% upside
Target 2 ($2.42) → ~270% upside
The interesting part isn’t the targets
It’s the structure
While many charts are still trying to establish support
$ASTER has already spent months compressing above an ascending trendline
These types of consolidations often precede the strongest directional moves once resistance finally breaks
The level that matters now is simple:
✅ Hold the rising support
✅ Reclaim $1.40
If that happens, the path toward the $2.40 region becomes much more realistic
$ASTER is approaching the point where accumulation either turns into expansion… or fails completely
The next few weeks could decide which one it is
4
91
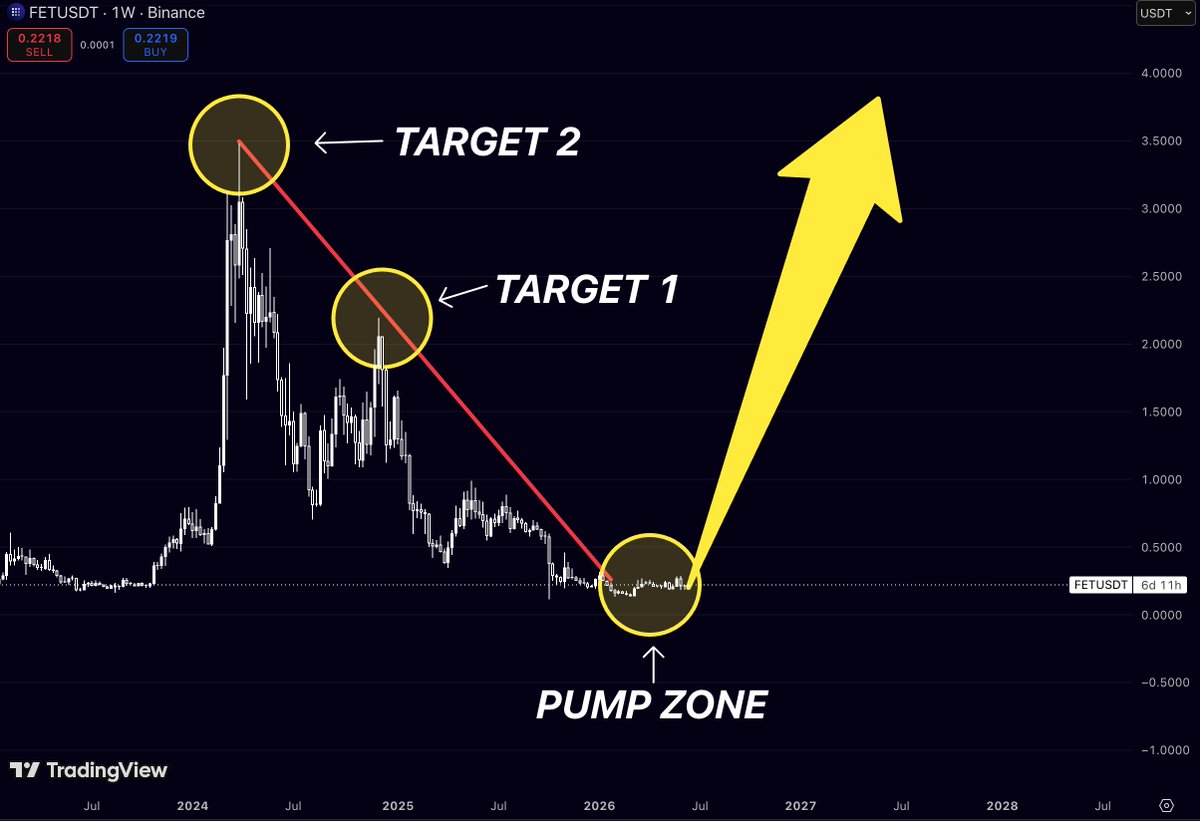
$FET is sitting exactly where you want to see a long-term altcoin
The chart has completed a full cycle:
Parabolic expansion into 2024 ATHs
Multi-month distribution and correction
~90% drawdown from highs
Long accumulation near cycle lows
Now price is compressing around the same area where previous expansions began
What’s interesting is that the market has already spent over a year digesting the excess from the AI narrative boom
Most weak holders have likely been flushed out, while volatility continues to contract
The two major levels on the chart stand out clearly:
🎯 Target 1: ~$2.00-$2.20
That’s the first major supply zone and the area where sellers stepped in during 2024.
🎯 Target 2: ~$3.40-$3.60
The previous cycle high region and the level that would likely attract significant attention if the AI sector catches another strong bid
Current structure:
Accumulation zone: $0.15-$0.30
First breakout target: $2.00
ATH retest zone: $3.50
From current levels, a move to Target 1 would represent roughly 10x, while a full return to ATH territory would be closer to 15-17x
The chart isn’t confirming a breakout yet
but it is showing something many altcoins don’t have right now:
a completed reset after a full market cycle
1
1
9
624
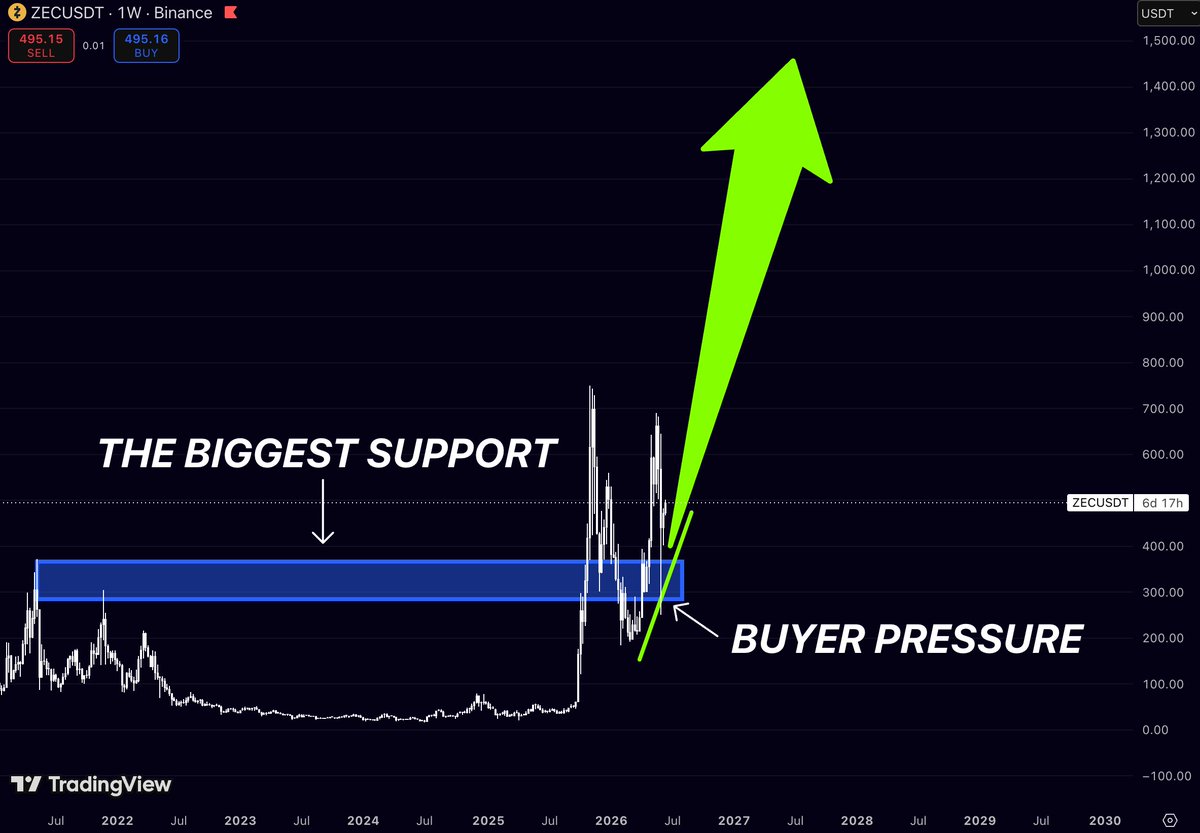
$ZEC keeps proving one thing: buyers are defending the same zone again and again.
While most altcoins continue searching for support, $ZEC has already found one.
And it’s a level the market has respected multiple times.
The $280-$370 area isn’t just another demand zone.
It’s where some of the strongest buying reactions on the entire chart have appeared.
Every major pullback into this range has attracted aggressive buyers.
Every rejection below it has been short-lived.
That’s not random.
It’s accumulation.
What’s even more interesting is that price is now printing higher lows while holding above this support region.
Momentum is slowly shifting in favor of the bulls.
The longer a market spends building a base, the more explosive the eventual move tends to be.
And after years of consolidation, $ZEC is sitting on one of the cleanest structures in the privacy coin sector.
The market doesn’t need a new narrative.
It already has one.
Strong support.
Consistent buyer pressure.
And a chart that’s beginning to look ready for expansion.
If this accumulation range continues to hold, the next major move could catch a lot of traders off guard.
2
2
8
462
What if $TEL has already printed its cycle bottom?
Not many charts look as compressed as $TEL right now
For nearly five years, price has been grinding lower
respecting a massive descending trendline that started at the 2021 peak around $0.065
Every rally failed
Every breakout attempt got sold
Until now
The interesting part isn’t the target
It’s where price currently sits
$TEL is trading near the exact area where sellers have historically run out of momentum
After years of decline, volatility has collapsed, downside expansion has slowed
and the chart is pressing directly against long-term resistance.
That’s usually how major reversals begin
Not with excitement
With boredom
A confirmed breakout above this multi-year structure would completely change the market narrative
And if history decides to reward patience?
The previous cycle high near $0.065 becomes the obvious magnet
From current levels, that’s a move most traders would call impossible today
Which is usually how the best setups look before they happen
5
13
401
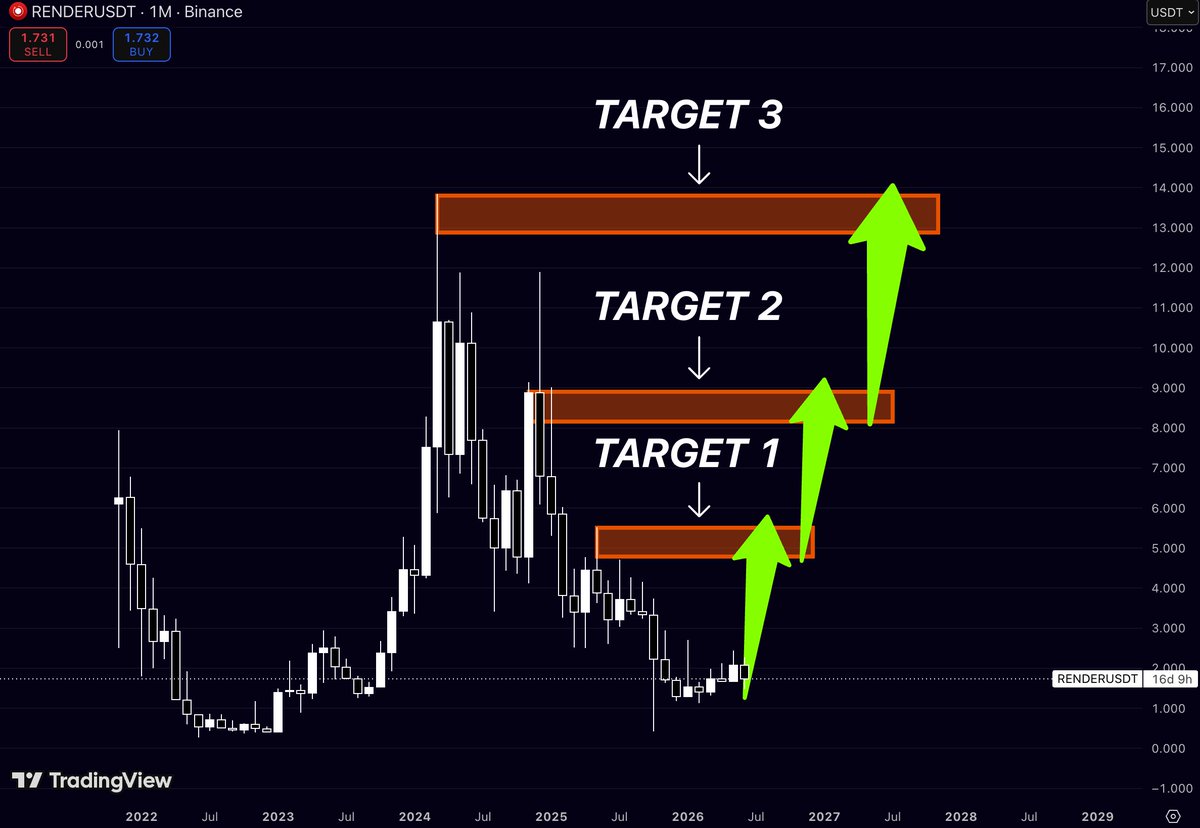
$RENDER is back at a level where previous cycles found buyers
Most traders are focused on the AI narrative
The chart is showing something even more important:
price is reclaiming strength after a prolonged correction
On the monthly timeframe, three major liquidity zones stand out:
Target 1: ~$5.0-5.5
Target 2: ~$8.2-9.0
Target 3: ~$13.0-14.0
Current price is still trading below all three
That means the market hasn’t even begun testing the major supply areas from the last cycle
What’s interesting is how clean the structure looks
After topping near double digits, $RENDER spent more than a year correcting
cooling off sentiment, and shaking out late buyers
Now price is attempting to build a new base above the cycle lows
If momentum continues to return, the first objective is reclaiming the $5 zone
Above that, the chart opens toward $8-9, where the next significant liquidity cluster sits
And if the broader market remains favorable
a move back into the $13-14 region becomes a realistic discussion rather than a fantasy
The crowd is still comparing today’s price to the highs
I’m watching how much upside remains before the chart encounters major resistance again
$RENDER looks like one of the cleaner recovery structures among large-cap AI plays
2
4
16
675
$DASH has spent nearly four years building a base
Most traders see a dead chart
I see a market that’s been compressing beneath the same long-term breakout level for an entire cycle
The level that matters sits around $170
That’s where the multi-year trendline intersects with the first major resistance zone
A breakout there wouldn’t just be another rally
It would mark the end of a downtrend that’s been in place since the 2021 peak
And once a market escapes a structure that old, moves tend to happen much faster than people expect
The first breakout gets attention
The next leg creates believers
The real move catches everyone who waited for confirmation
$DASH is still trading near cycle lows
The chart won’t stay boring forever
5
9
39
1,511
$CHZ might be one of the most FORGOTTEN charts in crypto right now
And that’s exactly why I’m paying attention
For nearly 4 years, price has done nothing but make lower highs and lower lows
Every rally failed
Every breakout got sold
Every bounce turned into another leg down
Now look where we are
Right back at the area where sellers are running out of room
The entire downtrend from the 2021 cycle top has compressed into one massive structure
Price is sitting at historical lows while the descending resistance that has controlled the chart for years is approaching its endpoint
That’s where trends die
And new ones begin
Most traders see a dead coin
I see a market that’s already gone through euphoria, distribution, capitulation, and years of apathy
The interesting part comes after that
A confirmed breakout from a multi-year structure doesn’t just attract traders
It attracts attention
And attention is what drives the biggest moves
The risk is obvious
The upside is sitting all the way back near the previous cycle highs
That’s why charts like this deserve a watchlist spot before they deserve headlines
3
2
10
1,038
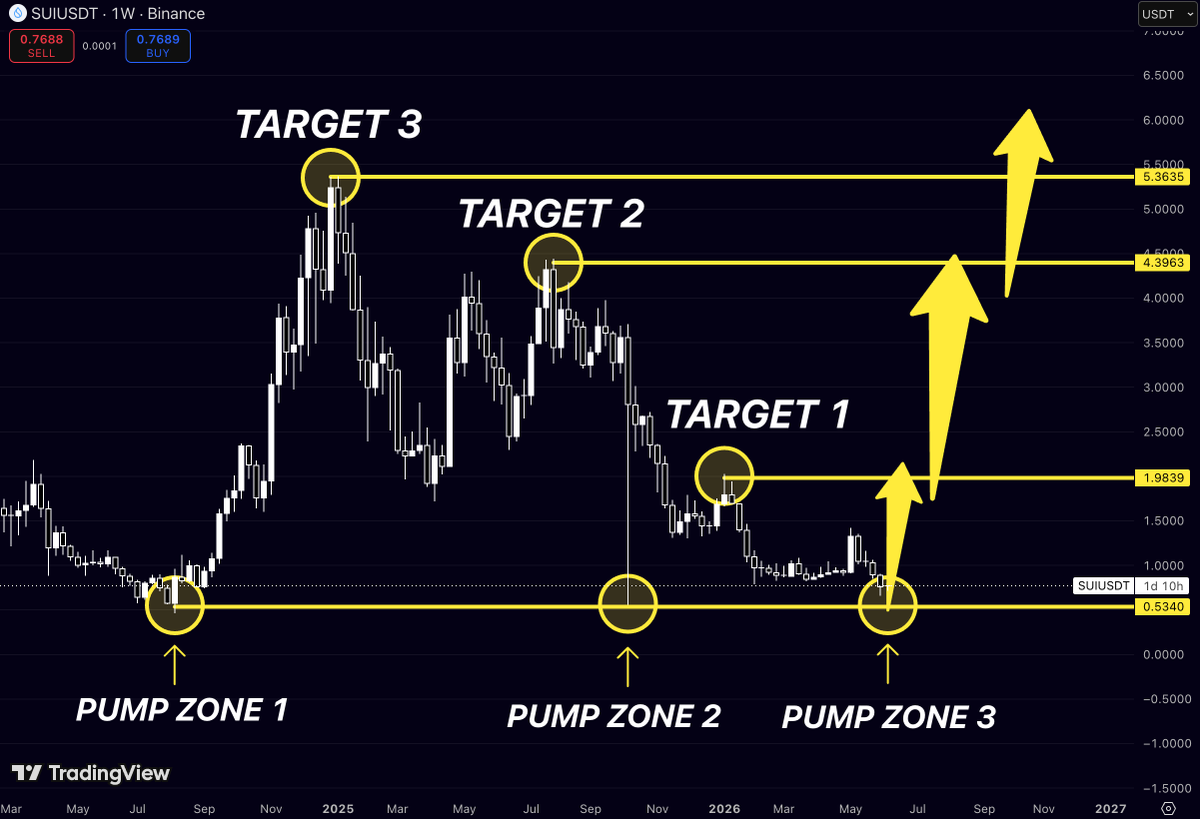
$SUI has now tested the same zone for the third time
And every major rally on the chart started from it
Look closely:
🟡 Pump Zone #1 → launch to ~$5.3
🟡 Pump Zone #2 → launch to ~$4.4
🟡 Pump Zone #3 → price is back at the exact area where buyers previously stepped in
That’s not a random support
That’s where demand has consistently overwhelmed sellers
The market has spent months correcting from the 2025 highs, but the structure is starting to look familiar again
If this floor holds, the roadmap becomes pretty obvious:
📍 Target 1: $1.98
📍 Target 2: $4.39
📍 Target 3: $5.36
What’s interesting is that each target lines up with a major rejection point from previous cycles
Those are the levels that trapped buyers on the way down
Now they become magnets on the way back up
Most traders are focused on what’s happened over the last few months
I’m looking at where every major $SUI rally has started
And right now, price is sitting in that zone again
2
129
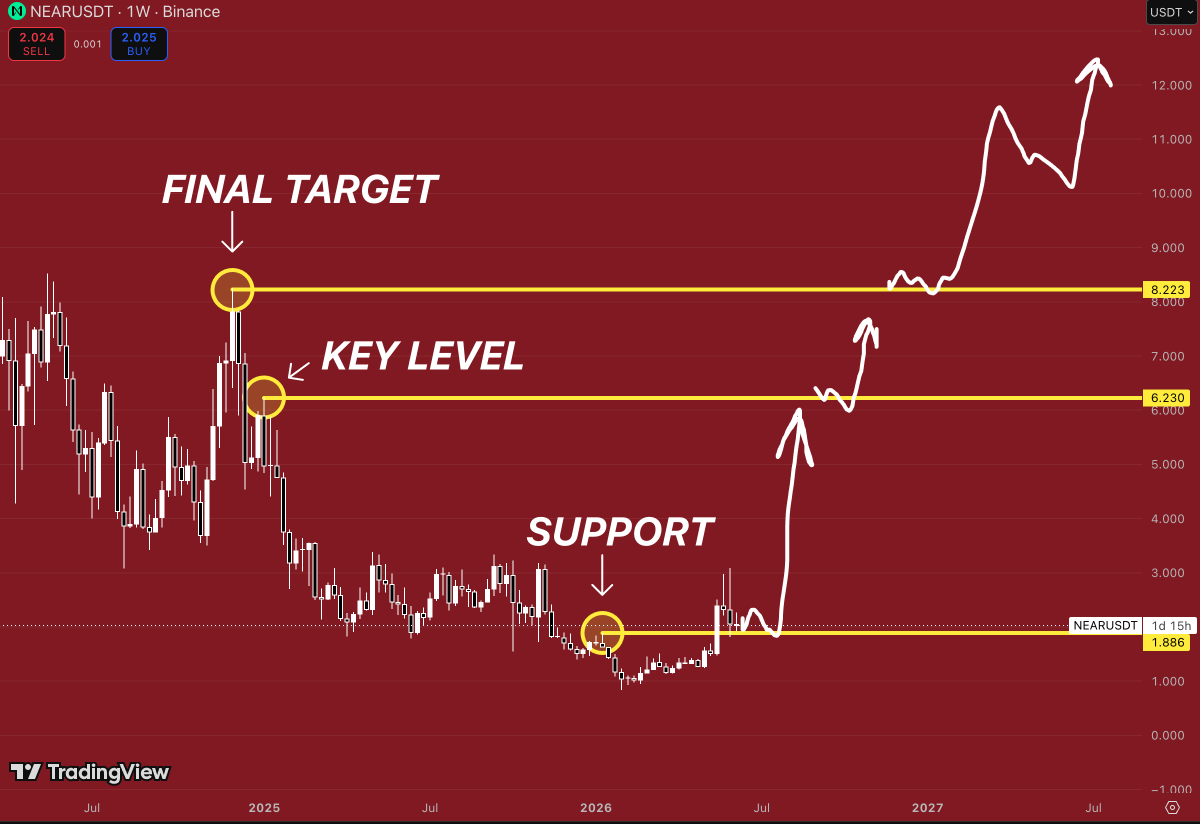
$NEAR is quietly doing something most charts never get the chance to do
It’s building a base directly above the level that marked the cycle lows
🟡 Support: $1.88
🟡 Key Level: $6.23
🟡 Final Target: $8.22
Right now the market is focused on every small move around $2
The bigger picture is much more interesting
For almost a year, $NEAR has been absorbing sellers around the same region while volatility keeps compressing
That’s usually where trends are born
The moment price starts pushing away from support, attention shifts fast
First traders notice
Then CT notices
Then everyone suddenly starts posting the same chart
$6.23 is the first level that really matters
Above that, the conversation changes completely
And if $NEAR ever starts trading back around $8 , nobody will be talking about whether $2 was a good entry
They’ll be asking why they ignored it
8
92
3,742
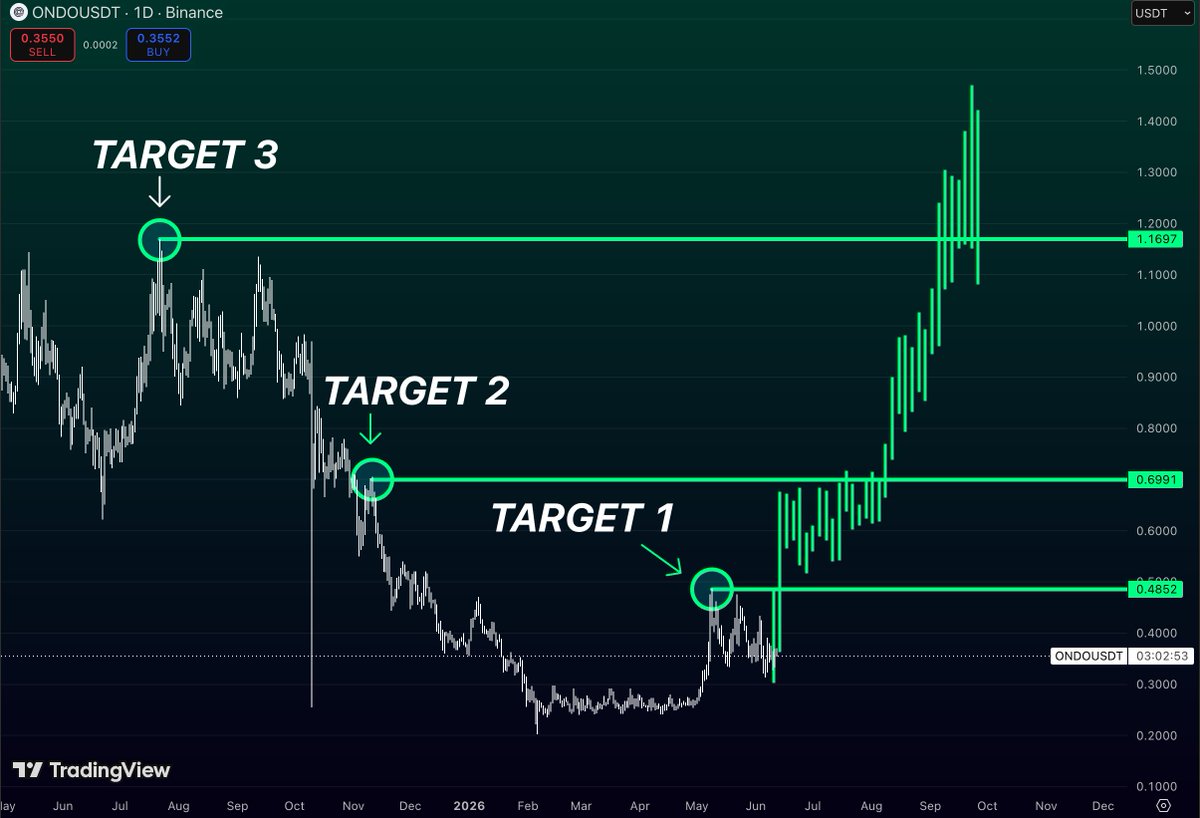
$ONDO is still sitting before the real move.
No targets hit yet.
No clean reclaim yet.
But that’s exactly why the chart is interesting.
Price is still trading near the lower part of the structure, while the main levels above remain completely untouched:
🎯 $0.48 - first major resistance
🎯 $0.69 - key breakout zone
🎯 $1.17 - macro target
The green path is the scenario, not the current move.
And that’s the point.
Most traders only start paying attention after the first big candle.
But the best setups usually appear before the chart starts looking obvious.
$ONDO has already built the base.
Now it’s about whether buyers can start taking back these levels one by one.
If that happens, the whole conversation around $ONDO changes fast.
2
2
9
848
$WLD is sitting where most traders stopped paying attention
The chart is still trading near cycle lows while the major supply zones remain untouched:
🎯 $2.16 - first key resistance
🎯 $4.17 - major breakout zone
🎯 $11.93 - cycle target
What’s interesting is that every one of these levels comes from previous market structure, not arbitrary projections
Right now, the market is pricing $WLD closer to its fear phase than its adoption phase
A move back to the first target would already represent a significant expansion from current levels
Reclaiming $2.16 would likely put $4 into play, and above that, the chart opens up fast
Most traders will only become interested after the breakout
The opportunity is usually before the crowd notices it
$WLD remains one of the more asymmetric setups on the board
3
14
908
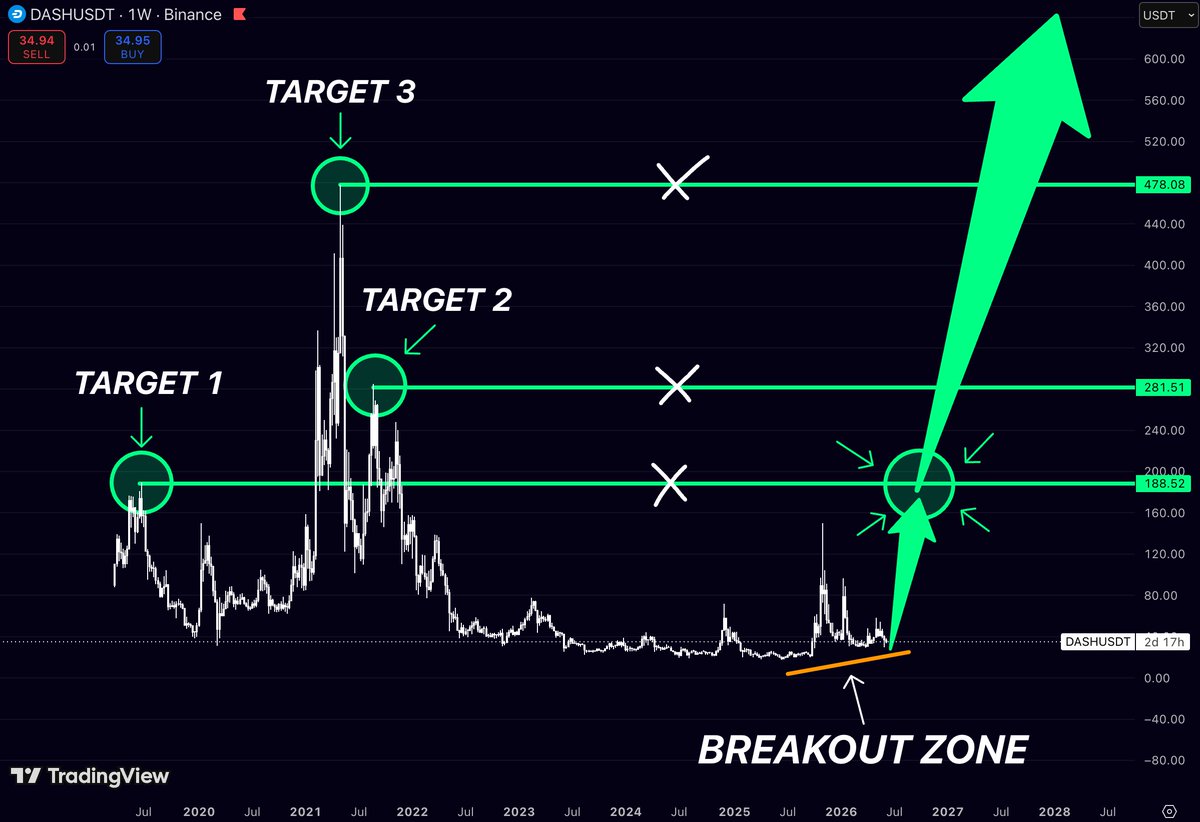
$DASH might be one of the most overlooked charts in the market right now
After years of grinding near the lows
price is pressing against a long-term breakout zone that previously acted as a major turning point
The key levels on the chart are clear:
🎯 $188 - major historical resistance
🎯 $281 - next macro target
🎯 $478 - cycle high target
What’s interesting is that $DASH is still trading massively below its previous cycle highs despite spending years building a base
A clean move through the $188 region would completely change the market structure and open the door for a much larger expansion
The longer an asset consolidates near the bottom, the more violent the breakout tends to be
$DASH looks like a classic compression-to-expansion setup
7
5
48
1,542
$WLD still looks like one of the most asymmetric setups in the market
After a brutal drawdown from the launch highs
price has spent years grinding lower and flushing out almost everyone who bought the narrative
Now the chart is sitting near historical lows while several major levels remain untouched above:
📍 $2.12 - critical level
📍 $4.18 - major breakout zone
📍 $11.94 - macro target
What’s interesting is that every previous rally stalled around these exact areas
That’s why they matter
The market doesn’t need new highs tomorrow
It only needs to start reclaiming old territory
And if $WLD starts taking back levels one by one
the upside becomes a lot larger than most people currently expect
3
12
900
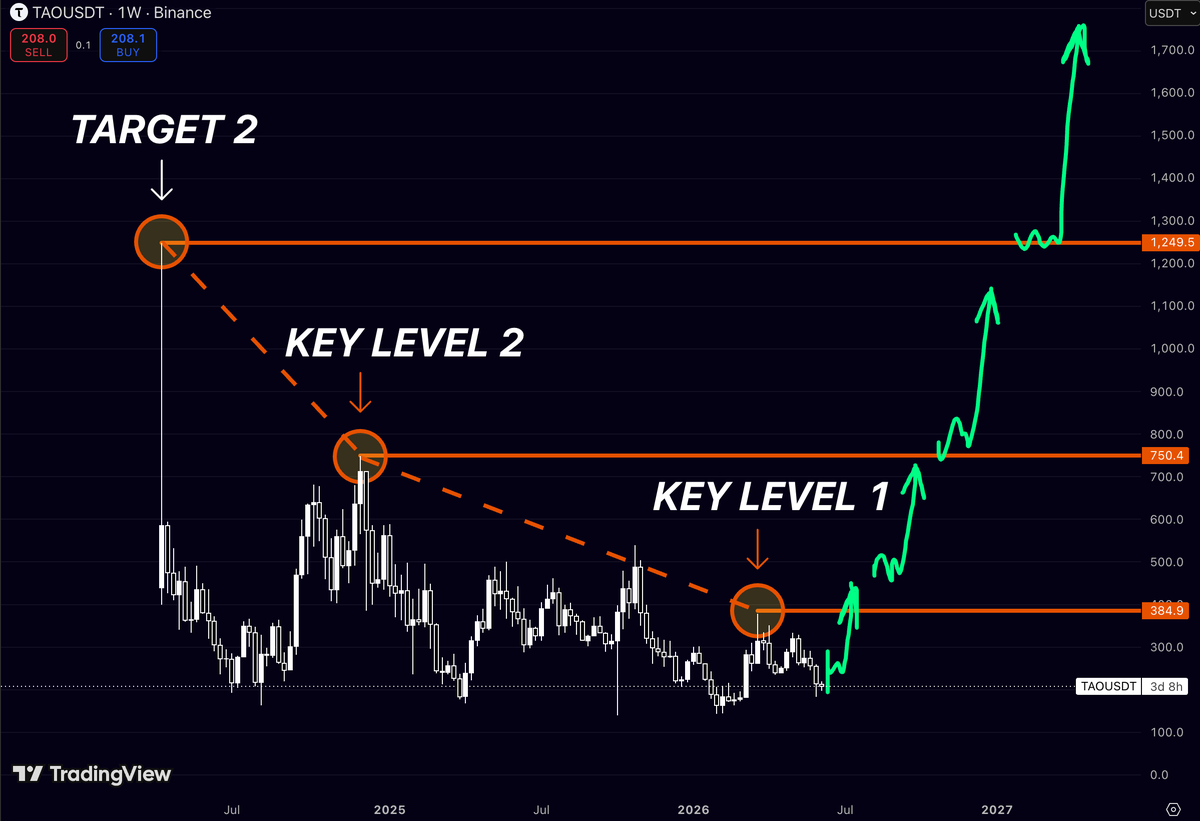
$TAO doesn’t need a new ATH to make a lot of people rich.
It just needs to revisit levels it has already traded at before.
The chart is pretty straightforward:
📍 $385 - first major resistance
📍 $750 - previous distribution zone
📍 $1,250 - cycle target
What’s interesting is where price sits today
After months of chopping around and shaking out both bulls and bears
$TAO is still holding far below levels that were accepted by the market multiple times during the last cycle.
Most traders are focused on the next 10-20%.
I’m looking at the bigger picture.
A move back to $385 is one thing.
A move back to $750 changes the entire narrative.
And if AI remains one of the strongest sectors this cycle, the market will eventually start asking whether $1,250 is really that far away.
$TAO remains one of the charts I’m watching closely
1
3
9
340
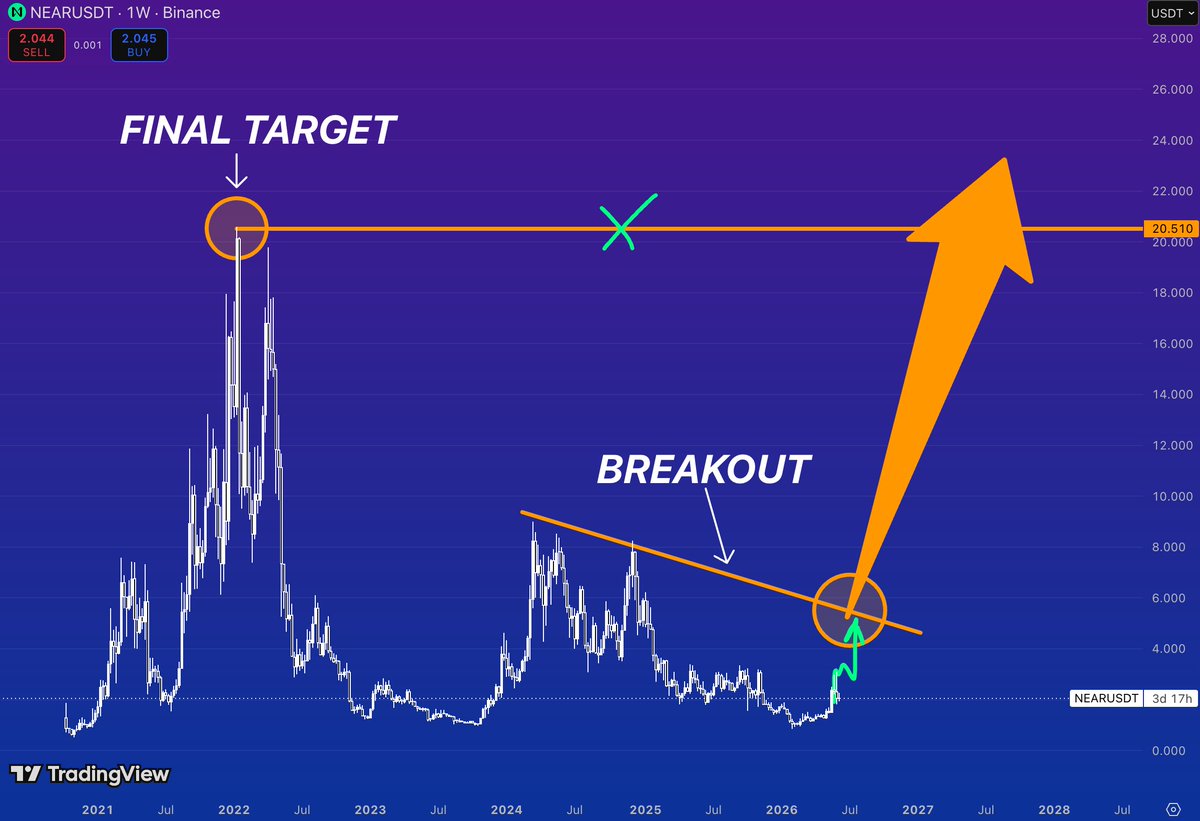
$NEAR looks even better on this version of the chart
The setup isn’t about reclaiming old highs
It’s about breaking a multi-year downtrend that’s been suppressing every rally since 2024
📍 The breakout zone sits around $5-6
That’s where the descending resistance intersects with current price action
And here’s why it’s interesting:
Every major $NEAR rally over the last two years died at a lower high
Sellers kept stepping in earlier and earlier
Now price is approaching the exact point where that structure finally breaks
Once that trendline is gone, the chart becomes surprisingly empty
The next major historical level isn’t $8
It isn’t $10
It’s the old cycle supply zone near $20.5
That’s what makes this setup attractive
You’re not looking at a coin trying to recover from a local correction
You’re looking at a chart attempting to end a multi-year bearish structure
Most traders will wait for confirmation
The market usually doesn’t reward that
By the time everyone agrees the trend is broken
$NEAR is often already trading multiples above the breakout level
The chart spent two years compressing volatility
Those periods tend to be followed by expansion
And if that orange trendline finally gives way
$20 stops looking like a moonboy target and starts looking like the next major liquidity magnet
4
63
2,619
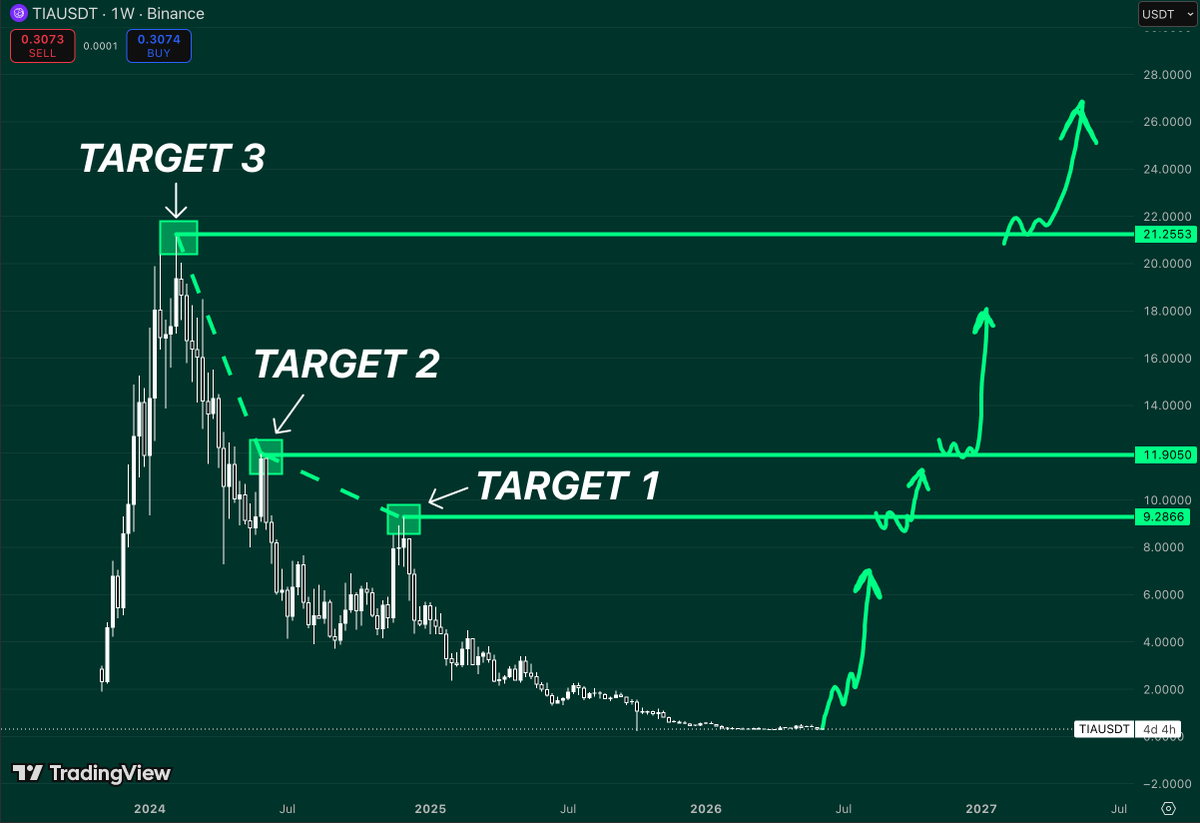
$TIA is one of those charts that looks completely dead until you zoom out
From the 2024 highs, it has done nothing but bleed lower
Every bounce got sold
Every recovery attempt failed
Now look where price sits
Right at the area where nobody wants it anymore
That’s usually when things get interesting
The chart is basically mapping out three major levels the market respected on the way down:
🎯 $9.3
🎯 $11.9
🎯 $21.3
And here’s what stands out to me:
Those aren’t random targets
They’re former support zones that eventually turned into resistance as the trend collapsed
If $TIA ever starts reclaiming those levels, the narrative changes fast
First people call it a dead-cat bounce
Then it reaches $9 and everyone starts checking the chart again
Above $12, sidelined money begins chasing
And if $21 gets reclaimed, you’re looking at a completely different market structure than the one we’ve had for the past year
The biggest mistake traders make is assuming a chart that fell 90% can’t become a leader again
History says the opposite
Some of the strongest performers of every cycle are the coins that spent the longest time being ignored
$TIA doesn’t need a miracle
It just needs buyers to start taking back old territory one level at a time
And from current levels, that’s a lot of territory
3
10
1,022
$RENDER keeps doing something very few charts can claim
It keeps printing higher cycle highs
Look at the timing
ATH 1 ➜ ATH 2 took roughly 122 days
Now we’re sitting about 122 days from the last major cycle low again
Coincidence?
Maybe
But markets love repeating structures until they don’t
What’s even more interesting is that $RENDER isn’t trying to recover old highs from years ago
Its previous cycle high sits around the $14 zone
A new all-time high would put it near $21
That’s another ~14x move from current prices
Most traders spend their time hunting for the next narrative
$RENDER is already one of the strongest AI charts in the market
If the AI sector gets another major rotation, this is exactly the type of chart that can start moving much faster than people expect

2
8
420
$CHZ HAS BEEN DEAD FOR YEARS
That’s exactly why this chart is interesting
Most people only remember the 2021 hype
What they don’t see is that $CHZ has spent almost 4 years bleeding lower, building one of the longest accumulation structures in the market
Now compare where price sits today to the major rejection levels that defined the entire downtrend
The first meaningful target is around $0.14
Above that sits $0.29
And if a full altseason rotation returns, the final major level from the previous cycle comes in near $0.65
From current prices, that’s roughly:
Target 1 → 400%
Target 2 → 900%
Target 3 → 2200%
Nobody cares about $CHZ right now
That’s usually when the best risk/reward setups start forming

1
3
13
1,108
$ZEC is one of those charts that nobody wants to talk about until it’s already gone
Everyone is focused on the recent rally
but the real story is the structure
For months, $300 acted as the floor
Price revisited it, reacted exactly where it should, and launched
Now there’s only one major level left above
The 2021 cycle high around $750
That’s nearly 70% higher from here
What’s interesting is that $ZEC isn’t trying to reclaim old resistance anymore
It already did that
The market spent months building a base above support
absorbed supply, and is now trading in the middle of a historical vacuum with very little structure overhead
If momentum continues, the path toward the previous cycle high is surprisingly clean
$300 was the test
$750 is the target

3
10
44
4,752
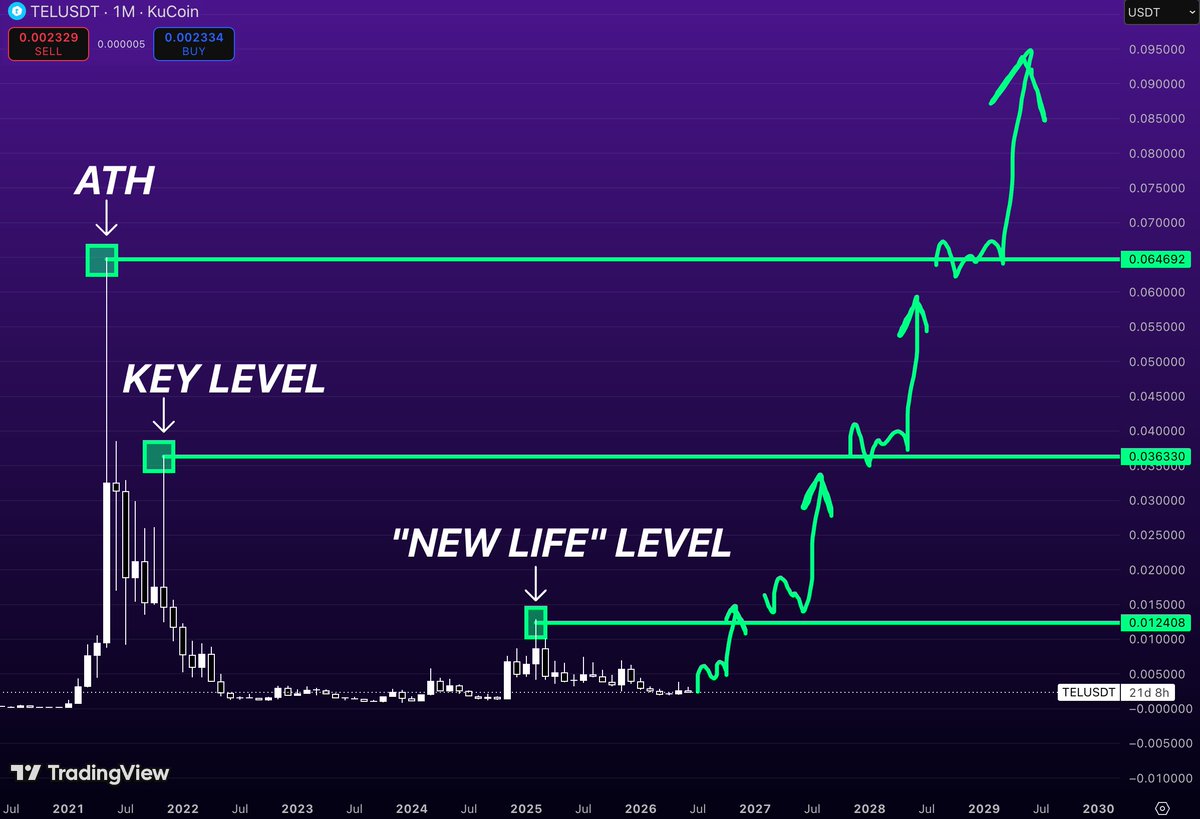
$TEL is trading 96% below its all-time high
Most people see a dead chart
I see three levels that have controlled every major move for the last five years
The first sits at $0.012
The second at $0.036
The final one is the all-time high around $0.065
None of them have been reclaimed yet
That’s the point
When an asset spends years building a base near cycle lows
the biggest percentage moves happen before most investors start paying attention
Right now, $TEL is still trading beneath every major historical resistance
If buyers can reclaim the first level, the chart opens toward the second
If the second falls, the market starts looking at the ATH again
The roadmap is simple
The execution is not
3
267