
Primara Research is an independent Australian research and data firm.
Joined August 2025
- Tweets 29
- Following 42
- Followers 9
- Likes 3
21 Photos and videos


Analysis conducted for Fishbowl Inventory by Primara Research.
83% of Australians shopping EOFY sales this year are doing so specifically to manage cost-of-living pressure. This finding signals a fundamental shift in consumer behaviour—the sales event is no longer discretionary entertainment but a necessary financial tool.
Our analysis of 1,002 nationally representative Australians reveals that two thirds (66.7%) plan to participate in EOFY sales in 2026. What's significant is not just the participation rate, but the motivation. The overwhelming majority cite discounts as essential to their household budgeting, not optional.
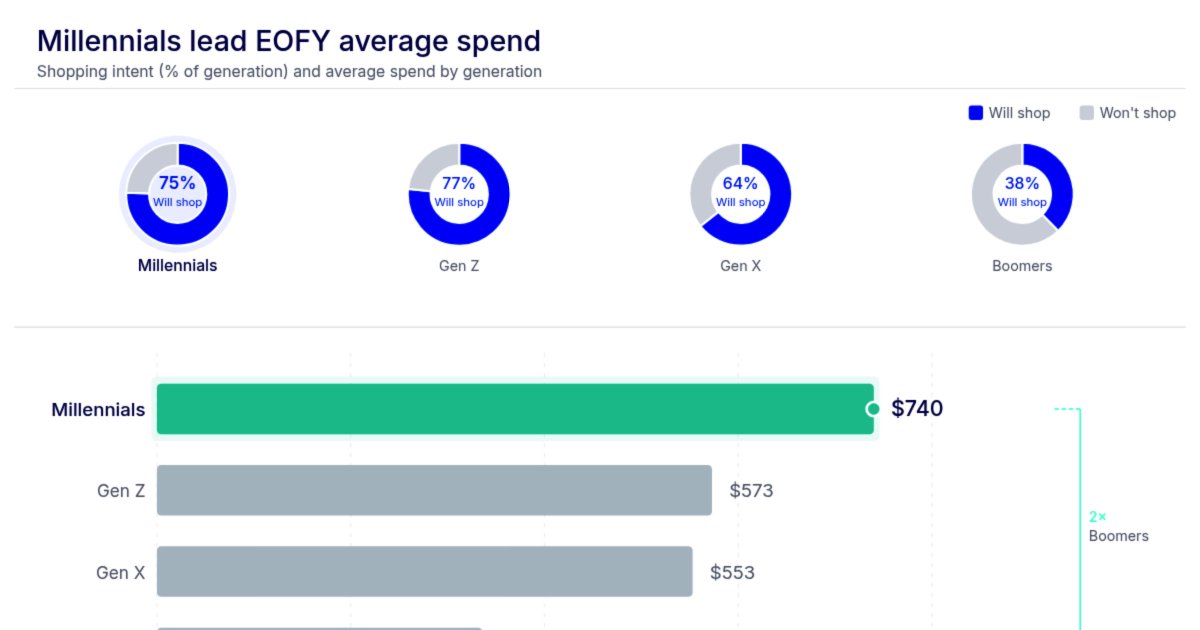
Millennials are driving this event disproportionately. Despite comprising a smaller share of the population, this generation will account for an estimated 44% of total EOFY spend. At $740 per person, Millennials outspend every other age group by a considerable margin. More importantly, nearly three in ten Millennial shoppers (28.3%) have deliberately timed large purchases around the EOFY window. Of these, 15.2% expect to spend over $1,000. This is not opportunistic bargain hunting—it's deliberate financial strategy.
Geographic variation reflects housing affordability pressures. NSW, home to Australia's most unaffordable property market, leads participation at 72.3%, ahead of Victoria (65.3%) and Western Australia (61.7%). NSW also records the highest average spend at $664 per person. Urban shoppers spend 34% more than their regional counterparts ($647 versus $482 per person), suggesting city-based cost-of-living pressures are more acute and driving compensatory purchasing behaviour.
The structural implication is clear: retailers whose product categories align with Millennial priorities—electronics, homewares, fashion—are positioned to capture the bulk of EOFY spend. Inventory management, promotional strategy and category selection should reflect where foot traffic will concentrate. This cohort isn't browsing; they're executing pre-planned purchases within a constrained window.
The data was collected in May 2026 via a nationally representative survey. What emerges is a portrait of financially pressured consumers using EOFY sales not as entertainment but as infrastructure for household budgeting. Retail participation will follow economic necessity, not impulse.
18
Analysis conducted for Fishbowl Inventory by Primara Research.
Australians are set to spend an estimated $7.96 billion this End of Financial Year, with Millennials driving 44% of the total spend. This finding emerges from a nationally representative survey of 1,002 Australians conducted in May 2026. The average shopper expects to spend $601, but Millennials are leading at $740 per person, and around 1 in 7 (15.2%) plan to spend over $1,000.
What's driving this spending? Cost-of-living pressure is the primary motivator, cited by 82.7% of shoppers as their reason for seeking out discounts. This reveals a fundamental shift in consumer behaviour: rather than reactive, impulse-driven shopping, Australians are increasingly planning their purchases around known sale windows. Two-thirds (66.7%) of respondents plan to shop the EOFY sales specifically.
The behaviour runs deeper still. Our analysis shows that 28.3% of Millennial shoppers have large purchases already planned and are deliberately holding off for the EOFY window. This is not spontaneous consumption—it's calculated and forecastable demand concentrated into a compressed timeframe. Cost-of-living pressures are training consumers to be deliberate, which means the demand signal itself is becoming cleaner and more predictable over time.
Geographically, the opportunity is unevenly distributed. NSW leads participation at 72.3%, well ahead of Victoria (65.3%), Western Australia (61.7%), and remaining states (60%). NSW also records the highest average spend at $664 per person. Within states, city shoppers spend 34% more than regional counterparts ($647 versus $482), pointing clearly to where concentrated demand will flow.
Our analysis of ABS household spending data identifies transport, clothing/footwear, and furnishings/household goods as the key opportunity categories. Transport is the standout performer, running 4% above even November/December levels—a pattern consistent with the established EOFY effect in car and dealership sales. In 2025, clothing and furnishings ran 8.9% and 6.3% above monthly averages respectively. While EOFY remains secondary to the Christmas peak, it is increasingly a deliberate, strategically timed window where consumers actively defer purchases.
For retailers, the implication is clear: EOFY is no longer just a clearance event. Consumer behaviour is shifting toward planned, discount-driven purchasing. Businesses that capture this $8 billion opportunity will be those with the right stock, at the right price, on both sides of 30 June. The onus is on retailers to be just as deliberate as the consumers they serve.
20

Jun 11
Analysis conducted for [Ourtop10.com.au](ourtop10.com.au) by Primara Research.
The ACT budget announcement this week abolishing stamp duty for all first home buyers represents the culmination of a decade of reform that has fundamentally altered the state's housing economics. Our analysis of the latest ABS data reveals a jurisdiction moving counter to national trends—and the implications are significant.
Stamp duty growth in the ACT sits at just 15% over the past decade. The national average is 67%. That gap—52 percentage points—reflects a deliberate policy choice to remove friction from the transaction, and it's working. Despite holding the third highest median house price in the country at $1,071,000, the average ACT buyer pays only $38,399 in stamp duty. Nationally, that figure reaches $61,714. The structural advantage is measurable and compounding.
The prior concession scheme capped relief at $1,020,000, creating a cliff edge $51,000 below the median. This meant most first home buyers approaching the median couldn't access relief on the final portion of their purchase. From July, that ceiling disappears. Every first home buyer now pays zero duty, regardless of price or income. This changes the buying calculus entirely—more savings flexibility, clearer timing decisions, genuine choice on location.
Supply-side performance underscores the policy's coherence. The ACT sits just 1% behind its population-weighted housing target. Victoria trails at 7%. The national average languishes 25% behind, with NSW 39% adrift. Reducing transaction costs alone doesn't solve supply constraints, but it removes a demand-side barrier that compounds them. Fewer buyers priced out means market signals function more clearly.
Price growth itself tells a story. Over a decade, ACT median values have risen 82%—significant, but ranking only 11th of 15 markets nationally. The state has achieved higher relative affordability not through suppressed demand, but through policy architecture that makes buying viable. First home buyers aren't chasing threshold-compliant properties; they're pursuing homes suitable for families.
The data raises a direct question for other jurisdictions: stamp duty reform works in the ACT context because it's embedded within coherent supply and demand settings. South Australia, Tasmania and Western Australia have followed similar trajectories. NSW and Victoria, larger markets with greater supply constraints, face structural challenges stamp duty reform alone cannot solve. But the ACT demonstrates the principle: remove the tax barrier, and buyer behaviour shifts toward genuine choice rather than threshold optimisation.
We analysed dwelling values and taxation revenue data against population-weighted housing targets across all jurisdictions. The pattern is clear. The ACT blueprint isn't theoretical—it's delivering measurable outcomes on affordability, supply performance and buyer flexibility.
14
Jun 11
Analysis conducted for the client by Primara Research.
Australians are willing to pay an average of $17,380 more for a property with a backyard shed. That figure alone understates what our analysis reveals: 79% of buyers are prepared to pay a premium, and one in four will exceed asking price by at least $20,000. This isn't marginal preference — it's market demand with measurable financial weight.
Geography shapes willingness substantially. Queensland buyers lead at $18,200, with NSW at $18,006 and WA at $17,944, while southern states cluster noticeably lower. The pattern is clear: outdoor lifestyle and climate drive valuation. Buyers in warmer states with established outdoor culture place higher premiums on covered backyard infrastructure. WA leads on extreme willingness to pay, with 29% of buyers prepared to go $20,000 or more above asking, compared to 26.7% in NSW.
Purpose transforms value dramatically. Sheds designated for workshop use command $25,248 premium — nearly $8,000 above the national average. One in five workshop-focused buyers are willing to exceed asking by more than $30,000. This distinction matters: a shed with functional clarity commands significantly more than storage-only infrastructure. Buyers are valuing capability and utility, not just additional footprint.
Generational and locational factors converge in ways that expose underlying affordability pressures. Millennials value sheds most, paying an average of $19,239 more — over $2,000 above any other age group, with nearly 30% willing to pay $20,000 or more. City buyers similarly pay $2,000 above regional counterparts. Both patterns reflect the same structural reality: where space is scarce and housing costs are highest, a backyard shed becomes not a discretionary amenity but a practical solution to undersized homes and insufficient internal storage.
This generation hasn't chosen smaller footprints by preference — affordability has forced the decision. A shed becomes the overflow that a smaller home cannot provide. It solves tangible problems: workshop space, storage, hobby room, home office expansion. That's why the premium climbs so sharply among younger buyers and urban purchasers. The market is pricing in real utility value to compensate for constrained living space.
The structural implication is significant. As housing affordability pressures persist, backyard infrastructure moves from luxury to necessity in buyer calculations. Developers and vendors underestimating this trend are leaving material equity unrealised. For younger urban buyers in particular, a quality shed isn't a nice-to-have — it's become essential to making smaller homes liveable.
1
1
17
Jun 11
Analysis conducted for Credit24 by Primara Research using ABS Monthly Household Spending Indicator data.
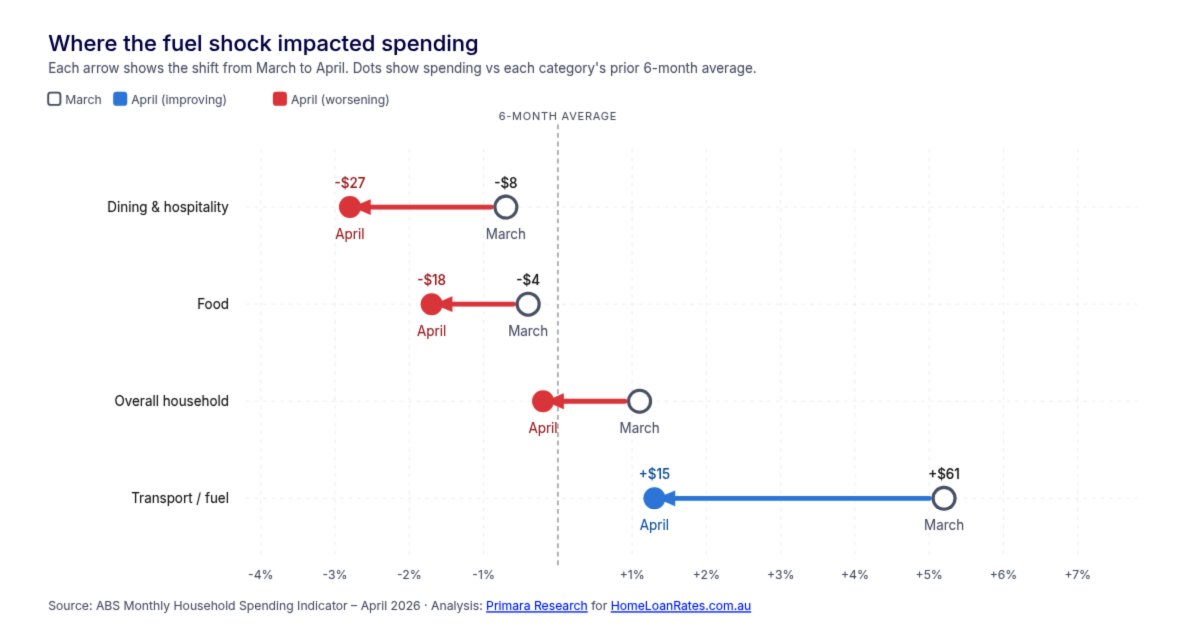
Australia's fuel spike has added $836 million to the national transport bill across March and April, translating to $76 per household. But the headline cost masks a more urgent finding: households are cutting back on food and dining to absorb the shock, revealing they have virtually no financial buffer.
Our analysis of ABS household spending data shows food spending fell 1.7% below trend in April, while hotels, cafes and restaurants spending dropped 2.8% below expected levels. In dollar terms, the average Australian household spent $18 less on groceries and $27 less on dining than anticipated in April alone. Annualised, that represents more than $500 in reduced spending across these two categories.
That food spending is contracting at all is the critical signal here. Groceries are an essential item, but unlike fuel, they're not a fixed cost—households can trade down in quality or switch brands. The fact that Australians are doing so points to something fundamental: a significant share of households are running close to break-even, where an expense up in one area requires an expense down in another.
The broader spending picture reinforces this stress. Overall household spending swung from 1.1% above trend in March to 0.2% below in April. Excluding transport, spending growth was 4.9% in April, the lowest in a year. Real spend growth—total spending measured against inflation—was just 0.65% in April, the lowest recorded over the past year. In November it stood at 2.45%, representing a 73% decline in real purchasing momentum in just six months.
This collapse in real purchasing power reflects the compounding weight of cash rate rises and, more recently, the fuel crisis hitting simultaneously. Australian households were already absorbing rising costs due to inflation. The fuel spike proved sharp enough to force additional cutbacks on top of that burden. When dining and grocery spending fall below their own growth trends, it tells you there isn't a financial buffer. The money has to come from somewhere, and households are making difficult trade-offs in response.
1
27
Jun 10
Analysis conducted for homeloanrates.com.au by Primara Research.
Sydney's median house price has fallen $75,000 in the March 2026 quarter, dropping from $1.56m to $1.485m. This marks the second-largest nominal quarterly decline ever recorded, surpassed only by a $100,000 fall in September 2017. The quarterly percentage fall of 4.8% is the largest in seven years—a stark reversal from earlier growth phases.
What's driving this contraction is unambiguous: demand, not supply. House sales fell 39% in the quarter, with annual house sales down 21.6%. Apartment sales followed suit, declining 28.2% quarterly and 9% annually. Prices are compressing because buyers have withdrawn from the market, not because new dwellings are flooding supply.
NSW dwelling stock growth remains at 1.42% annually, sitting below the national average. This gap, which was even wider seven quarters ago, has only recently begun to narrow. Supply is not the relief valve in this market—demand contraction is the defining dynamic.
Two cash rate rises landed in the first quarter, with the second occurring on 18 March. Because of timing, its full economic effect won't materialise until Q2. A third rate rise in May indicates that further price softening and subdued sales activity are probable in the months ahead.
Yet a crucial uncertainty looms. Some major banks are now forecasting rate cuts rather than further increases. If that scenario materialises, the demand that has exited the Sydney market could return quickly and substantially. A $75,000 price drop, viewed through that lens, transitions from a warning signal to a genuine market window—a moment when buyers re-enter at lower entry points.
Our analysis used publicly available data. The market stands at an inflection point. Two rate rises are still working through the system, a third is imminent, and the policy direction beyond May remains genuinely uncertain. What happens next depends on decisions that haven't yet been made.
1
1
37
May 28
Analysis conducted for homeloanrates.com.au by Primara Research.
Australia faces a stark housing completion challenge. New analysis reveals the government's 1.2 million homes target by mid-2029 is on track to fall short by 305,183 dwellings—nearly one in four of the promised supply. The numbers expose a structural problem that transcends overall capacity constraints.
Since the National Housing Accord launched, Australia has completed 268,445 homes across 18 months. That's an average of 44,741 completions per quarter. To meet the 1.2 million target, we need to build 931,555 homes in the remaining three and a half years—requiring 66,540 completions per quarter. The gap is substantial: an additional 21,799 homes per quarter, or 7,266 per month, above current delivery rates. In percentage terms, completions must lift by 49%.
The state-by-state breakdown reveals where the problem concentrates. Victoria, representing 26% of the national population, is contributing 32% of all completions and sits just 8% behind its population-weighted target. The ACT is essentially on track, with a shortfall of only nine dwellings. These results demonstrate that scaling housing delivery is achievable within Australia's federal system.
NSW tells the opposite story. With 31% of Australia's population, the state accounts for only 26% of completions and runs 39% behind its target. This single state contributes an estimated 7,192 of the 14,914 additional homes needed monthly—roughly half the national shortfall. Queensland (31% behind target), Tasmania (50% behind) and the Northern Territory (81% behind) compound the problem across growth and regional states.
The analysis uses the latest ABS Building Activity and population data, providing a clear baseline against which current performance can be measured. The findings suggest the target remains achievable only if underperforming states dramatically accelerate delivery. Without intervention—whether regulatory reform, infrastructure investment or planning acceleration—structural barriers will persist.
Victoria and the ACT demonstrate the target is not impossible. But until NSW and the growth states close their gaps, the national ambition will remain out of reach.
1
1
17
May 28
Analysis conducted for Money.com.au by Primara Research.
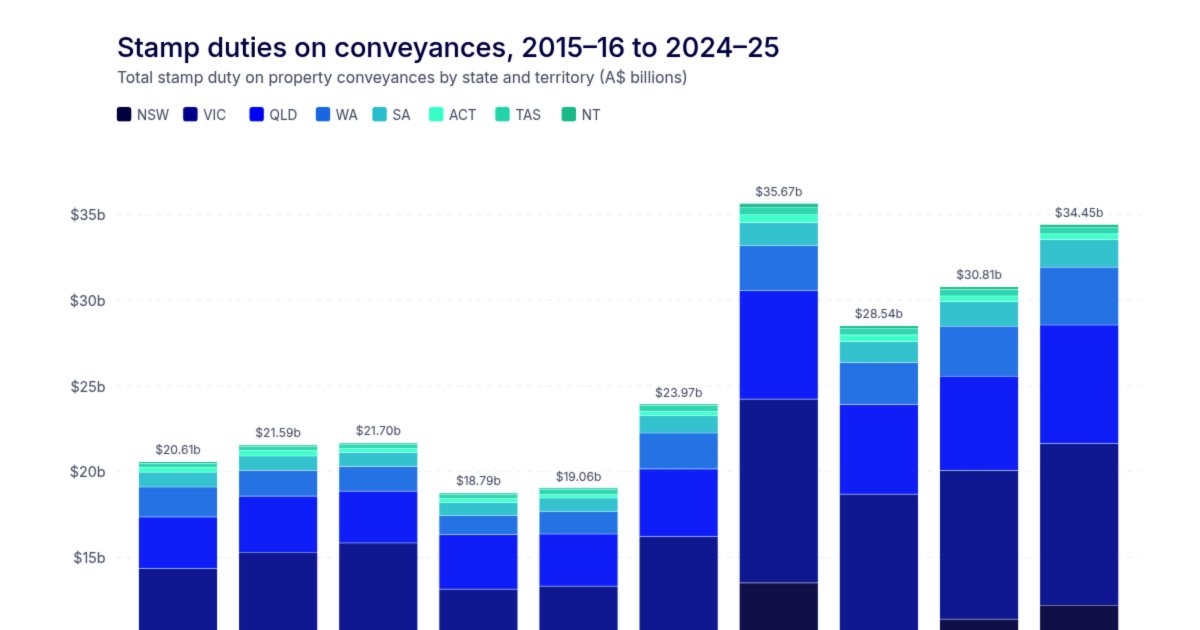
Australian governments collected $34.4 billion in stamp duty in 2024/25 — nearly double the $18.8 billion collected in 2018/19, the last full pre-Covid financial year. We analysed the latest ABS taxation revenue data and uncovered a striking pattern: governments are reaping substantial windfalls not from increased property sales, but from rising property prices alone.
The disconnect between transaction volumes and tax receipts is stark. Our analysis shows stamp duty revenue rose 12% in a single year despite property sales volumes rising just 5%. This reveals how the tax is structurally designed to grow faster than the market itself.
The gap is most visible in Western Australia and South Australia. WA's stamp duty revenue rose 29% over three years despite property sales declining 3% over the same period. South Australia recorded 19% revenue growth over three years on sales that are down 11% from their peak. In both cases, rising prices are entirely responsible for revenue growth.
We calculated average stamp duty paid per transaction across all states using ABS revenue and transfer data. The figures are substantial: the average Australian buyer paid $61,714 in stamp duty in 2024/25. NSW leads at $73,855 per transaction, followed by WA at $63,860 and Victoria at $62,355. Even lower-priced markets like Tasmania ($31,852) and the ACT ($38,399) show significant per-transaction burdens.
The progressive nature of stamp duty compounds the effect. A Sydney buyer purchasing an established home at the median property price of $1.52 million faces a stamp duty bill of $65,963. At double the median price of $3.04 million, that bill rises to $149,563 — a 126% increase on a 100% rise in price. As property values climb, buyers are pushed into higher tax brackets where a greater percentage applies to every dollar above each threshold.
This means governments benefit disproportionately every time prices rise. Stamp duty revenue has nearly doubled in six years. The progressive bracket structure ensures that as prices accelerate, the effective tax rate increases, so the tax bill grows faster than the price tag. Buyers aren't just paying more because homes cost more. They're being pushed into higher brackets, amplifying the burden with each price increase.
1
14
May 26
Analysis conducted for Fishbowl Inventory by Primara Research using ABS Business Conditions data.
18.6% of Australian businesses remain caught in supply chain disruptions, with new research pointing to consumer price rises still to come. This finding matters because it reveals a structural shift: the cost buffer that has protected Australian households is approaching its limit.
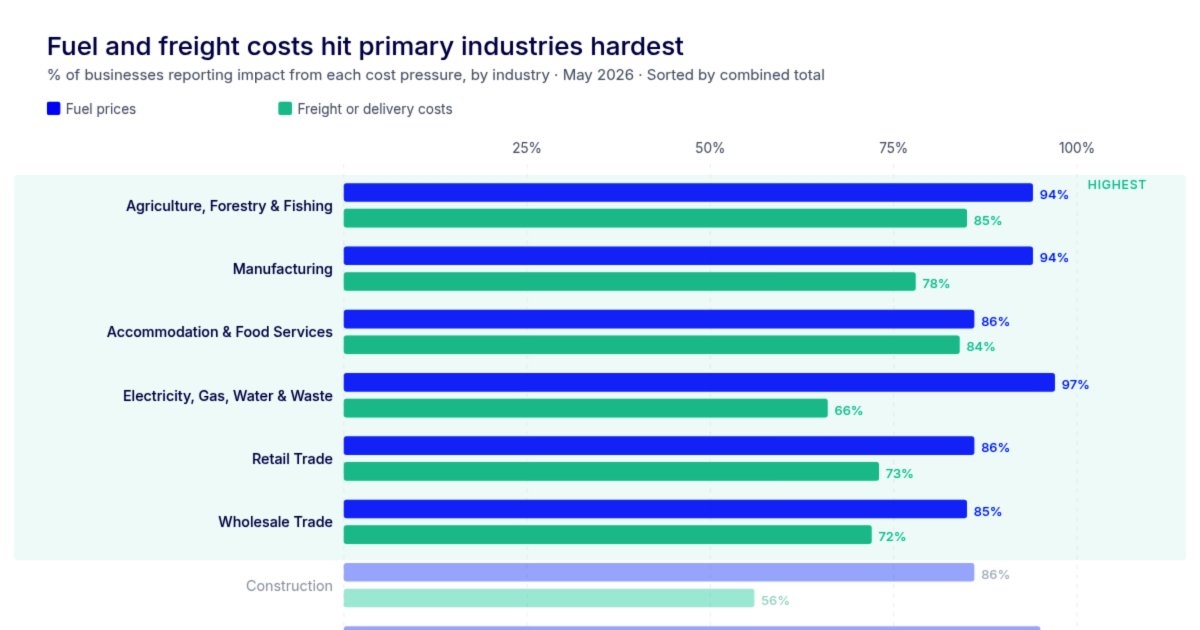
Our analysis of May 2026 data shows disruption is not evenly distributed. Agriculture leads all sectors at 42%—more than double the national average—with Retail Trade at 31%. The pressure originates upstream. Across Agriculture, Manufacturing, Wholesale Trade, Accommodation and Food Services, and Retail Trade, more than 85% of businesses report fuel price impacts. Freight and delivery costs compound the burden at every stage.
The dual burden in primary and secondary industries is particularly acute. Agriculture and manufacturing are simultaneously carrying 90%-plus fuel cost exposure and 80%-plus freight cost exposure. These are not sequential pressures that businesses can manage in sequence. They are parallel drains on margin.
Here is what distinguishes this moment: only 11% of businesses have raised prices so far. A further 48% are absorbing costs entirely, meaning just 20% of the true cost burden has reached consumers. Australian households have been insulated from the full impact of upstream inflation by business margin compression. That compression has operated as an effective buffer.
The data indicates this buffer is running out. Revenue has already declined for 36% of businesses over the past four weeks. Among wholesalers, the figure reaches 53%. More telling: 53% of wholesalers expect revenue to fall again next month. This is not stabilisation. This is cascading pressure through the supply chain.
The structural implication is clear. Businesses cannot indefinitely absorb costs that erode margin. At the Agriculture and Manufacturing level, where fuel represents 90%-plus of exposure and freight 80%-plus, the mathematics become untenable. Those costs must transfer. The only question is timing and magnitude.
Our analysis suggests the price adjustment cycle—delayed but inevitable—is now in its final staging phase. The 48% of businesses currently absorbing costs have acted as a circuit breaker for consumer price inflation. That mechanism has a breaking point. When it breaks, the full accumulated cost burden will move forward in the supply chain to consumers.
1
24
May 22
Most businesses collect data. Very few know how to turn it into authority.
Primara Research transforms research into media-worthy insights that build trust, visibility, and industry positioning.
The future belongs to brands that become the source.
12
May 22
Smart companies don’t guess. They research.
Primara Research helps brands uncover the insights hiding inside complex data, market behavior, and consumer trends.
Because the companies that understand the market first usually win first. 📊
12
May 15
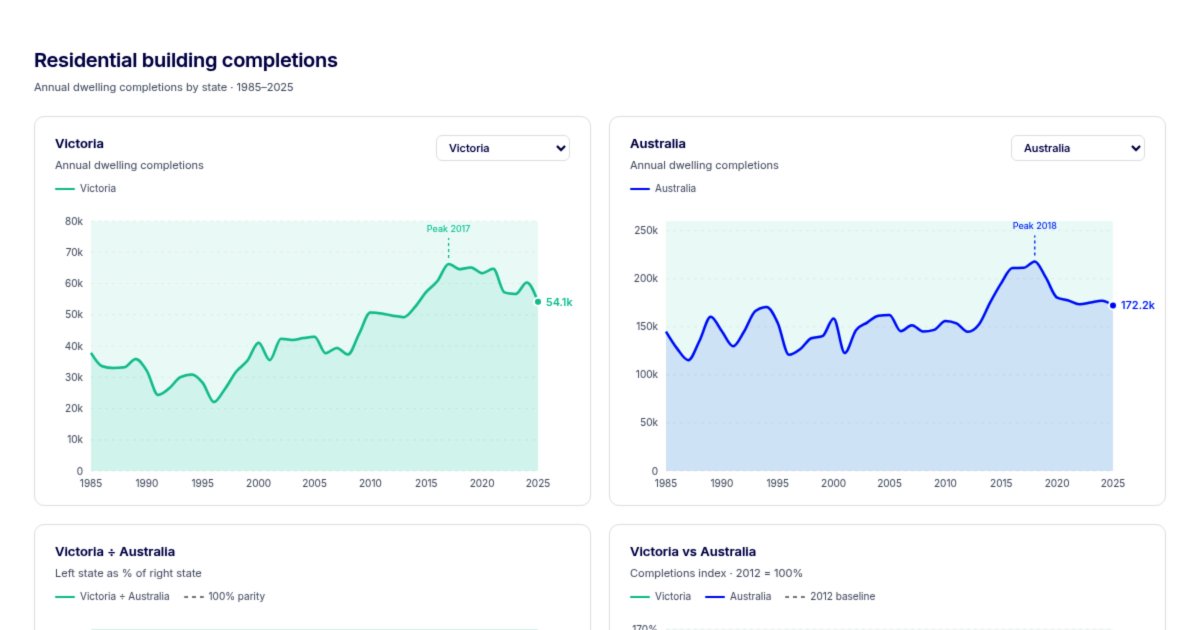
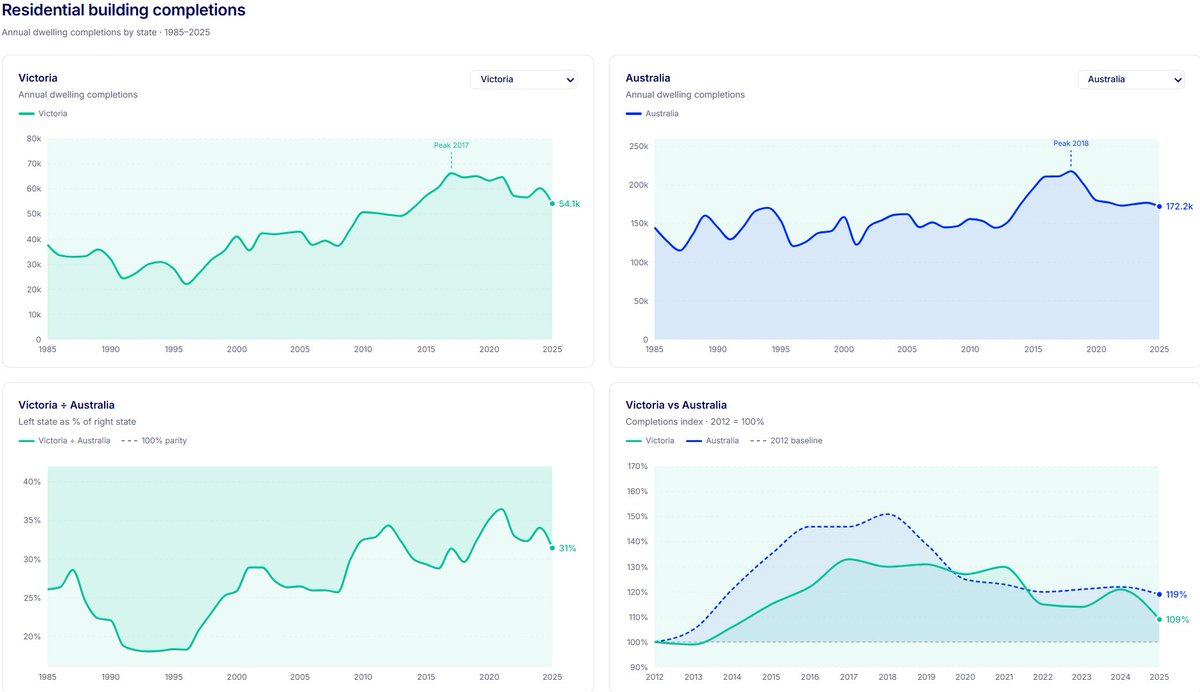
Australia's dwelling completions fell to 172,246 in 2025, marking the lowest annual total since 2012. On the surface, this looks like a straightforward slowdown. Dig deeper, and the picture fragments into two distinct crises requiring entirely different responses.
We analysed publicly available completion data from all states and territories to understand where the losses occurred and what they signal. The headline decline of 2.7% year-on-year—a loss of 4,857 dwellings—masks profound regional divergence that matters enormously for housing policy and market dynamics.
Victoria single-handedly accounts for a completion decline larger than the entire national shortfall. The state shed 6,181 dwellings, a 10.2% contraction to its lowest level since 2013. At 31% of national completions, Victoria's collapse carries disproportionate structural weight. NSW also deteriorated, recording its 13-year low at 44,922 completions, down 247 year-on-year. These are the east coast's largest economies building less, not more.
But Queensland and Western Australia present the inverse problem. Queensland added 1,189 completions ( 3.8%) to reach 32,796, its 1-year high. WA completed 20,545 dwellings, essentially flat year-on-year but recording a 3-year low. Both states are recording positive net internal migration—residents actively choosing to relocate for lifestyle and affordability. Yet neither can build fast enough to absorb population inflows. Queensland faces a dwelling deficit of 6,354 against population growth. WA's shortfall reaches 5,949. These are the states Australia's population wants to move to, and both are losing the race between construction and demand.
Nationally, completions exceeded household growth by just 4,499 dwellings—a marginal 0.04% increase against 11.45 million total households. Supply is growing, technically, but at a pace that cannot resolve affordability pressure or accessibility concerns.
The structural implication is clear: Australia's housing crisis is not monolithic. Victoria requires stabilisation and policy recalibration to restore confidence and pipeline momentum. Queensland and WA require acceleration past current completion rates simply to stand still against migration pressure. One state is slowing its construction. Two states are building faster but still falling behind demand they themselves attract.
These trends will determine housing policy priorities through 2026 and beyond. Without material acceleration in Queensland and WA—and stabilisation in Victoria—the divergence between supply and demand will only sharpen.
1
1
38
May 14
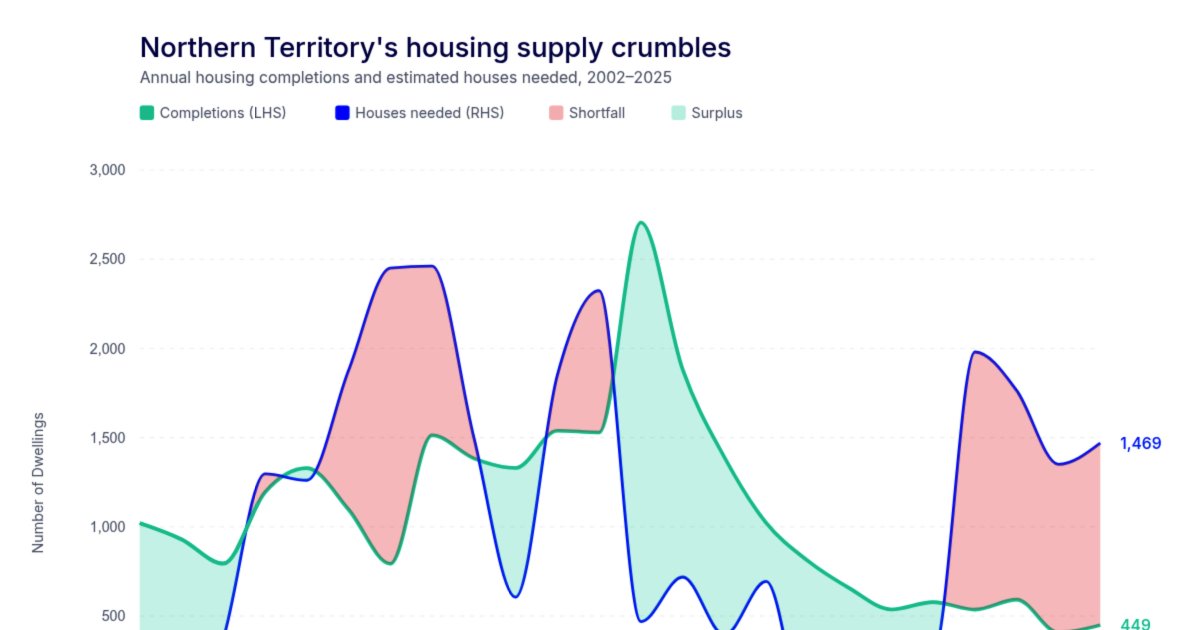
The Northern Territory delivered just 449 homes in 2025, falling 69% short of what population growth required. This marks the second consecutive year completions have dropped below 500—a threshold breached only twice in 50 years. For a territory of NT's size, this represents a critical failure of housing supply to keep pace with demographic demand.
We analysed population and housing data to understand the scale of the problem. NT's population grew by 3,672 people over the past year, a figure that typically demands around 1,469 new dwellings. Instead, the market delivered 449. That 1,020-dwelling shortfall exceeds 1% of the existing housing stock—a significant structural imbalance in a jurisdiction of NT's scale.
The broader context is severe. NT's housing completions have collapsed 83% from their 2014 peak of 2,706 dwellings, the steepest decline of any state or territory. Other residential completions—units, apartments, townhouses—hit a 55-year low at just 55 dwellings, leaving detached houses as the only meaningful source of new supply. Meanwhile, NT represents 1% of Australia's population but accounts for just 0.36% of national house completions.
Costs tell part of the story. Building a house in NT has risen 34% over five years, below the national increase of 43%, yet construction remains more expensive than Queensland, South Australia, Western Australia and Tasmania. This is a legacy of NT's position as Australia's most expensive building market as recently as 2016. Costs have converged with other states, but they haven't fallen—a persistent headwind for builders deciding where to allocate capital.
Demand structure explains the deeper problem. NT records the lowest proportion of owner-occupier loans of any state or territory. For those who do purchase, the average loan of $492,800 translates to $2,857 per month at current minimum rates. This pattern points to a transient population that rents rather than buys. Without a stable base of owner-occupier demand, investors must justify construction through strong yields—a difficult case in a small, remote market with thin margins.
The result is a market failure on both demand fronts. Neither owner-occupiers nor investors constitute a large enough pool to trigger construction at meaningful scale. Population growth should signal new housing need and trigger supply response, but that mechanism has broken down. Our analysis indicates this reflects an affordability problem with few levers for resolution in the current economic environment. Unless structural conditions shift materially, NT's housing deficit will continue to widen.
1
1
31
May 14
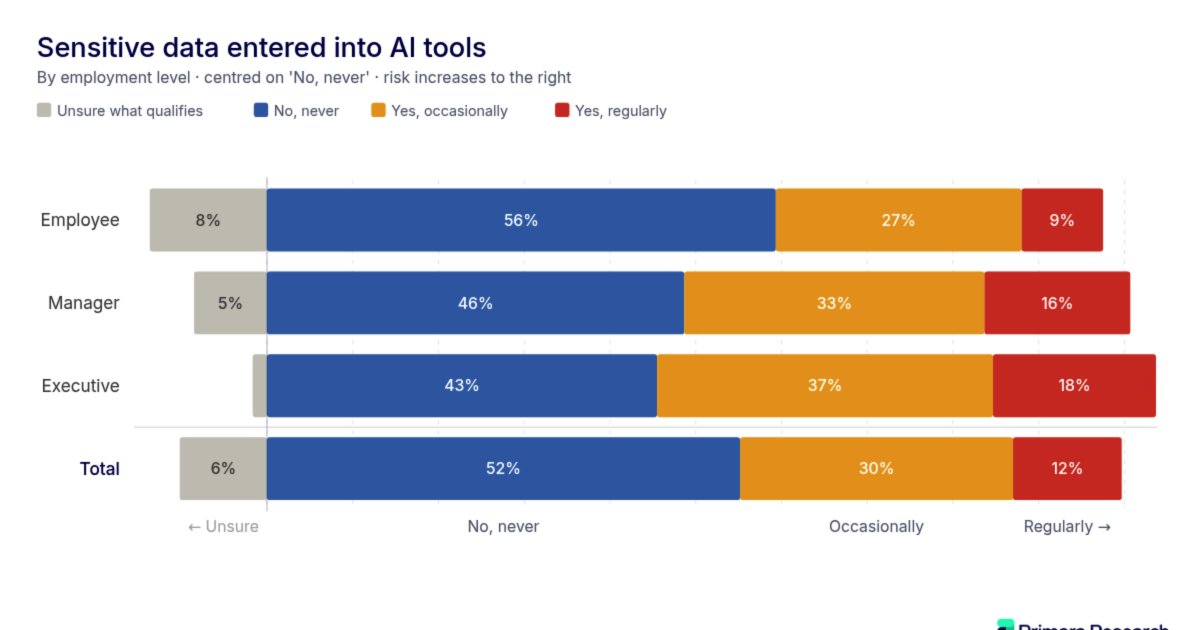
We analysed responses from 1,000 Australian employees and found a critical governance gap emerging across the workforce. Over 3 million workers are regularly entering sensitive or confidential information into AI tools at companies where 40% have no formal policy governing how those tools are used.
The scale is striking. Nine in ten Australian employees now use AI for work. Nearly three quarters do so every week. This represents the fastest adoption of any workplace technology in a generation. Yet formal AI policies exist at just 41% of businesses surveyed. Where policies do exist, compliance is inconsistent—nearly half of workers admitted they don't always follow the policy or have worked outside it entirely.
What's particularly concerning is the nature of the data in transit. Thirty per cent of AI users are inputting customer or client data. Fourteen per cent are entering personally identifiable information. This isn't a small compliance issue. This is millions of people's records moving through platforms their own organisations have no visibility over, often stored on overseas servers under terms users have never read.
The problem concentrates at leadership level. Across every organisational tier—employees at 36%, managers at 49%, and executives at 55%—workers admit to entering sensitive data into consumer AI tools. Executives handle the most sensitive information in any organisation: financials, strategy, client data. Yet eight in ten flag AI data exposure as a risk, and more than one in five still don't know that consumer AI tools store and train on their inputs. If senior leadership doesn't fully understand what happens to data once it enters these platforms, the people handling your information day to day are even less likely to.
For individuals whose personal information is involved, this situation may violate the Privacy Act. The structural issue is straightforward: AI is delivering genuine productivity gains, which explains the rapid adoption. But speed without the right safeguards means someone else pays the price. In this case, that someone is usually a customer whose data ended up somewhere it was never meant to go.
Governance must accelerate to match adoption. Telling businesses to stop using AI isn't realistic. But establishing formal policies, ensuring compliance, and building visibility over where sensitive data flows—that's not optional anymore.
1
1
31
May 13
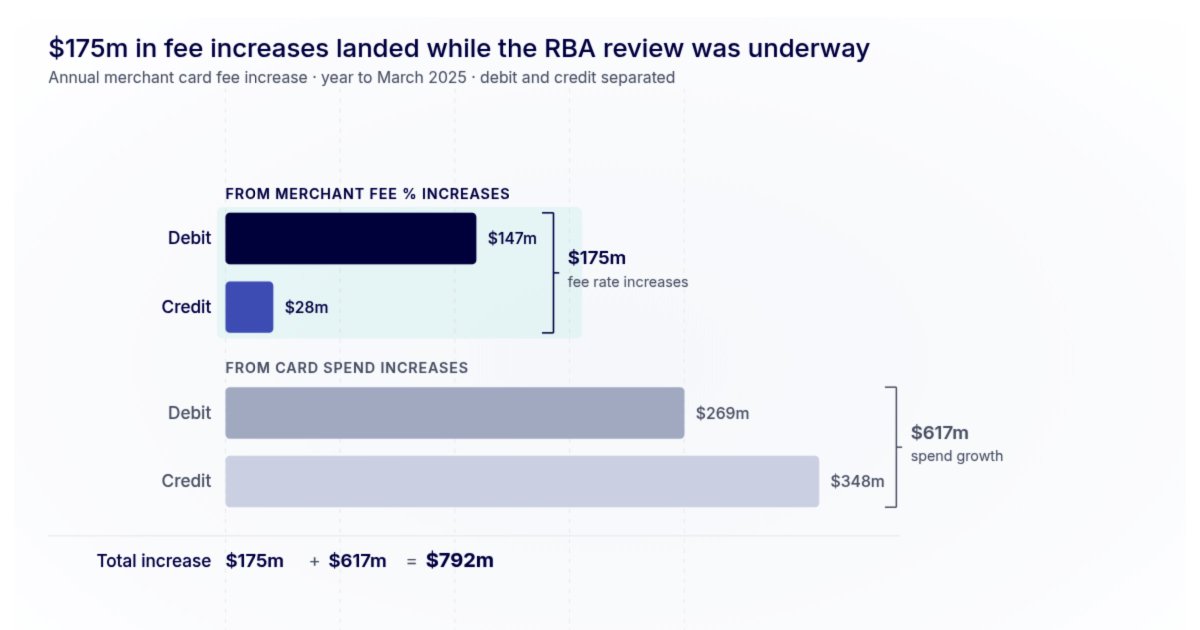
We analysed the latest RBA retail payments data to March 2025 and found something that should concern anyone relying on the payments reform process to deliver real competitive outcomes: Australian merchants paid $175 million more in card fees last year, but not because transaction volumes rose. Card payment volumes grew 8.4%, adding roughly $825 million to overall merchant card fee costs. The remaining $175 million came from fees themselves—schemes and acquirers extracting higher rates from every transaction.
Total annual merchant card fees now sit at $8.6 billion, up from $7.6 billion the year prior. That's a $1 billion increase in a single year.
The rate pressure is sharpest in debit. Visa debit lifted 8 percentage points, from 0.53% to 0.57%. Mastercard debit rose 4 points, from 0.57% to 0.59%. eftpos climbed 5 points, from 0.40% to 0.42%. Amex moved in the opposite direction, trimming credit card fees by 1%, but the divergence matters—these aren't uniform industry moves. Schemes themselves are driving the increases.
Timing is everything here. The RBA's payments review concluded earlier this year after identifying pricing as "overly complex and opaque." The review's own findings noted many merchants are "not aware they are paying significantly higher fees than other merchants of a similar size."
New transparency measures will require card networks to publish and justify fee changes. They're not yet in force. The data pattern suggests schemes used that window—the review period itself—to lift their rates before scrutiny arrives.
The RBA promises $910 million in annual merchant savings through interchange reductions. That money hasn't landed yet. What has landed is higher fees, delivered while the public interest framing of reform was loudest.
From October 2026, merchants will be banned from surcharging customers for card payments. The RBA's logic is sound—removing surcharging simplifies the system and should encourage merchants to shop around. But merchants entering that regime will already carry a higher cost base than they would have carried last year. The baseline has shifted up.
Understanding the true cost of card payments matters now more than ever—whether you're a merchant reviewing your payment plan or a consumer wondering why prices keep rising.
1
1
36
May 12
Our analysis of ACT residential construction reveals a market in structural retreat. House commencements have collapsed 59% — the largest decline of any Australian state or territory — as build costs have become economically unviable for developers and unaffordable for buyers seeking detached homes.
The data is unambiguous. The ACT became the most expensive jurisdiction to build in 2016-17. Since then, commencements have fallen 40%, approvals dropped 33%, and completions declined 16%. But the deterioration has accelerated sharply. Build costs in the territory now sit at $645,052, representing a staggering $190,000 increase over just three years and growing at 14.4% annually — more than double the national average.
At 36% above the national average, the ACT's cost premium rivals levels last seen during the COVID construction period. The gap reflects a structural reality: the territory's entirely urban footprint leaves no regional or rural land to absorb demand and moderate costs. Other states absorb development pressure across dispersed geographies. The ACT cannot.
Developers have responded exactly as markets predict. Apartments have surged to record commencement levels in the September 2025 quarter — the highest since 2018. Houses, which represented 31% of ACT commencements in 2022, now account for just 19%. Where returns per square metre make the numbers work, development capital flows. Where they do not, it flees.
This is not temporary cyclicality. The ACT's share of national house commencements has fallen to 2%, a proportion not seen since 2015, despite a 15% year-on-year lift in commencements during 2025. This trails the national growth rate of 16% and signals sustained structural decline in detached housing supply.
For ACT buyers seeking a house, the trajectory is clear: scarcity will only intensify. For renters, tighter supply will compound pressure. For policymakers, the data presents an unresolved structural challenge — sustained cost inflation that has made detached housing economically marginal in Australia's smallest capital city.
20
We analysed ABS Building Activity data to December 2025 and ABS population data to June 2025. The national completions number is the one getting attention, but the state-level picture is where the more useful story sits.
Australia completed 172,246 dwellings in 2025, the lowest annual total since 2012. The headline decline of 4,857 dwellings year-on-year looks bad. It's actually worse than it appears, because one state is doing most of the work.
Victoria completed 54,139 dwellings, down 6,181 or 10.2% on the prior year, its lowest level since 2013. Because Victoria accounts for 31% of all national completions, that single state's decline exceeds the entire national shortfall. Every other state combined was net positive. Victoria erased those gains and then some.
The national figure also obscures a second, distinct problem in Queensland and WA. Both states are recording positive net internal migration: people are actively relocating there for lifestyle and affordability. Both also increased completions year-on-year. But neither is building fast enough to keep up with its own population growth. Queensland recorded a dwelling deficit of 6,354 against population growth. WA recorded 5,949. They are the two largest shortfalls in the country, and they're occurring in the states people are choosing to move to.
Nationally, completions added a net 4,499 dwellings above household growth, a 0.04% increase against 11.45 million total households. It is technically supply growth, but only just.
The two problems are structurally different. Victoria is building less than it was. Queensland and WA are building more, but not enough. Policy responses that treat them as the same issue are probably not well targeted.
1
1
203
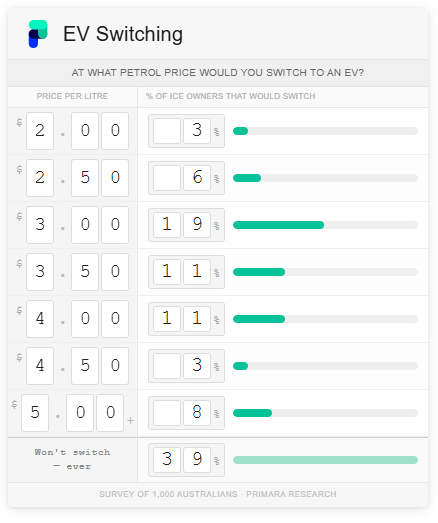
We ran a nationally representative survey of 1,000 Australians in March 2026 on EV consideration and fuel price sensitivity. A few findings worth pulling out.
The headline number: 39% of ICE car owners say no fuel price, however high, would push them toward an EV. That's not a price problem: it's a structural ceiling on EV adoption that pricing policy alone can't move.
The generational split is the sharper story within that. Over 45s are 142% more likely to reject EVs outright than under 45s. 56% of over 45s say they will never switch, compared to 23% of under 45s. For that cohort, the decision doesn't appear to be running through a cost calculation at all.
There is a price point that shifts behaviour for those who are persuadable: $4 a litre. If petrol crosses that threshold, half of all ICE drivers say they would seriously consider switching, including 61% of under 45s and 38% of over 45s. For context, the average driver covering 15,000km a year would be paying around $2,400 more annually, or $200 a month, compared to current prices.
A few other numbers from the survey worth noting. 79% of Australians own an ICE vehicle and no EV, leaving them fully exposed to fuel costs. Only 5.3% currently own an EV, rising to 17.2% when hybrids and PHEVs are included. And 31% of all Australians - not just ICE owners - are effectively price-inelastic on EVs.
The $4 threshold matters for EV policy conversations, but so does the 39% who sit outside it entirely. Any adoption model that assumes price is the primary lever is probably working with an incomplete picture.
1
2
46
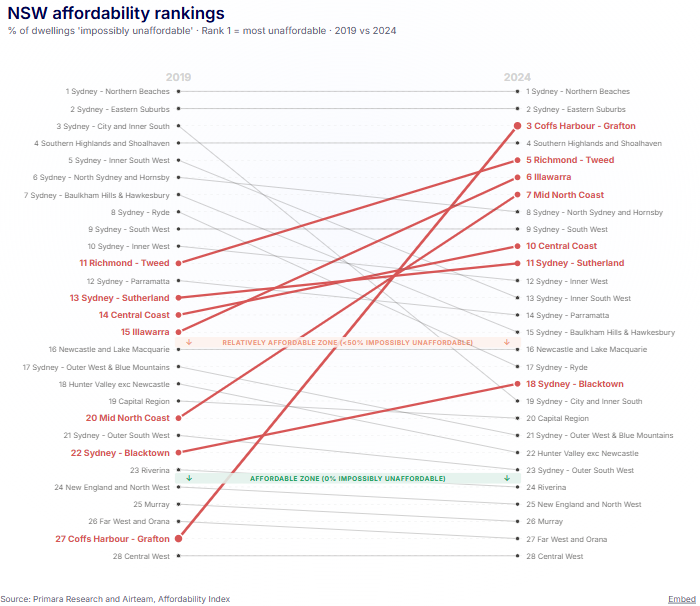
We published a joint affordability analysis with our technology partner Airteamusing ABS population, wage, and census data alongside NSW Valuer General property price data. The methodology follows the Demographia international affordability measure - a ratio of median property price to median household income - applied at SA2, SA3, and SA4 levels down to June 2024.
The finding that stands out most: six of NSW's ten most unaffordable property markets are now regional areas. In 2019, just one was.
Five years ago, 38% of Sydney met the "Impossibly Unaffordable" threshold, defined as a median property price more than nine times the median household income. Regionally, 11% did. The Sydney exodus didn't just move people; it moved the affordability problem with them, and in some cases well ahead of them.
The five new regional entrants to the top ten since 2019 tell the story clearly. Coffs Harbour/Grafton moved from 27th to 3rd. Richmond Tweed from 11th to 5th, anchored by Byron Bay. Illawarra from 15th to 6th. Mid North Coast from 20th to 7th, with Nambucca Heads carrying a ratio of 17.3. Central Coast from 14th to 10th.
Byron Bay and Nambucca Heads now sit among only 21 regions statewide with affordability ratios above 17, meaning median prices are more than 17 times the median local income. Every other area above that threshold is in Sydney. The state's single highest ratio is Putney at 26.9.
The mechanism is straightforward. The people already living in Nambucca Heads or Coffs Harbour didn't receive a pay rise when demand arrived from Sydney. Their incomes stayed flat while prices moved sharply, and the ratio collapsed. That's not a housing cycle dynamic: it's a permanent repricing of places that had no structural connection to Sydney wages.
Affordable areas across NSW have fallen from 31 in 2019 to 13 today. None are in Sydney or anywhere on the state's east coast. The remaining pockets are all inland: Far West and Orana (6), New England and North West (4), Central West (3).
The policy conversation has largely focused on supply in Sydney. The data suggests the affordability problem has already moved well beyond it.
1
1
1
42
You can view the list in full here: observablehq.com/embed/c52c1…
14