
Tableau Public Featured Author | Financial Planning and Analysis Analyst | Data viz designer | Tableau Desktop Specialist.
Joined March 2019
- Tweets 598
- Following 589
- Followers 672
- Likes 2,595
46 Photos and videos


Pinned Tweet

26 May 2020
2020 #MakeoverMonday
Visualizing 40 Years of Music Industry Sales
Tableau Public Link: public.tableau.com/profile/p…
@TriMyData @CharlieHTableau
@rajvivan
#MMVizReview
Inspired by @flerlagekr's creating custom animations & @sarahlovesdata's annotations in tableau blog post.
16
3
108
Priyanka Rohatgi retweeted

18 May 2023
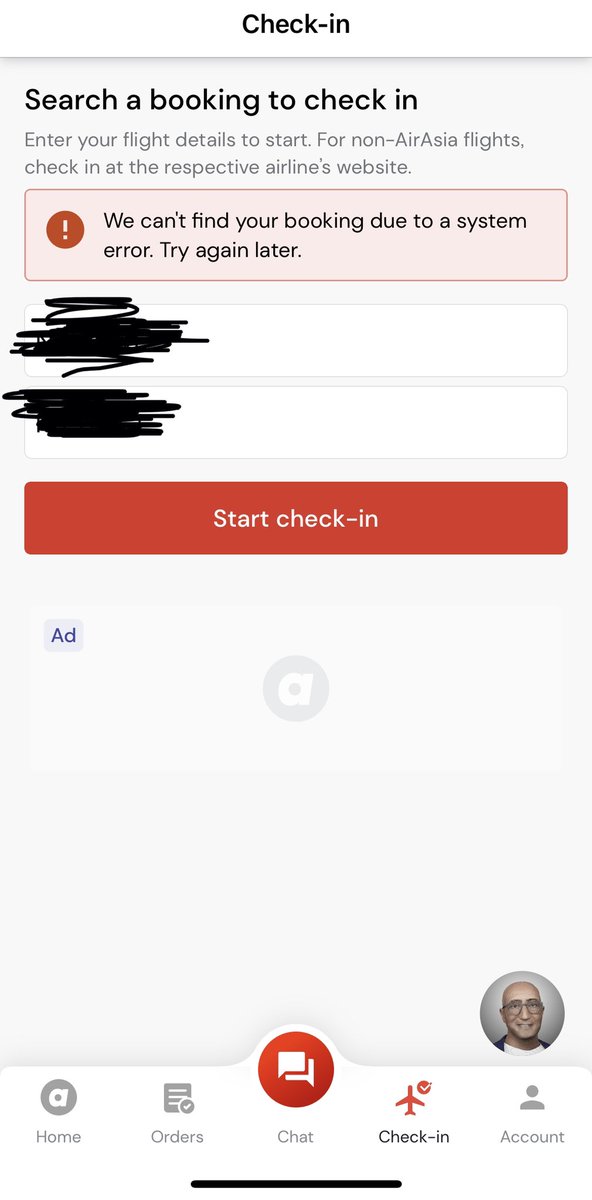
Hello @airasia , i have a flight from Bengaluru on 24th May to Kuala Lumpur and I’m unable to find my booking or do a web chekin. Your chat bot is of no use and there is no other way to contact. Also for past 5 days I’m seeing the system error.Can you look into this asap #airasia
1
1
351
2 Oct 2021
A big shoutout to @katebrown_5. She's a prep genius. A few cool tips from her helped me automate a huge huge workflow. She's just awesome.
3
36
Priyanka Rohatgi retweeted

3 Sep 2021
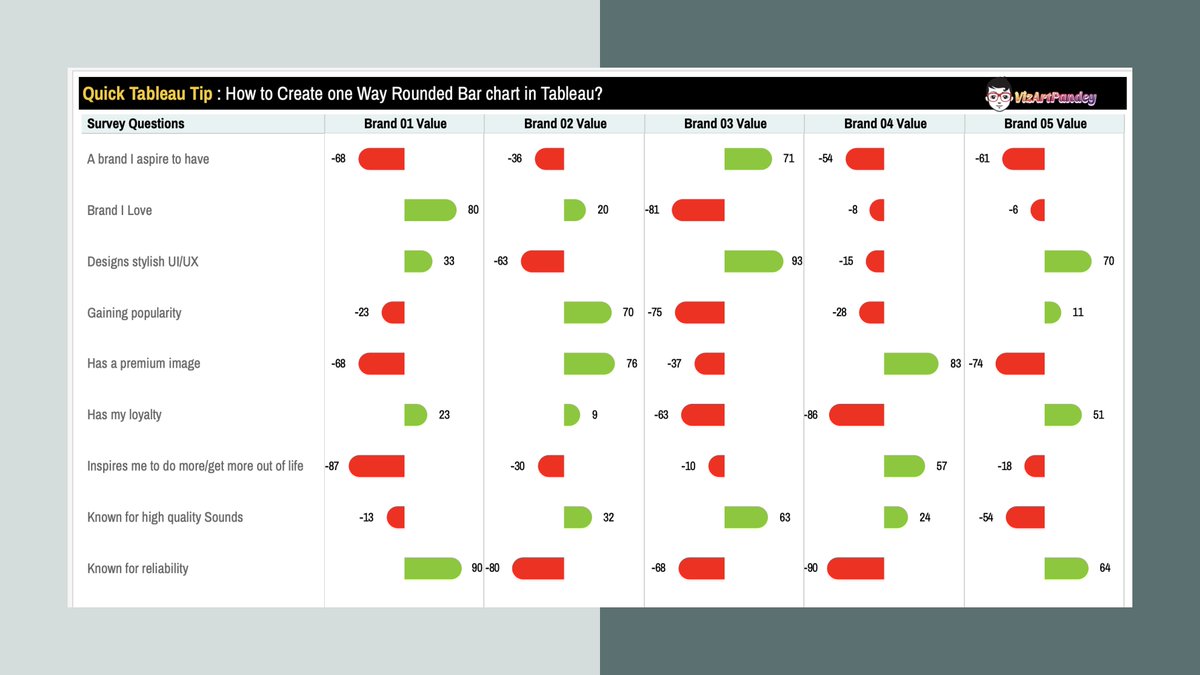
One of the most fundamental chart types is the bar chart and one of your most useful tools for exploring and understanding your data.
Explore this new chart here #vizartpandey #datafam
vizartpandey.com/bidirection…
@tableau @pallavinaik_ @Prohatgi27 @AvinashMReddy @prem_prasann
6
23
5 Aug 2021
Another amazing dashboard by @ItsYerramsetti 🔥
5 Aug 2021

New Viz! Lately I was reading about Braille script, and its very interesting to understand how simple 6 dots can help us communicate. Here is my viz on understanding Braille script.
Url: tabsoft.co/3lmMwjk
color palette: @zizzy_data
#viz2educate @VinodhDataArt @EveThomas1
2
Priyanka Rohatgi retweeted

29 Jun 2021
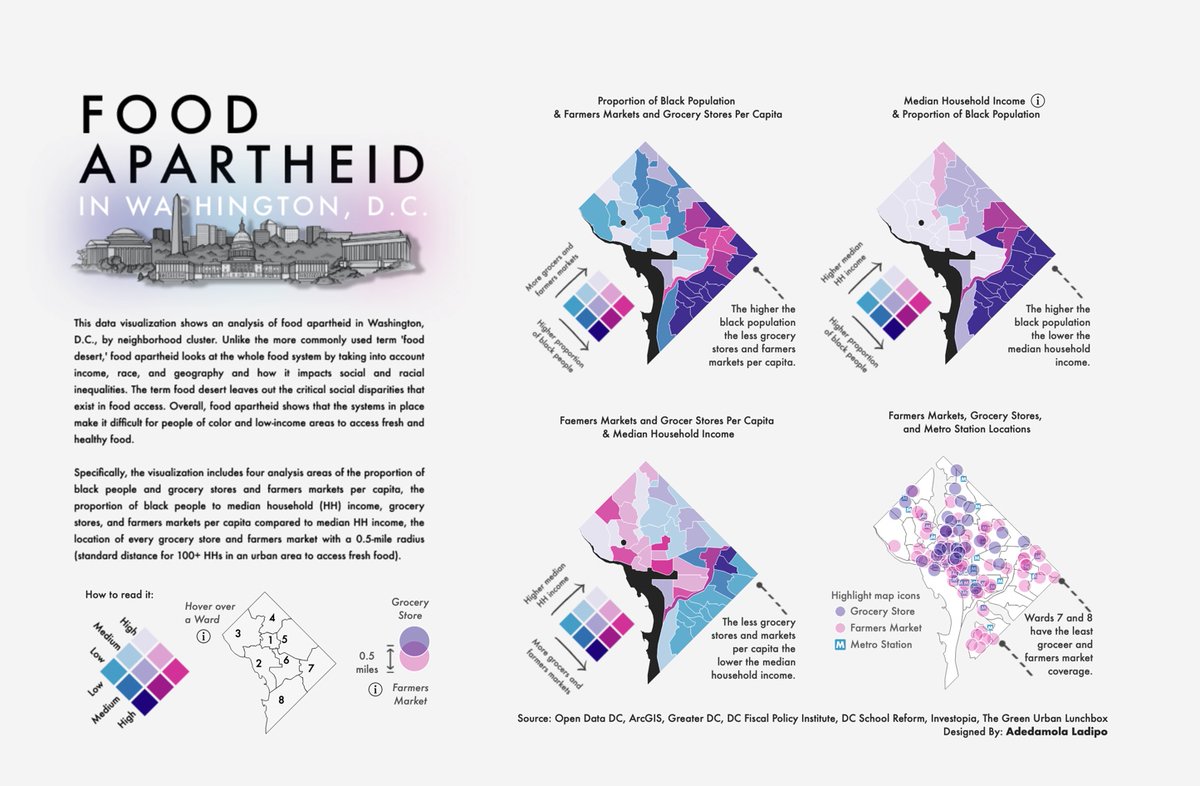
Food Apartheid in Washington, D.C. | A look at the food system of income, race, and geography in the US Capital
#DataFam, I updated the census data and visuals for my food apartheid #dataviz.
Link: tabsoft.co/3x3zM48
Created in #Tableau and #figma
#DiversityInData
18
37
283
Priyanka Rohatgi retweeted
25 Jun 2021
Data preparation has historically been an IT function, but the data landscape has evolved. Self-service data preparation tools put the power in the hands of the people who know the data while reducing the burden on IT to prepare it.
📢 vizartpandey.com/write-to-go…
@tableau #datafam

2
6
30
Priyanka Rohatgi retweeted
19 Jun 2021
How To Create a Normal Distribution Curve Within Tableau vizartpandey.com/how-to-crea…
Thanks to @Marketanalytic5 for all his incredible work.
@pallavinaik_ @jotigautam @AvinashMReddy @prem_prasann @PawanSachdeva_ #datafam #tableau @tableau
2
10
33
Priyanka Rohatgi retweeted

1 Jun 2021
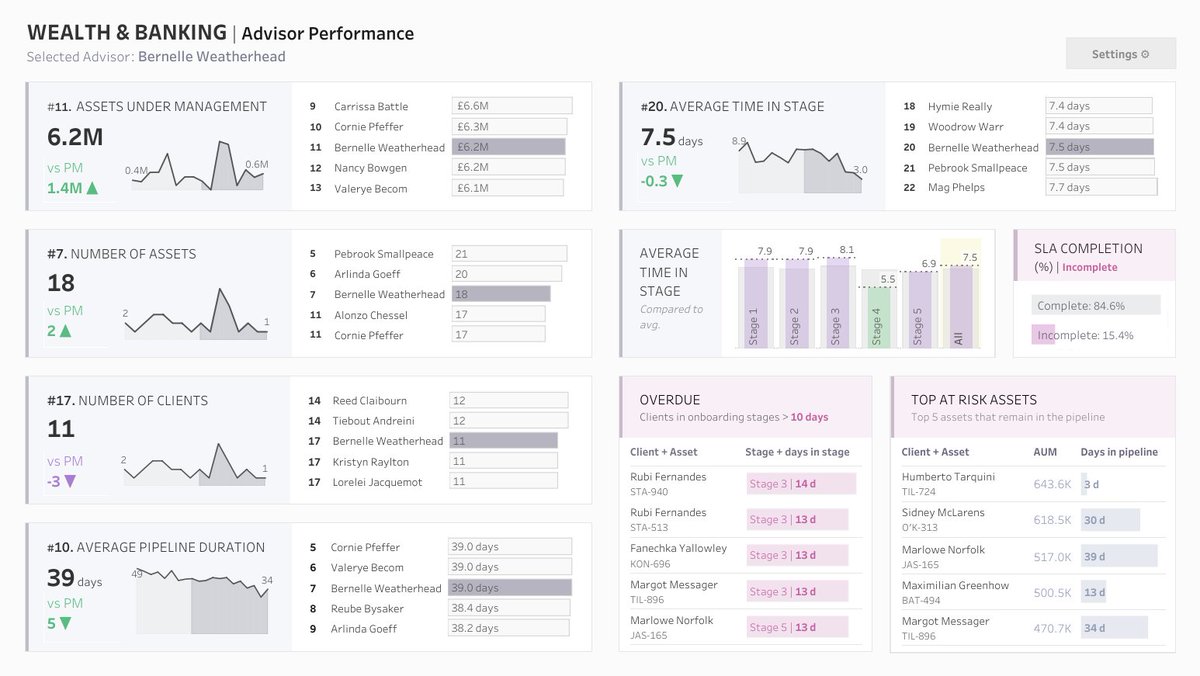
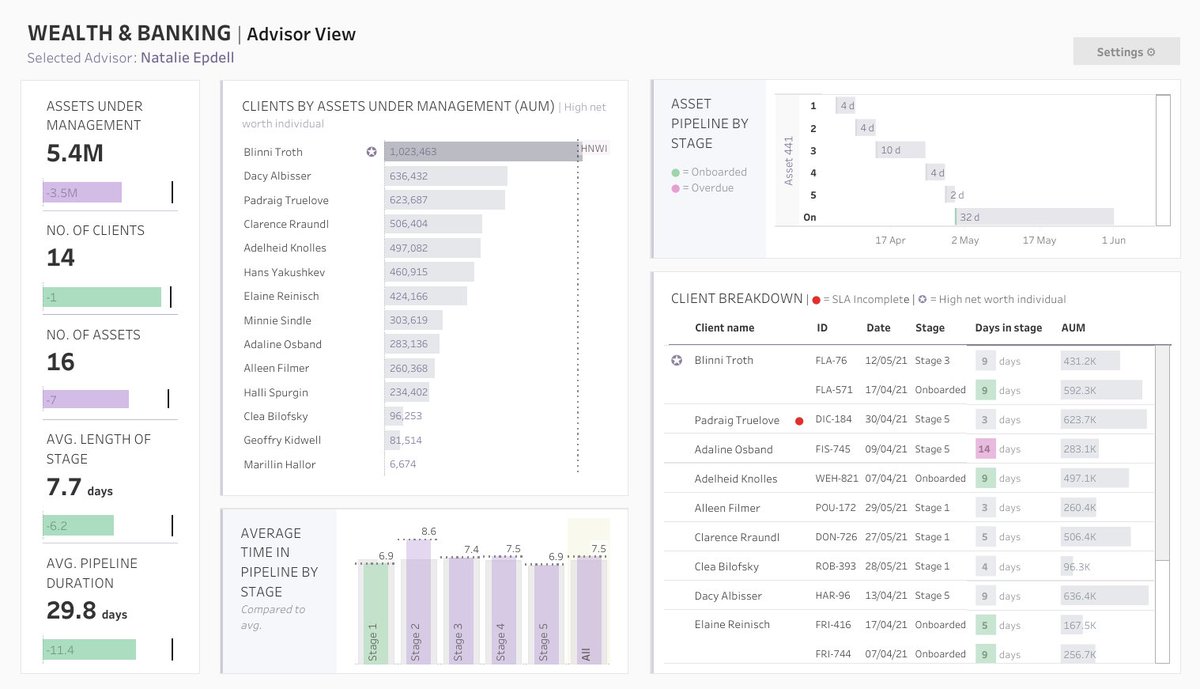
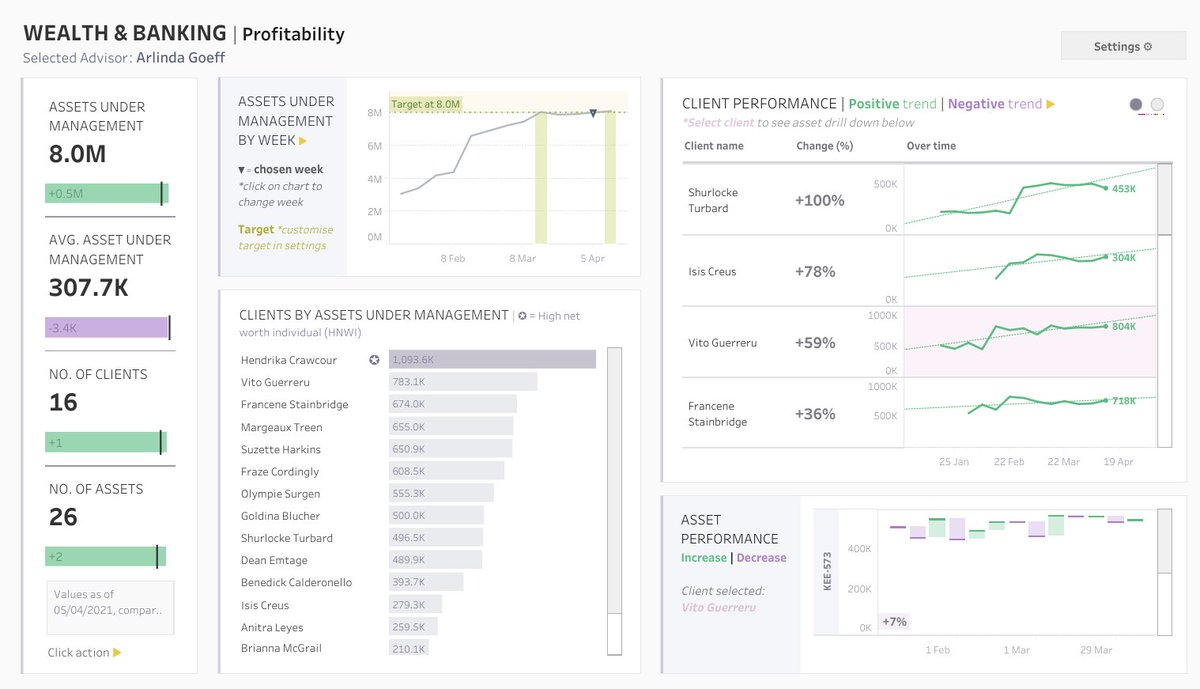
i recently did a mini project to create some demo business dashboards, with a few wealth and personal banking scenarios in mind. results attached
data: mockaroo.com as always
links below in case these provide some inspo
25
33
417
Priyanka Rohatgi retweeted

30 May 2021
Check out the latest post on #Vizartpandey for the solution guide to #WOW2021 Week 21 - How often is Sean listening to his favorite songs.
Thanks to @HipsterVizNinja for the challenge
#datafam #tableau #dataviz
@rajvivan @tableau #wow2021
Blogpost - vizartpandey.com/combined-sc…
1
3
9
Priyanka Rohatgi retweeted

24 Mar 2021
Hi #datafam
New viz 🚨
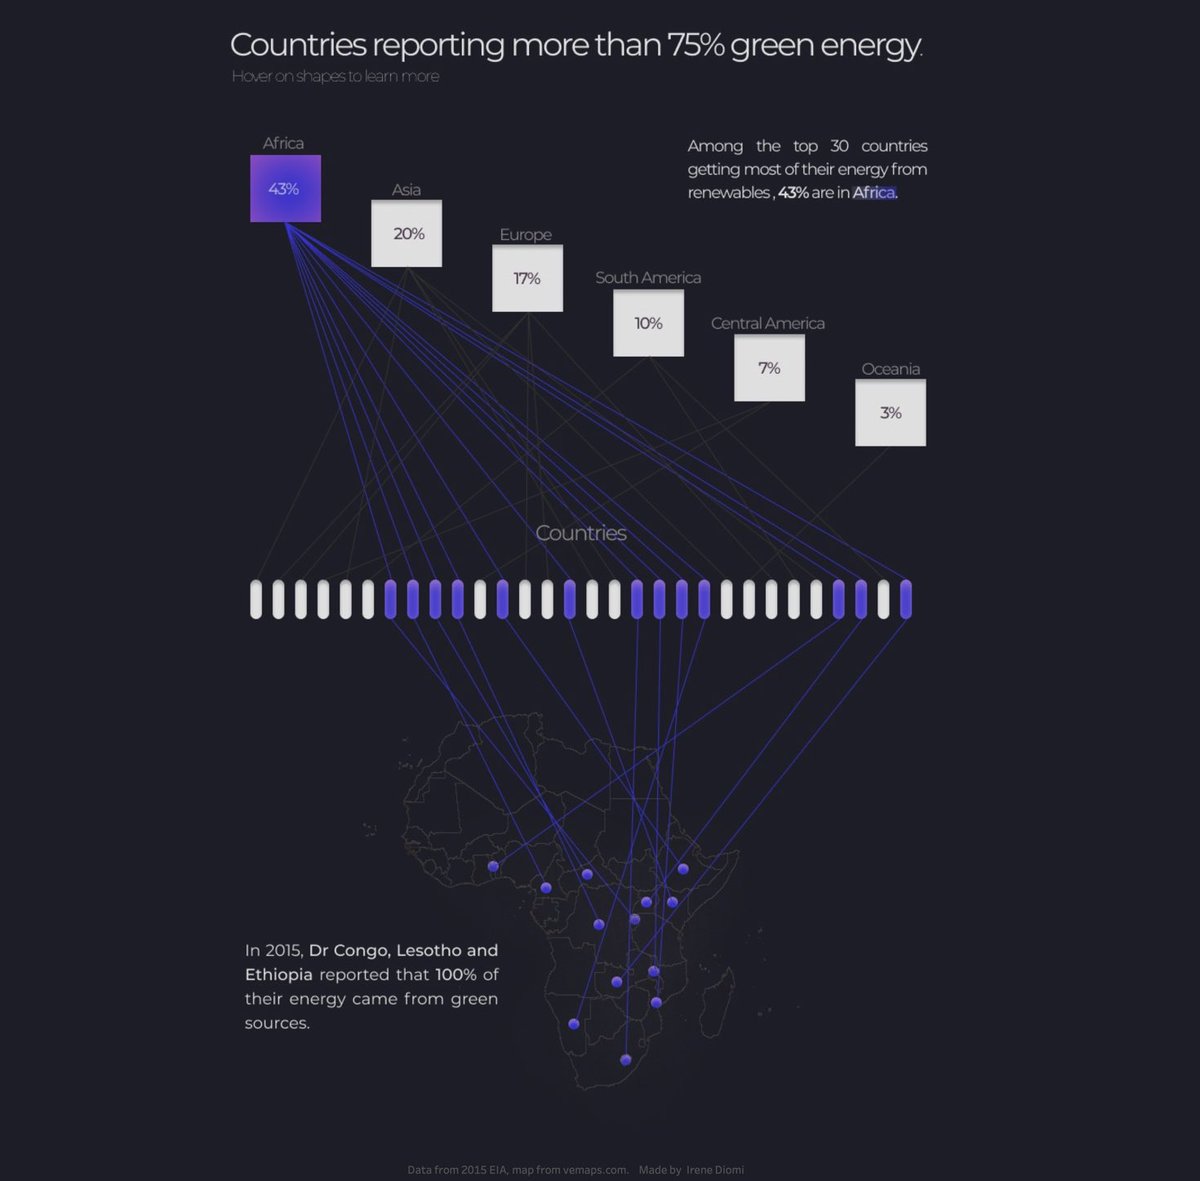
I have decide to do more vizzes on #africa to show a brighter side of the continent. I had fun designing this with an usual chart, I created.
▶️ link here: public.tableau.com/views/Cha…
#VizAfrica #renewables @tableaupublic @tbigsho_
19
23
121
Priyanka Rohatgi retweeted
24 Mar 2021
Check out the latest post on #Vizartpandey from @_DataLoy on 3 R packages that can beautify your charts
@rajvivan @PawanSachdeva_ @AvinashMReddy
@jotigautam @Prohatgi27 @hm_1710
#datafam #tableau #r #ggplot2 #tidytuesday
Blogpost - vizartpandey.com/3-r-package…
5
8
Priyanka Rohatgi retweeted

21 Mar 2021
Happy 10th anniversary #D3js 🥳🎂 ! I made this #dataviz of radial tidy trees of each project I've made and respective bl.ocks observable stackoverflow other blog example codes that helped me finish my projects. Thank you to the community. View it here observablehq.com/@urmilaj/ha…
15
89
Priyanka Rohatgi retweeted
18 Mar 2021
Creating Simple Line Charts Using D3.js – Part 01 vizartpandey.com/creating-si… via @tableau @pallavinaik_ @PawanSachdeva_ @prem_prasann @priyankadobhal_ @shivrajc @jotigautam @Prohatgi27 @_DataLoy @pradeep_zen @AvinashMReddy
1
6
25
8 Mar 2021
Everything about this viz is exceptional! well done you guys.
@aabattani @_CJMayes
8 Mar 2021

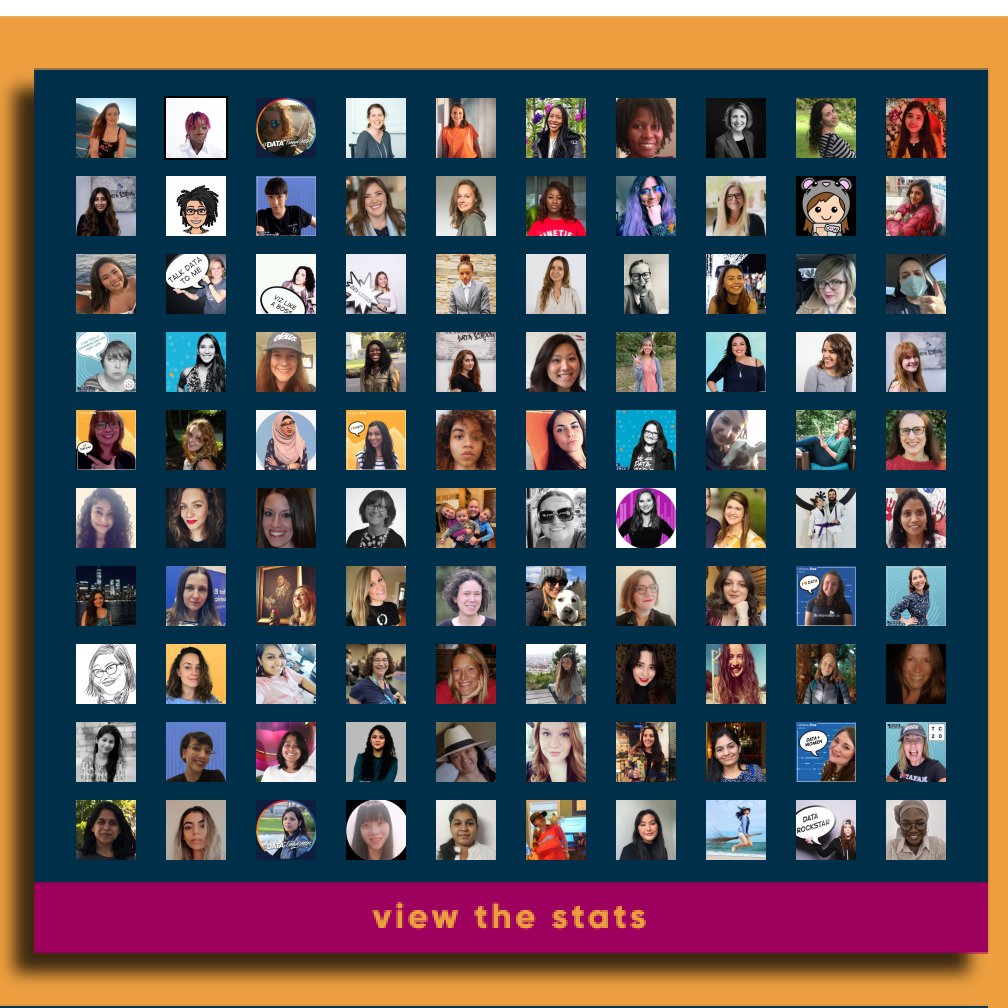
🚨NEW VIZ
tabsoft.co/30xs83r
To honor #InternationalWomensDay, @_CJMayes and I put together a dashboard highlighting 100 women in the #datafam who inspire us. Check out the viz to find out more about these wonderful ladies.
What woman in your life inspires you?

9
Priyanka Rohatgi retweeted
27 Feb 2021
In this series, I hope to help others by focusing on the basics. The digestible lessons help to demystify common D3 patterns and build a solid foundation for learning more.
@tableau @tableaupublic @shivrajc #d3.js #vizartpandey
D3.js – Demystified vizartpandey.com/d3-js-demys…
7
6
42
Priyanka Rohatgi retweeted
23 Feb 2021
Hi #datafam, Planning to start a new blog series on D3.js and just completed the first draft.Can't wait to share more.
Thanks to @Wattenberger and @shivrajc for all the inspiration !! #vizartpandey @pallavinaik_ @jotigautam @PawanSachdeva_ @AvinashMReddy @Prohatgi27 @_DataLoy

10
8
56
Priyanka Rohatgi retweeted
8 Feb 2021
WHY DOES VISUAL CLARITY WORK?
#datafam #Tableau #vizartpandey #tableaumagic @pallavinaik_ @PawanSachdeva_ @prem_prasann @Prohatgi27 @jotigautam @_DataLoy
Excerpt from a book: The Back of the Napkin by Dan Roam

1
6
18
Priyanka Rohatgi retweeted
24 Jan 2021
How to Embed Tableau Dashboard in a Powerpoint Presentation
vizartpandey.com/how-to-embe… via @tableau @pallavinaik_ @Prohatgi27 @jotigautam @_DataLoy @prem_prasann @PawanSachdeva_ @AvinashMReddy #vizartpandey #datafam @sarahlovesdata
10
43
Priyanka Rohatgi retweeted

22 Jan 2021
I just published an article on
How to: React/Node App Deployment on Digital Ocean Cloud using GitHub link.medium.com/UysP437qgdb
#code #programming #nodejs #react #cloud #digitalocean
1
2
Priyanka Rohatgi retweeted
20 Jan 2021
Tableau : Introduction to Spiral Heatmap vizartpandey.com/tableau-int… via @tableau
@pallavinaik_ @priyankadobhal_ @Prohatgi27 @prem_prasann @_DataLoy @jotigautam @PawanSachdeva_ #datafam @AvinashMReddy #vizartpandey
1
7
26