
Joined October 2024
- Tweets 17,282
- Following 91
- Followers 275
- Likes 102
7,643 Photos and videos


#CryptoMarket #RSI #Top100
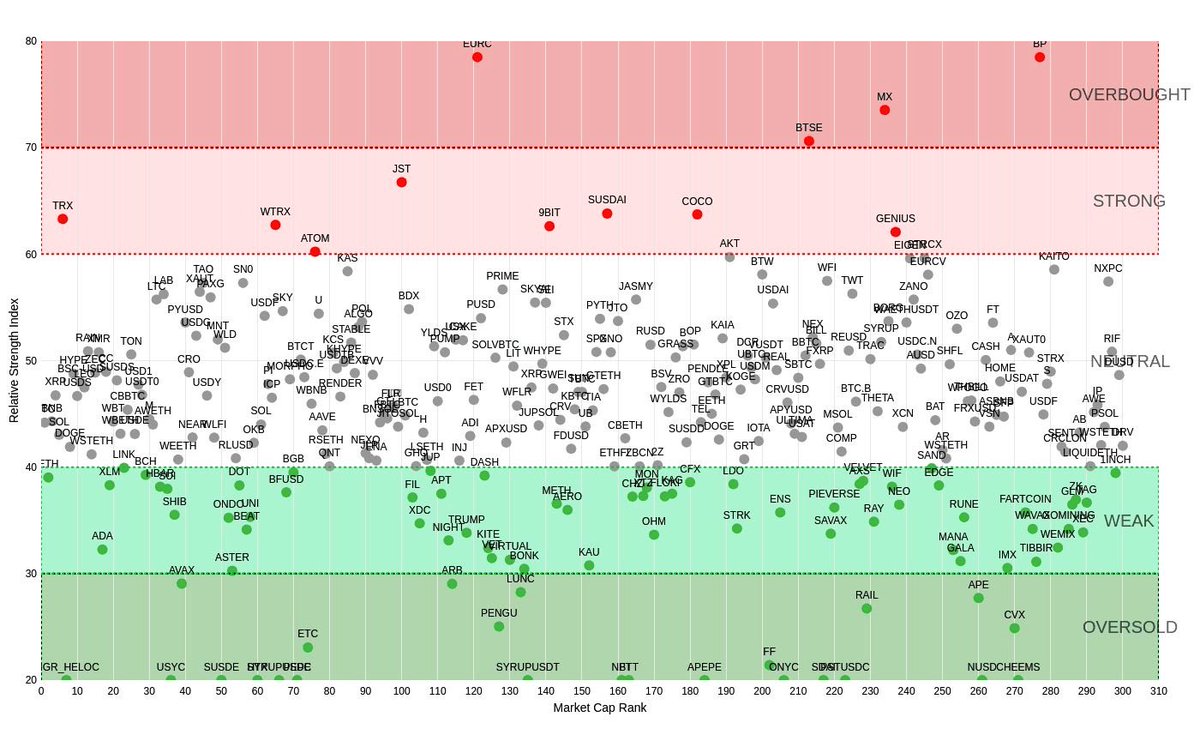
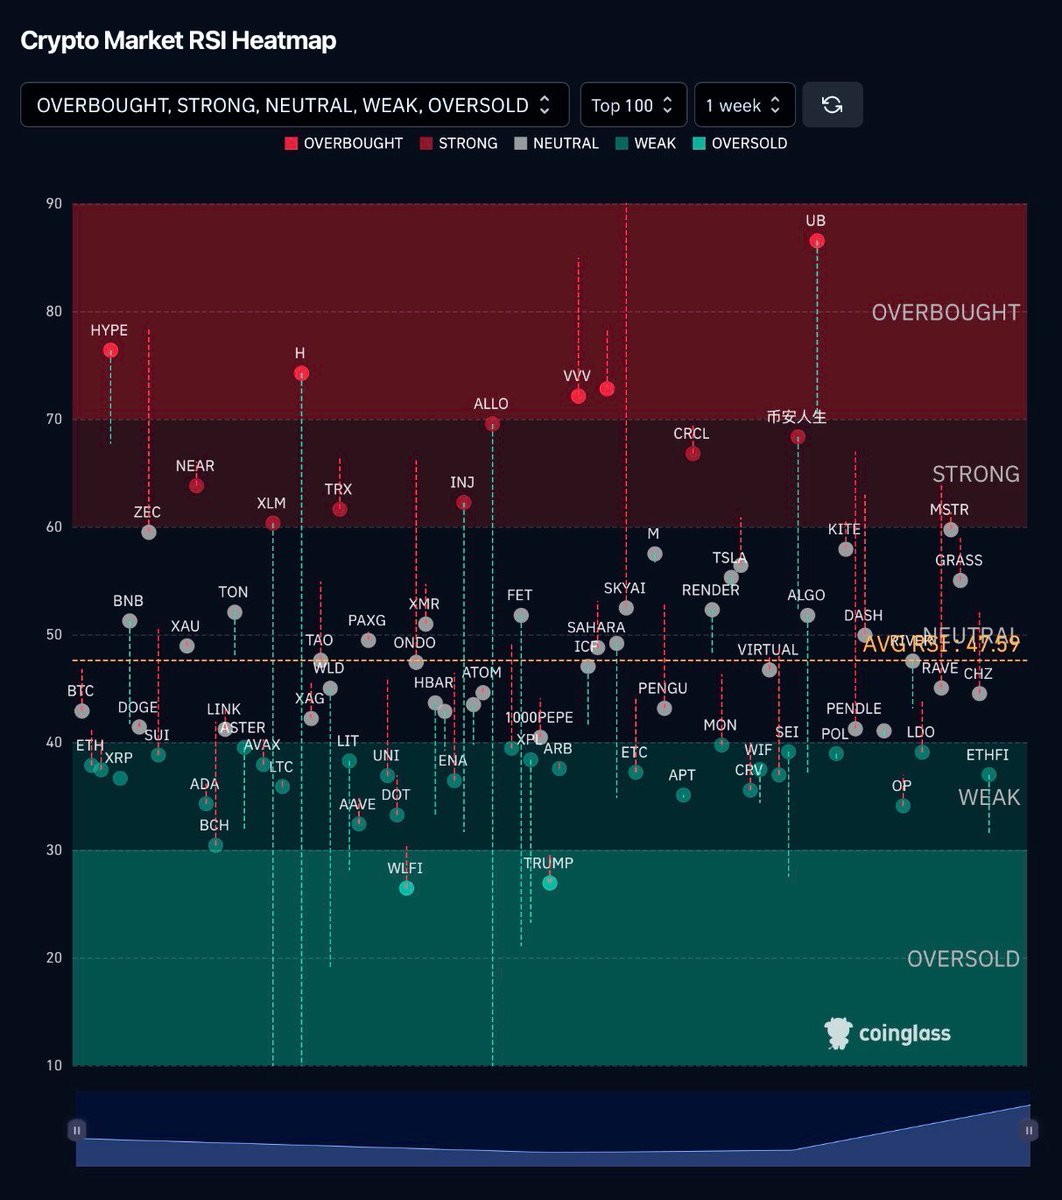
📍Crypto Market RSI —Top 100 | 1W
Average RSI: 44.65. Down hard from 47.59 last update. The lean we spotted last update? The market leaned — the wrong way.
🧵👇 in comments

#CryptoMarket #RSI #Top100
📍 📍 Crypto Market RSI — Top 100 | 1W
Average RSI: 47.59. Up slightly from 46.58 last week. We said watch the top names. They answered — just not all the same way.
🧵👇 in comments
1
48
47.59 → 44.65. Biggest drop in over a month. 5th consecutive week below 50.
The overbought zone is rotating through new names at high speed. The broad market is sliding. The average is falling while the top keeps changing faces.
1
16
That’s not rotation building. That’s a market running out of narratives. 📉
12
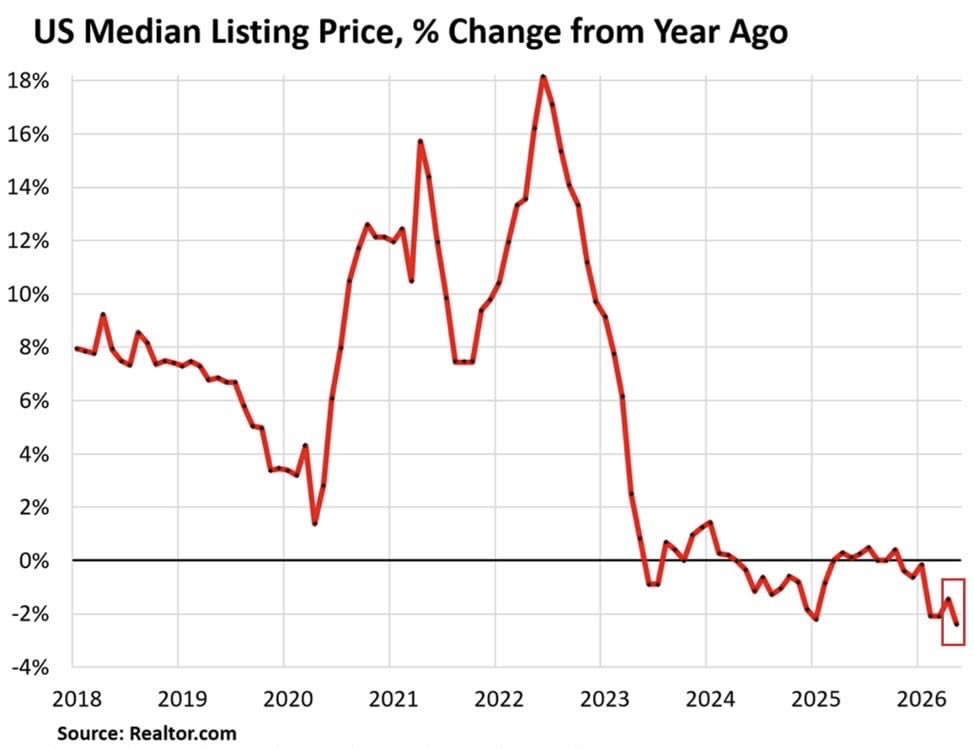
#US🏠 🇺🇸 #MedianListingPrice
📍The median listing price of existing US homes 🔽 -2.4% YoY in May, to $429,500, the largest annual decline since at least 2017.
On a per-square-foot basis, prices 🔽 -2.5% YoY.
1
18
In total, this represents a swing of more than 20 percentage points from the peak annual growth rate of 18.0% seen in June 2022.
1
15
This comes as mortgage rates remain elevated, buyer demand continues to weaken, and CPI inflation has risen for the 4th consecutive month, further squeezing affordability.
The US housing market correction is gaining momentum.
14
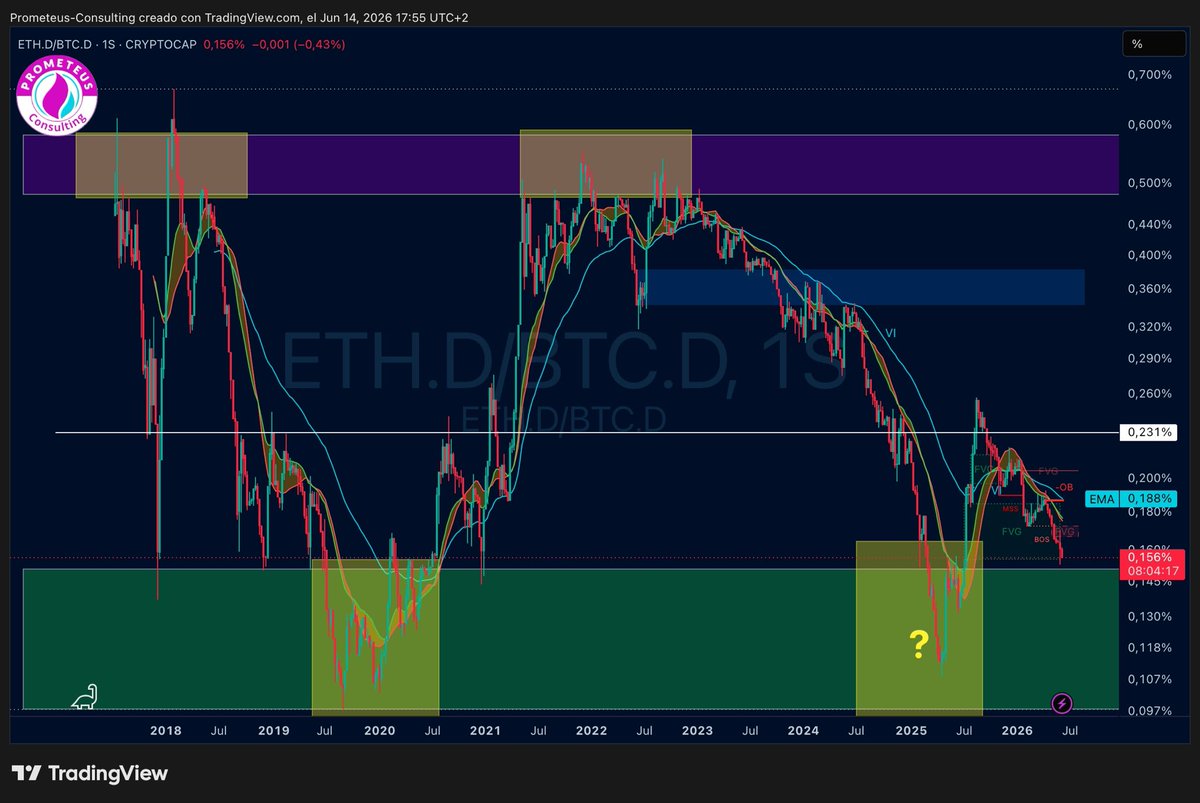
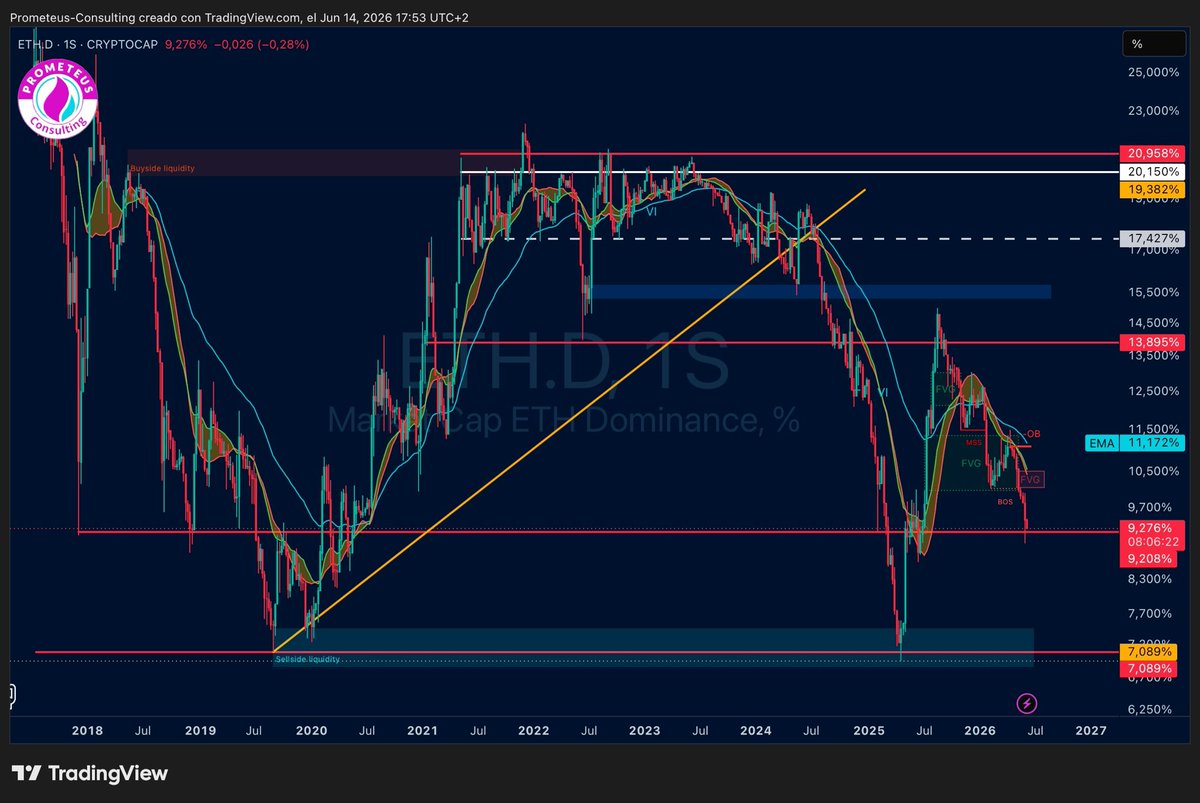
#SOLANA #SOL vs #BTC vs #ETH
📍Update:
Solana vs BTC a LH and kept going down, as we aware.
Solan vs ETH couldn’t break yet resistance level..
#SOLANA #SOL
📍Update:
Solana looks better vs BTC grinding up very softly, than vs ETH, rejected at support & Bull Market Bands.
Can be possible vs BTC a LH and keep going down, so be aware.


1
51
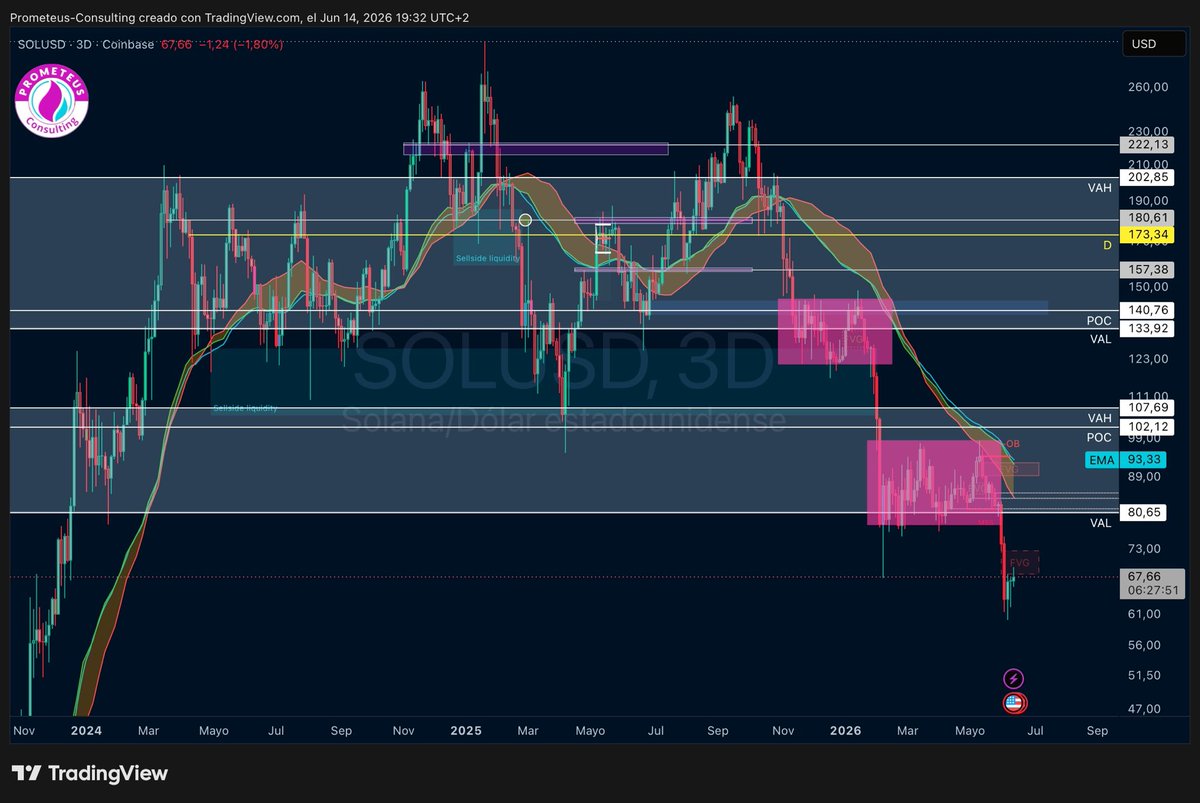
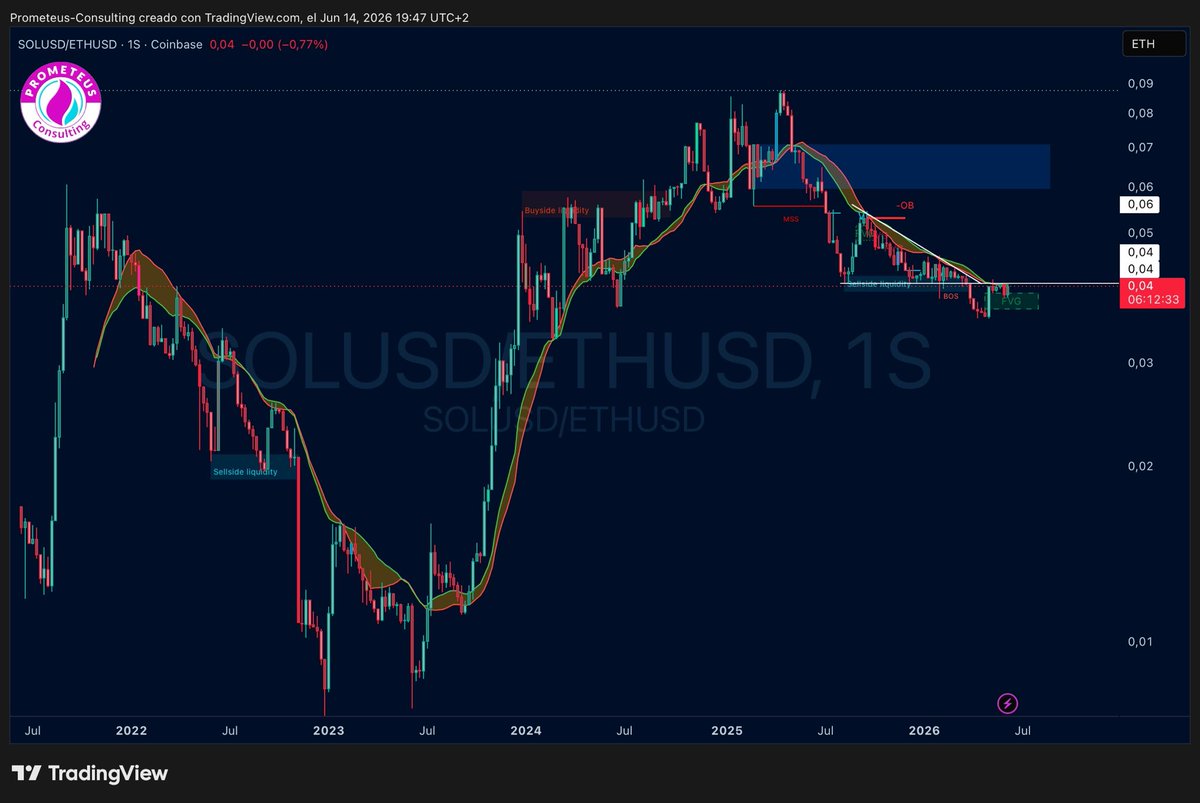
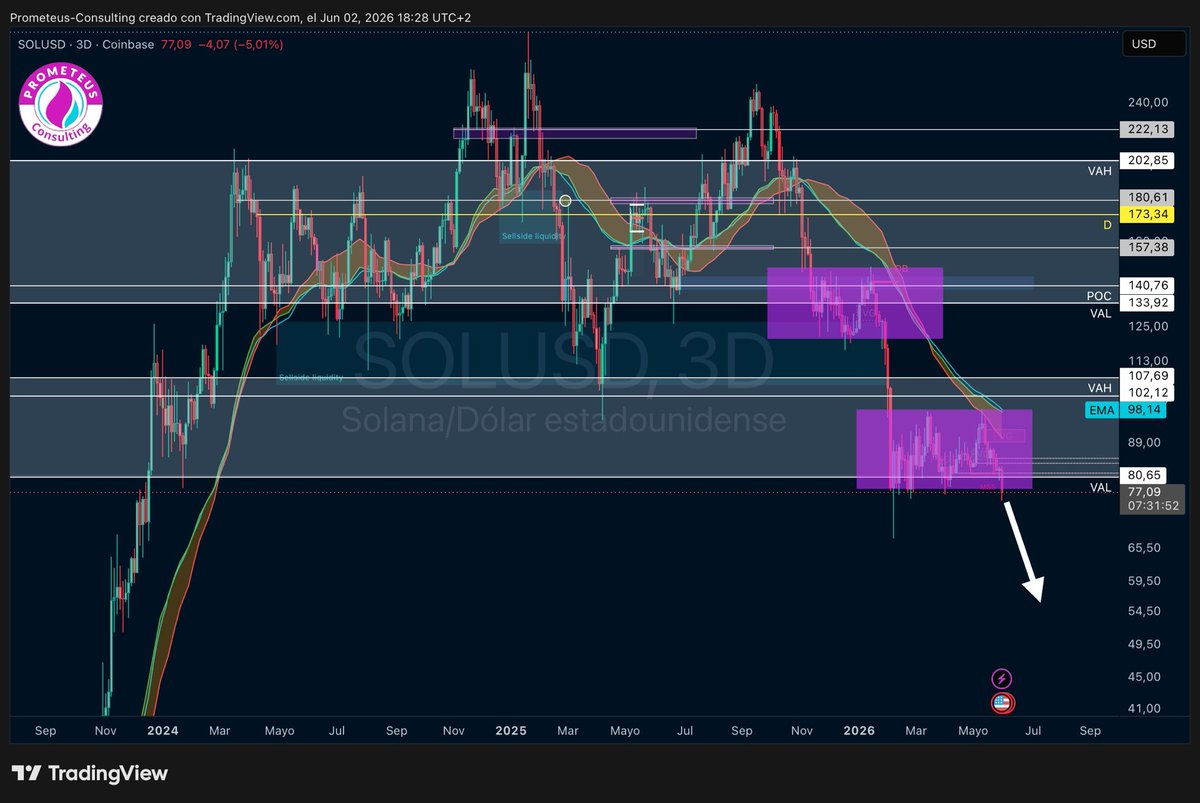
#SOLANA #SOL
📍Update:
SOL cooked. Didn’t recover range, and followed a big breakdown as we suggested.
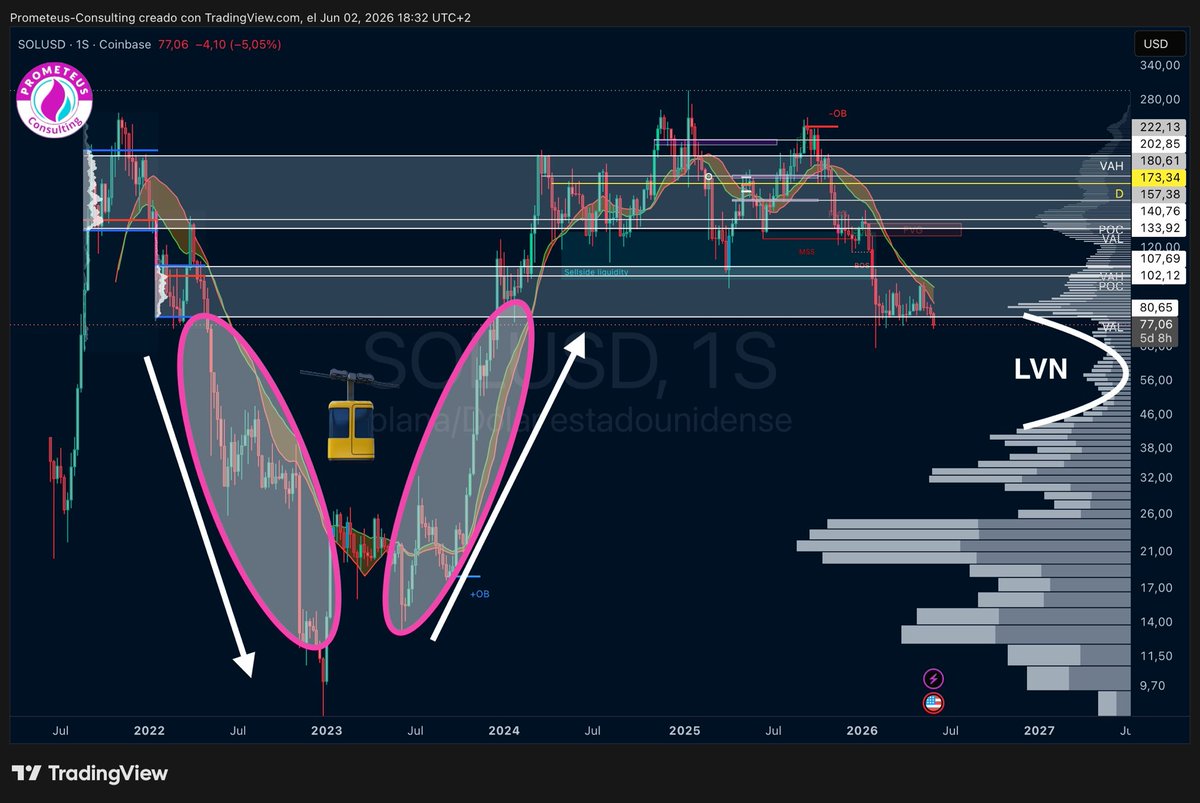
LVN in 1W was advising of a possible fast dropdown as per image2. SOL still tapped and held above small HVN, not recovering range or rejection at VAL and SOL fills LVN

#SOLANA #SOL
📍Update:
SOL looks cooked. In case not recovering range, get ready for a possible big breakdown 📉.
LVN in 1W can cause fast dropdown as per image2.
1
37
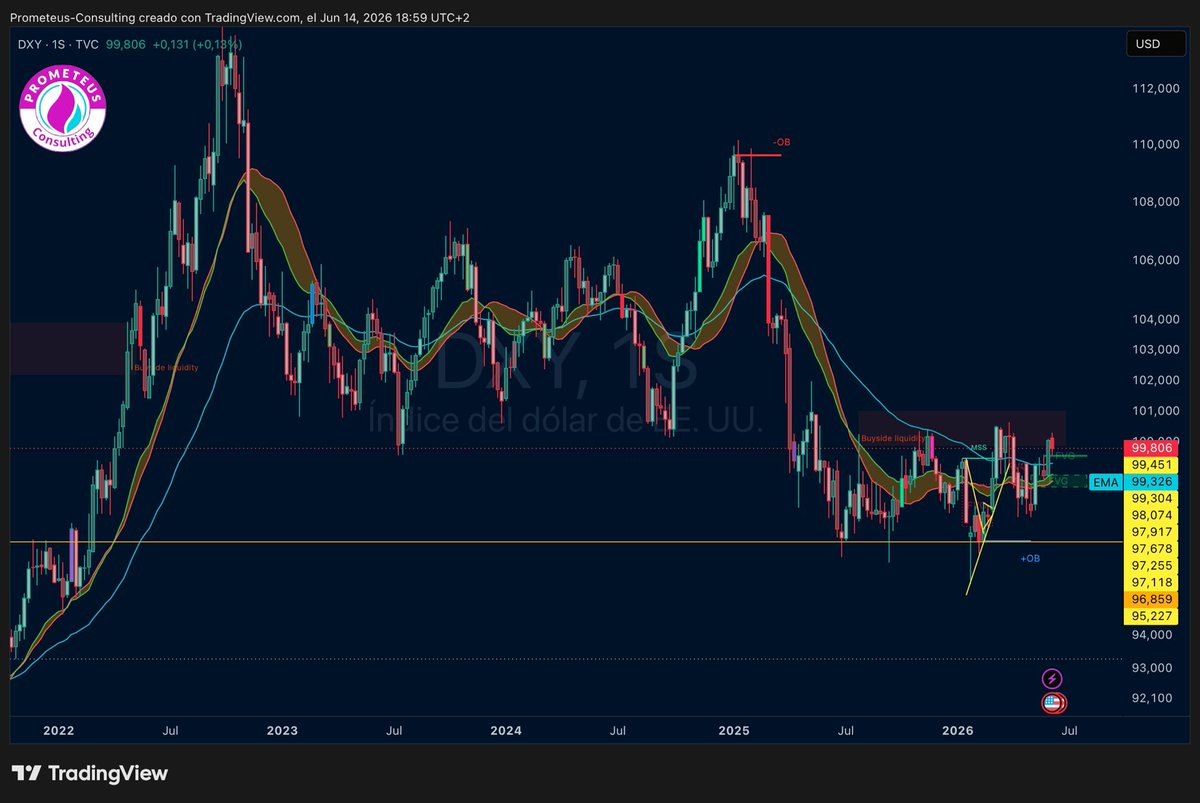
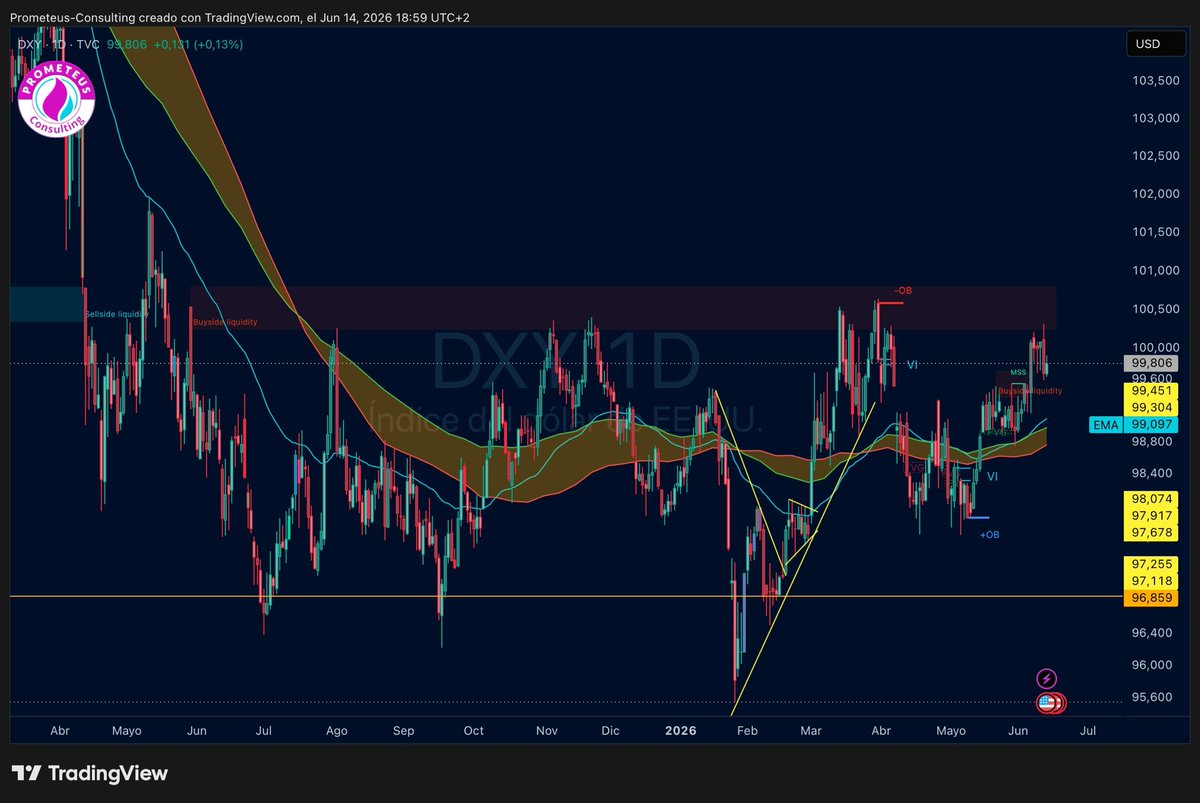
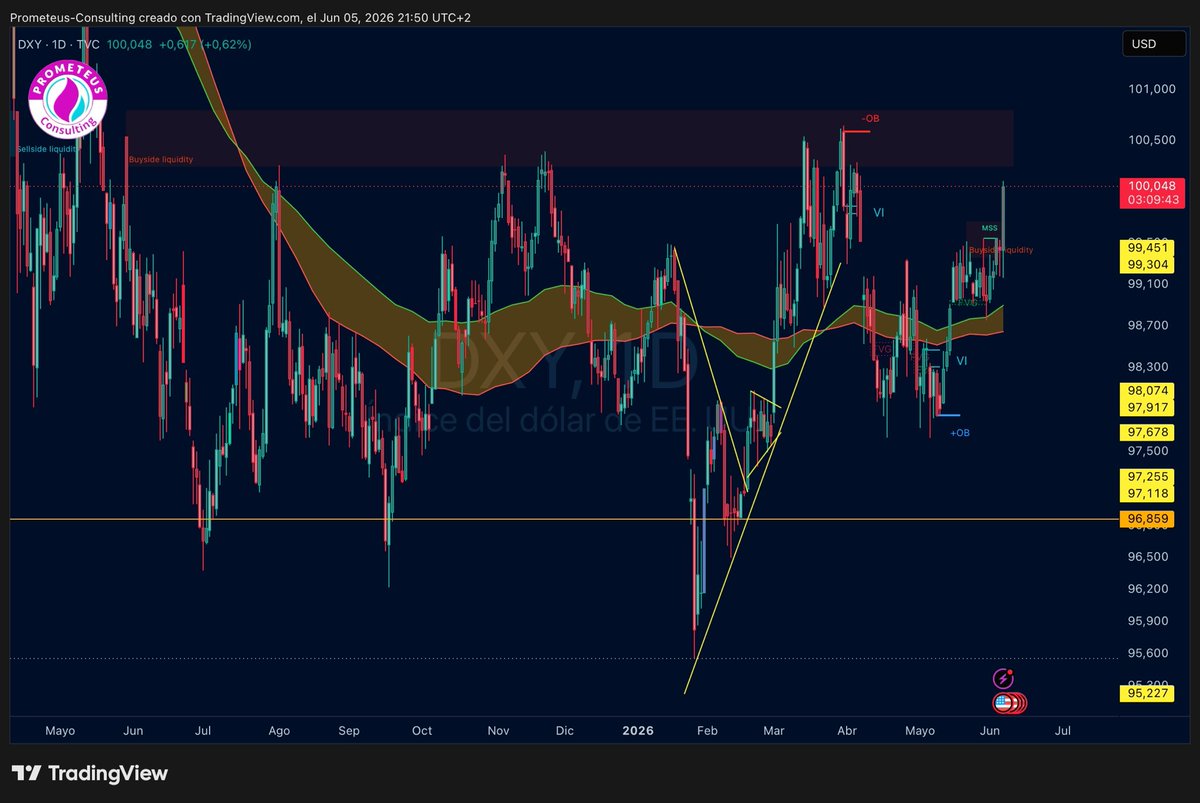
#DXY #Dollar #USD
📍Update:
Nine days ago: “Is this time different? The next daily close will tell us everything.” 👀
Today? The -OB answered.
🧵👇in comments
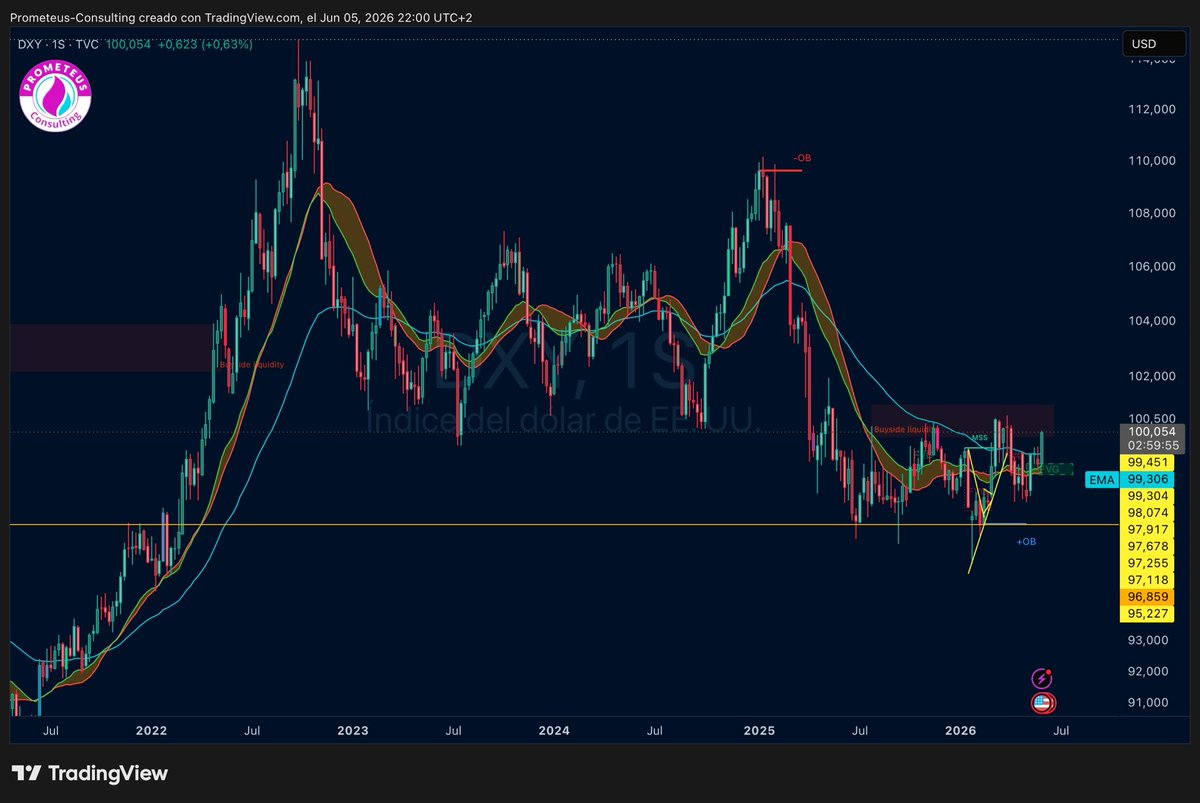
#DXY #Dollar #USD
📍 Update:
5 days ago: “96.859 is back on the clock. The thesis hasn’t changed. The chart is just executing it.” 📖
Today? The script flipped.
🧵👇in comments
1
94
📈📉Two scenarios still alive — but the balance has shifted:
🟢 Bull case — Price holds weekly EMA 99.326, reclaims 100.000 with a clean close. Thesis paused again.
🔴 Bear case — Weekly EMA lost. 99.304 breaks. Door reopens to 96.859 → 95.227.
1
12
The script didn’t flip.
It just paused. ⏳
EMAs below = last support → 100.000 rejected → -OB held → weekly EMA the line → hold or lose — 96.859 still waiting
13